Month: July 2019
The First AI to Beat Pros in 6-Player Poker, Developed by Facebook and Carnegie Mellon

MMS • RSS
Article originally posted on InfoQ. Visit InfoQ
Facebook AI Research’s Noam Brown and Carnegie Mellon‘s professor Tuomas Sandholm recently announced Pluribus, the first Artificial Intelligence program able to beat humans in six-player no-limit Texas Hold’em poker game. In the past years, computers have progressively improved, beating humans in checkers, chess, Go and the Jeopardy TV show.
Libratus which was Pluribus’s predecessor was able to beat humans in the two-player variation of Hold’em poker back in 2017. Poker poses a challenge that the above mentioned games don’t, that of hidden information. Not knowing the opponent’s cards introduces the element of bluffing , that is generally not something algorithms are good at.
In many ways, multi player poker games resemble real life situations better than any other board game. In real life, there are usually more than two actors, there is hidden information to one or more of the adversaries and it’s not a zero-sum game.
Many of the games that AI was able to beat elite human players in the past like Chess or checkers or Starcraft 2 are two-player zero-sum games. In these games, calculating and playing the Nash equilibrium guarantees that statistically and in the long run, the player can not lose, no matter what the opponent does. In the six player hold-em poker game, it’s not generally possible to calculate the Nash equilibrium. Hidden information was addressed in Pluribus predecessor, Libratus, by combining a search procedure for imperfect-information games with self-play algorithms based on Counterfactual Regret Minimization. This technique worked for the two player variation of the game, but could not scale to six players, even at 10,000 or more computing power. In contrast, what Pluribus does is playing many games with random against itself to improve its strategies against earlier variations of it, to calculate a blueprint strategy. By using iterative Monte Carlo CFR, the algorithm improves on the decisions of one player named the ‘traverser’ at each round, by examining all the available actions the traverser could had made, and what would be the hypothetical outcome. This is possible because the AI is playing against itself and so it can ask (itself) what would the non-traverser players had done in response to a different action taken by the traverser.
At the end of each iteration of learning the counterfactual regrets are updated for the traverser’s strategy. To reduce complexity and storage requirements, some actions and similar decisions are bucketed together and treated as identical. The blueprint strategy calculated during training will be further improved during playing using a search strategy, but will not be adapted to observed tendencies of adversaries in real time.
Training the algorithm took eight days on a 64-core server with less than 512GB RAM and without any need for GPUs. This is less than $150 in cloud computing costs at the time of publication. In contrast, training algorithms for other two-player zero-sum games would cost in the range of thousands to millions of dollars.
In order to keep the blueprint strategy at a manageable size, the strategy is coarse grained. At the time of play the AI algorithm will then perform a search to identify the best fine grained strategy for the situation. This search relies on assuming that the opponents may take on one of four different strategies. They may either stick to the blueprint’s strategy, they may tend to fold, they may tend to call or they may tend to raise their call. ‘tend to’ in this context, means that the strategy is biased towards this action from a probabilistic point of view. This way the search results in a balanced strategy that is difficult to counteract by human players. On the contrary, a strategy that for example would always tend to assume that the opponent would fold, would be easily identifiable by a human opponent who would adapt to it by tending not to fold.
Introducing bluffing is another interesting part of the algorithm. Pluribus bluffs by calculating the probability that it would have reached the current situation with each possible hand according to its own strategy. Then Pluribus would calculate its reaction with every possible hand, balancing the strategy across all hands. Finally, Pluribus would execute the action on the actual cards its holding on to.
Pluribus was able to beat elite human players in both 5 humans + 1 AI and 5 AI + 1 human settings. The techniques used by Pluribus are not specific to poker and don’t require any expert domain knowledge. Pluribus will be used to further enhance how to build a general AI that can cope with multi-agent environments, in collaboration with humans or other AI agents.
MMS • RSS
Article originally posted on InfoQ. Visit InfoQ
Transcript
Kung: First off, I’d like to thank all of you for choosing to attend my talk here today. Before I get started, I just wanted to address a potential confusion around the topic of my presentation – since we are in New York, this talk won’t be about the city of Brooklyn, or the beautiful bridge that is just right outside this conference. Hopefully, you guys are here to learn about this Brooklin. I get questions all the time whenever I place orders for custom things like hats, T-shirts, and stickers with our Brooklin logo on it, “Are you sure you wanted to spell ‘Brooklin’ like that, with an ‘i’ and not an ‘y’?” I always have to reassure them that I did intend to spell Brooklin.
How did we come up with the name Brooklin with an “i”? The definition of a “brook” is a stream and, at LinkedIn we like to try and incorporate “in” in a lot of our team names, product names or event names, so, if you put the two together, that gives you “brookin” but that sounds an awful lot like “broken” and that is not what we wanted to name our product after. Instead, if you combine the word “brook” and “LinkedIn”, that gives you “brookLinkedIn”, which sounds a little bit better, but it still sounds awkward. What we did was, we simply dropped the latter half of that word, and that’s how we came up with Brooklin.
Here is a picture of me wearing one of those customized T-shirts with our logo on it. My name is Celia [Kung] and I manage the data pipelines team, which includes Brooklin as part of the streams infrastructure work at LinkedIn. At LinkedIn it’s a tradition, whenever we are introducing ourselves to a large audience or a bunch of people that we don’t know, to talk about something that they cannot find on our LinkedIn profile. Something about me that’s not on my LinkedIn profile is that I am a huge shoe fanatic. I used to line up to buy shoes at stores in the mall, right before it opened, and, at one point, I used to have over 70 pairs of shoes. I used to keep them neat and tidy in their original boxes so that they could stay clean. At the time, I was living with my parents, who, needless to say, were not very happy about my shoe obsession.
Let’s dive into the presentation, here is a little bit of an outline of what I will be covering today. First, I’ll start off with a brief background and motivation on why we wanted to build a service like Brooklin. Then, I’ll talk about some of the scenarios that Brooklin was designed to handle, as well as some of the real use cases for it within LinkedIn. Then, I’ll give an overview of the Brooklin architecture and lastly, I’ll talk about where Brooklin is today and our plans for the future.
Background
When we talk about streams infrastructure, one of the main focuses is serving nearline applications. These are applications that require a near real-time response, so in the order of seconds or maybe minutes. There are thousands of such applications at LinkedIn, for example the Live Search Indices, or Notifications that you see on LinkedIn whenever one of your connections changes their profile and updates their job.
Because they are always processing, these nearline applications require continuous and low-latency access to data. However, this data could be spread out across multiple database systems. For example, at LinkedIn, we used to store most of our source of truth data in Oracle databases. But, as we grew, we built our own document store, which was called Espresso and we now have our data stored in MySQL, in Kafka, and, as LinkedIn acquired some companies that built their applications on top of the AWS and then LinkedIn itself got acquired by Microsoft which called for the need to stream data between LinkedIn and Azure.
Over the years, LinkedIn data became spread out across many heterogeneous data systems and to support all these nearline applications that needed continuous and low-latency access to all of this data, we needed to come up with the right infrastructure to be able to consume from these sources. From a company’s perspective, we wanted to allow application developers to focus on data processing logic and application logic and not on the movement of data from these sources. The streams infrastructure team was tasked with the challenge of finding the right framework to do this.
When most of LinkedIn source of truth data was stored in just Oracle and Espresso, we actually built this product called Databus, whose sole responsibility was to capture live updates being made to Oracle and Espresso and then streaming these updates to applications in near real-time. This didn’t scale so well because the Databus solution for streaming data out of Oracle was pretty specialized and separate from the solution to stream data out of Espresso, despite the fact that these two were both within the same product called Databus. At that point in time, we also needed the ability to stream out of a variety of sources.
What we learnt from Databus was that building specialized and separate solutions to stream data from and to all of these different systems, really slows down development and is extremely hard to manage. What we really needed was a centralized, managed and extensible service that could continuously deliver this data in near real-time to our applications, and this led us to the development of Brooklin.
What is Brooklin?
Now that you know a little bit about the motivation behind building Brooklin, what is Brooklin? Brooklin is a streaming data pipeline service that has the ability to propagate data from many source systems to many destination systems. It is multitenant, which means that it can run several thousand streams at the same time and all within the same cluster, and each one of these data streams can be individually configured and dynamically provisioned. Every time you want to bring up a pipeline that moves data from A to B, you simply need to just make a call to our Brooklin service and we will provision that dynamically, without needing to modify a bunch of config files, and then deploy to the cluster. The biggest reason behind building Brooklin was to make it easily extensible to be able to plug in support for additional sources and destinations going forward. So we built Brooklin with extensibility in mind.
Pluggable Sources & Destinations
This is a very high level picture of the environment. On the right hand side, you have of nearline applications that are interested in consuming data from all these various sources which you have on the left hand side. Brooklin is responsible for consuming from these sources, and shipping these events over to a variety of destinations where the applications can asynchronously consume from. In terms of sources, we focused on databases and messaging systems, with the most heavily used ones at LinkedIn being Oracle and Espresso for databases, and Kafka is the most popular source in LinkedIn as well. Most of our applications consume from Kafka as a destination messaging system.
Scenario 1: Change Data Capture
Now that you know a little bit about Brooklin, I’d like to talk about some of the scenarios that Brooklin was designed to handle. Most of these scenarios fall into two major categories at LinkedIn. The first scenario is what is known as Change Data Capture. Change Data Capture involves capturing live updates that are made to the database and streaming them in the form of a low-latency change stream. To give you a better idea of what Change Data Capture is, I’ll walk through a very simple example of how this is used at LinkedIn. Suppose there is a LinkedIn member whose name is Mochi, and she updates her LinkedIn profile to reflect the fact that she has switched jobs. Mochi used to work as a litterbox janitor at a company called Scoop, and now she switches jobs and works at a company called Zzz Catnip Dispensary, where she is a sales clerk. She updates her LinkedIn profile to reflect this change.
As a social professional network, LinkedIn wants to inform all of Mochi’s colleagues about her new job change. For example, we want to show Mochi’s job update in the newsfeed of Rolo, who is one of Mochi’s connections, and we want this to show up in the newsfeed so that Rolo could easily engage in this event by liking or commenting on it to congratulate his friend on her new job.
Mochi’s profile data is stored in a member database in LinkedIn, and one way to enable this use case that I just talked about, is to have the News Feed Service, which is a backend service, constantly query the member database to try to detect any changes that are made to the member database. It can run a lot of Select* queries and try to figure out what has changed since the last time it ran this query, to enable a use case like this.
Imagine that there is another service called Search Indices Service that is also interested in capturing live updates to the same profile data because now, if any member on the LinkedIn site does a search for Zzz Catnip Dispensary on LinkedIn, you want Mochi, who is their newest employee to show up on the search results for Zzz Catnip Dispensary and no longer in the search results of her previous company, Scoop. The Search Indices Service could also use the same mechanism, they could also query the member database frequently to try to pull for the latest changes, but in reality, there could be many such services that are interested in capturing changes to the same data, to power critical features on the LinkedIn app, like notifications or title standardization. They could all query the database, but doing this is very expensive, and, as the number of applications grows, or the size of your database grows, you are at risk of bringing down your entire database. Doing this is dangerous because you don’t want a live read or write on the LinkedIn live site to be slow or not work just because you have a bunch of services in the backend querying the same dataset.
We solved this by using a known pattern, called Change Data Capture (CDC) where all of the applications in the backend don’t query the database directly, but they instead consume from what is called a change stream. Brooklin is the force behind propagating these changes from the live sources into a change stream.
There are a couple of advantages of doing it this way – first, you get better isolation. Because applications are decoupled completely from the database source, they don’t compete for the resources with the online traffic that is happening on the site. Because of this, you can scale the database and your applications independently of each other. Secondly, applications that are all reading from a particular change stream can be at different points in the change timelines. For example, if you have four of those applications reading from a particular change stream, you can have some that are reading from the beginning, some from the middle, some from the end – it doesn’t matter, they can all read at their own pace.
Here is a high-level overview of what Change Data Capture looks like at LinkedIn. Brooklin is responsible for consuming from the source databases and note that Brooklin itself does not Select* queries on the database itself, it doesn’t compete for resources with the online queries, instead, it depends on the source. For example, if you want to stream data out of Oracle, Brooklin may read from trail files in Oracle databases or, if you wanted to stream from MySQL, Brooklin would read from the bin log. It depends on the source, but Brooklin does not do Select* queries on the source.
When it captures these changes from the database, it feeds them into any messaging system, and our most heavily used messaging system, as many of you may know, is Kafka. Because Kafka provides pretty good read scaling, all of these applications, if necessary, could all read from the same Kafka topic to retrieve these changes.
Scenario 2: Streaming Bridge
That was Change Data Capture, and the second scenario that Brooklin was designed to handle is what is called a Streaming Bridge. Streaming Bridge is applicable when you want to move data between different environments. For example, if you want to move data from AWS to Azure, or if you want to move data between different clusters within your datacenter, or if you want to move data across different data centers as well, any time you want to stream data with low-latency from X to Y, is where a streaming bridge is required.
Here is a hypothetical use case of a streaming bridge. In this example, Brooklin is consuming from two Kinesis streams in AWS and moving this data into two Kafka topics in LinkedIn. Because Brooklin is multitenant, that same Brooklin cluster is also reading from two other Kafka topics in LinkedIn, and feeding this data into two EventHubs in Azure.
Having a streaming bridge allows your company to enforce policies. For example, you might have a policy that states that any data that is streamed out of a particular database source, needs to be encrypted because it contains some sensitive information. You may also have another policy that states that any data that is coming into your organization, should be of a particular format – say Avro or JSON. With Brooklin you can configure these pipelines to enforce such policies. This is very useful because having a bridge allows a company to manage all of their data pipelines in one centralized location, instead of having a bunch of different application teams manage their one-off data pipelines.
Mirroring Kafka Data
Perhaps the biggest Brooklin bridge use case at LinkedIn is to mirror Kafka data. Kafka is used heavily at LinkedIn and it actually came out of LinkedIn, as most of you may know. It’s used heavily to store a bunch of data like tracking, logging and metrics information. Brooklin is used to aggregate all of this data from each of our datacenters to make it easy to access and process this data in one centralized place. Brooklin is also used to move data between LinkedIn and external cloud services. For example, we can move data between Kafka and LinkedIn and Kafka running on Azure. Perhaps the biggest scale test for Brooklin was the fact that we have fully replaced Kafka MirrorMaker at LinkedIn with Brooklin.
For those of you who are not familiar with Kafka MirrorMaker, it is a tool that is included within the open source Kafka project that supports streaming data from one cluster to another and many companies use Kafka MirrorMaker for this purpose.
At LinkedIn, we were seeing a tremendous growth in the amount of Kafka data, year after year, and in fact we were probably one of the largest users of Kafka in terms of scale. As this Kafka data continued to grow, we were seeing some real scale limitations with Kafka MirrorMaker. It wasn’t scaling well, it was difficult to operate and manage at the scale that LinkedIn wanted to use it, and it didn’t provide very good failure isolation.
For example, if Kafka MirrorMaker hit any problems with mirroring a particular partition or a particular topic, oftentimes the whole Kafka MirrorMaker cluster would simply just fall over and die. This is problematic because all of the topics and partitions that the cluster is responsible for mirroring are also down with it, so they are all halted just because there is a problem with one particular pipeline or topic. In fact, in order to mitigate this operational nightmare, we were running a nanny job, whose sole purpose was to always check the health of all of these Kafka MirrorMaker clusters and, if one of them is down, then its job is just to restart the Kafka MirrorMaker cluster.
This wasn’t working well for LinkedIn. What did we do? We already had a generic streaming solution in Brooklin that we had recently built, so we decided to double down on Brooklin and use it to mirror Kafka data as well. When we talk about Brooklin pipelines that are used for Kafka mirroring, these are simply Brooklin pipelines that are configured with a Kafka source and a Kafka destination. It was almost as easy as that. By doing this, we were able to get rid of some of the operational complexities around managing Kafka MirrorMaker and this is best displayed by showing you what the Kafka MirrorMaker topology used to look like in LinkedIn.
I’ll take a very specific example, where we want to mirror two different types of Kafka data – tracking and metrics data. We want to mirror from tracking and metrics clusters into the respective aggregate metrics and aggregate tracking clusters, in let’s say three of our datacenters. To do this very simple thing, we actually had to provision and manage 18 different Kafka MirrorMaker clusters. You can imagine that, if we wanted to make a simple change, let’s say that we wanted to add some topics to the mirroring pipelines of our metrics to aggregate metrics pipelines, we had to make nine config changes for each of these nine Kafka MirrorMaker clusters, and we had to deploy to nine different Kafka MirrorMaker clusters as well.
In reality, we have more than just two types of Kafka clusters at LinkedIn, and we have more than just three datacenters, so you can imagine the spaghetti-like topology that we had with Kafka MirrorMaker. In fact, we had to manage probably over 100 Kafka MirrorMaker clusters at that time. This wasn’t just working well for us.
Let me show you what the topology looks like when we replaced Kafka MirrorMaker with Brooklin. With the same example of mirroring tracking and metrics data into aggregate tracking and aggregate metrics data, in three of our datacenters, we only need three Brooklin clusters to do this. We are able to reduce some of the operational overhead by doing this because Brooklin is multitenant, so it can power multiple data pipelines within the same cluster. Additionally, a lot of management overhead is taken away from the picture because we are able to dynamically provision and individually configure these pipelines. So, whenever we want to make a simple change, like the one I mentioned earlier of adding some topics to the whitelist, it’s very easy to do that. We don’t need to make any config changes, we don’t need to do any deployments.
Brooklin Kafka Mirroring
Brooklin’s solution for mirroring Kafka data was designed and optimized for stability and operability because of our experiences with Kafka MirrorMaker. We had to add some additional features to Brooklin to make this work. Before this, Brooklin could only support consuming from one topic in the source and writing to one topic in the destination, but Brooklin mirroring was the first use case where we needed to support a Star-to-Star or a Many-to-Many configuration, so we had to add some additional features to be able to operate at each individual topic level. What we did was we added the ability to manually pause or manually resume mirroring at every single granularity. For example, we could pause the entire mirroring pipeline, we could pause an individual Kafka topic or we could pause just a single partition if we wanted to. Additionally, if Brooklin was facing any issues during mirroring, for example, if it has issues mirroring one particular topic or one particular partition, it has the ability to auto-pause these partitions. Contrast that with the setup of Kafka MirrorMaker where, if it saw any issues with a particular topic, it would simply fall over and leave all of the other partitions hanging. With Brooklin, we can auto-pause and this is very useful whenever we see transit issues with mirroring from a particular topic or partition. This also reduces the need for a nanny job or any manual intervention with these pipelines.
Whenever a topic is auto-paused, Brooklin has the ability to automatically resume them after a configurable amount of time. In any case when anything is paused, the flow of messages from other partitions is completely unaffected. We really built this with isolation at every single level.
Application Use Cases
Now that you know the two scenarios that Brooklin was designed to handle – Change Data Capture and Streaming Bridge – I’ll talk about some of the real use cases for Brooklin within LinkedIn. The first one is very popular, it’s for Cache. Whenever there is a write to a particular data source, you want to keep your cache fresh and you want it to reflect this write too and Brooklin can help with keeping your cache in sync with the real source.
The second one is similar to what I mentioned earlier, it’s for Search Indices. Suppose that you worked at a company and now you work at company X, you want to show up in the search results of company X and no longer in the search results of your previous company. You can use Brooklin to power Search Indices as well, this is what we do at LinkedIn.
Whenever you have source of truth databases, you might want to do some offline processing on the full dataset. One way that you can do this is you can take these daily or twice a day snapshots of your entire dataset and then ship this over to HTFS where you can do some offline processing and run some reports. But, if you do this, the datasets and the results can become pretty stale because you are only taking these snapshots once or twice a day. Instead, you can consume from a Brooklin stream, to more periodically merge the change events into your dataset in HTFS and to do ETL in a more incremental fashion.
Another common use case is for materialized views. Oftentimes, when you are provisioning a database, you choose a primary key that best fits the access patterns of the online queries that will always be retrieving this data. But there can be some applications that want to access the data using a different primary key, for example, so you can use Brooklin to create what is called a materialized view of the data by streaming this data into another messaging system.
Repartitioning is similar to the materialized views use case, but it’s simpler – it’s just to repartition the data based on a particular key. I’ll skip through some of these use cases in the interest of time, I think I talked about a few of them before. I’d really like to get into the architecture of Brooklin.
Architecture
To describe the architecture, I’ll focus on a very specific and simple use case, which is where Brooklin wants to stream updates that are made to member profile data, particularly this scenario here. Brooklin wants to retrieve all the changes that are being made to the member database and stream them into a Kafka topic, where the news feed service can consume these change events, do some processing logic, and then enable features such as showing the job update for all Mochi’s connections, in this case, on their news feed. In this case, we have the source database as member database profile table in Espresso. The destination is Kafka, and the application that wants to consume from it is the news feed service.
Datastream
Before I jump into the architecture, it’s important to understand the fundamental concept of Brooklin, which is known as a datastream. A datastream describes the data pipeline, so it has a mapping between the specific source and a specific destination which you want to stream data from and to. It also holds additional configuration or metadata about the pipeline, such as who owns the datastream and who should be allowed to read from it and what is the application that needs to consume from it.
In this particular example, we will be creating a datastream called MemberProfileChangeStream and the source of this is Espresso, specifically the member database/ profile table and it has eight partitions. The place that we want to stream this data into is in Kafka, specifically to a particular topic called the ProfileTopic and it also has eight partitions. We also have some metadata in the datastream, such as the application which should have read permissions on the stream and which team at LinkedIn owns the datastream – which is this case is the news feed team.
To get Brooklin started, we need to create a datastream. To do this, at LinkedIn, we offer a self-service UI portal where our applications can go to, to provision their data pipelines whenever they need to within minutes. An application developer will go to this self-service portal, they will select that they need to stream data from Espresso, specifically the member database, profile table, and they will select that they need to stream this data into a Kafka topic. It’s pretty easy, they just select the source and destination, and then they click “create” and this create request makes it to a load balancer where one of the requests goes to any of the Brooklin instances in our Brooklin cluster. It hits the request of this Brooklin instance on the left hand side, and specifically, it goes to what is called the datastream management service (DMS), which is just our REST API, to be able to do “create” operations on datastreams. We can create, read, update, delete and we can configure these pipelines dynamically.
Once the Brooklin instance receives this request to create a datastream, it simply writes the datastream object into ZooKeeper. Brooklin relies on ZooKeeper to store all of our datastream, so that it know which data pipelines it needs to process. Once the datastream has been written to ZooKeeper, there is a leader coordinator that is notified of this new datastream. Let me explain what a coordinator is in this example. The coordinator is the brains of the Brooklin host. Each host has a coordinator, and upon startup of the cluster, one of the coordinators is elected as the leader, as part of ZooKeeper’s standard leader election recipes. So, whenever a new datastream is created or if it’s deleted, the leader coordinator is the only one that is notified of this new datastream.
Because Brooklin is a distributed system, we don’t want this datastream to be just processed by a single host in the cluster. Instead, we want to try and divide this work amongst all of the hosts in the cluster. The leader coordinator is responsible for calculating this work distribution. What it does is it breaks down the datastream, which I mentioned earlier, and it splits them up into what is called datastream tasks, which are the actual work units of Brooklin.
The tasks may, for example, be split up by partitions – it really depends on the source. The leader coordinator calculates this work distribution, comes up with a task assignment, and it simply writes these assignments back into ZooKeeper. Once that happens, ZooKeeper is not only used for our metadata store to store datastreams, but it is also used for coordination across our Brooklin cluster. What happens is ZooKeeper is used to communicate these assignments over to all of the coordinators in the rest of the cluster. Each of the coordinators that was assigned a datastream task, will now be aware that they need to process something.
The coordinators now have the datastream tasks that are assigned to them and they need to hand these tasks off to the Brooklin consumers. The Brooklin consumers are the ones that are responsible for actually fetching and reading the data from the source. How do the coordinators know which Brooklin consumer to hand these tasks off to? As I showed you in the datastream definition, there is a specific source – in this case it is Espresso – and this information is also held within our work units or our datastream tasks. The coordinator knows that for this task, it needs to hand off this task to the Espresso consumer specifically.
Once the Espresso consumer receives this task, it can now start to do the processing. It can start to stream data from whatever source it needs to stream from – in this case it is Espresso – and the datastream task also tells that it needs to stream from member database and specifically the profile table. The consumers each start streaming their own portion of the dataset, and they propagate this data over to the Brooklin producers.
How do the consumers know which producers to pass this data onto? Similar to what I mentioned earlier, the datastream task has the mapping between the source type and the destination type and in this particular example it is Kafka. The Espresso consumers know that they need to deliver their data over to the Kafka producers within their instance.
Once the Kafka producers start to receive this data from the Espresso consumers, they can start to feed this data into the destination, in this case it is the profile topic of Kafka. Data starts flowing into Kafka and, as soon as this happens, applications can start to asynchronously stream data out from the source. In this example, the news feed service can start to read those profile changes from Kafka.
In the previous examples earlier in this presentation, I talked about many applications potentially needing access to the same data because profile data is very popular for nearline applications in LinkedIn, there could be notification service, search indices service that are also interested in profile updates. In this scenario, the Kafka destination or the Kafka profile topic, can be read by many applications. Each of these applications or each of these application owners still need to each go to our self-service UI portal where they can create their own datastream, so each team still needs to have their own logical data stream. However, Brooklin underneath the hood knows how to re-use specific datastream tasks or re-use certain work units, so that, if a particular source and destination combination are very common, it won’t do the same work twice. It won’t do the same work of streaming from the database or writing into a separate Kafka topic twice; it will re-use those components and simply allow those additional services to consume from the same Kafka topic that already exists with that data.
Overview of Brooklin’s Architecture
Stepping back from the particular example that I’ve been talking about, here is a very broad overview of Brooklin’s architecture. Brooklin doesn’t depend on very much, it only requires ZooKeeper for storage of datastream metadata, as well as for coordination across the Brooklin cluster. I talked a little bit about the datastream management service, it is our REST API which allows users or services to dynamically provision or dynamically configure individual pipelines and coordinators are the brains of each Brooklin instance that are responsible for acting upon these changes to datastream as well as distributing the task assignments or receiving the task assignments from ZooKeeper.
In reality, Brooklin can be configured with more than just an Espresso consumer and a Kafka producer; it can be configured with any number of different types of consumers and any number of different types of producers. In fact, you can configure your Brooklin cluster to be able to consume from MySQL, Espresso, Oracle and write to EventHubs, Kinesis, and Kafka. One Brooklin cluster can take care of all of this variety of source and destination pairs.
Brooklin – Current Status
That was very high level of Brooklin’s architecture and now I’ll talk about where Brooklin is today. Today, Brooklin supports streaming from a variety of sources, namely Espresso, Oracle, Kafka, EventHubs and Kinesis and it has the ability to produce to both Kafka and EventHubs. Note that the consumer and producer APIs for Brooklin have standardized APIs to support additional sources and destinations.
Some features that we built within Brooklin so far are that it is multitenant, it can power multiple streams at the same time within the same cluster. And in terms of guarantees, Brooklin guarantees at-least-once delivery and order is maintained at the partition level. If you have multiple updates, being written to the same partition, we can guarantee that the ordering of these events to this specific partition are going to be delivered in the same order.
Additionally, we made some improvements specifically for the Kafka mirroring use case at Brooklin, which is to allow finer control of each pipeline – which are the pause and resume features that I talked about earlier – as well as improved latency with what is known as a flushless-produce mode.
If you are familiar with Kafka, you know that the Kafka producer has the ability to flush all the messages that are in the Kafka producer buffer, by calling KafkaProducer.flush. However, doing this is a blocking call, so it is synchronous, and this can often lead to a lot of delays in terms of mirroring from source to destination. We added the ability inside Brooklin’s Kafka mirroring feature to run flushless, where we don’t call flush at all and instead, we keep track of all of the checkpoints for every single message and we keep track of when they were successfully delivered to the destination Kafka cluster.
For streams that are coming from Espresso, Oracle or EventHubs, as a source, Brooklin is moving 38 billion messages/ day and we have over 2000 datastreams that we manage for our company over 1000 unique sources and we are serving over 200 applications that need all of these data from these unique sources.
Specifically for Brooklin mirroring Kafka data, which is huge at LinkedIn, we are mirroring over 2 trillion messages / day with over 200 mirroring pipelines and mirroring tens of thousands of topics.
Brooklin – Future
For the future of Brooklin, we want to continue to add more support to consume from more sources and write some more destinations. Specifically, we want to work on the ability to do change capture from MySQL, consume from Cosmos DB and Azure SQL, and we want to add the ability to write to Azure Blob storage, Kinesis, Cosmos DB, Azure SQL, and Couchbase.
We are continuing to make additional optimizations to the Brooklin service or the Brooklin engine itself as well. We want to have the ability for Brooklin to auto-scale its datastream tasks based on the needs of the traffic. We also want to introduce something that’s called passthrough compression because in the Kafka mirroring cases it’s very simple – you just want to read some bytes of data from the source Kafka topic, and you want to deliver these bytes of data into the destination Kafka topic and you don’t need to do any processing on top of this data. But instead, what is inside the Kafka consumer and Kafka producer libraries of the Kafka product itself, is that upon consumption of Kafka data, the Kafka consumer will de-serialize the messages that were stored in the source and then, when mirroring, we produce to the destination and the Kafka producer will actually re-serialize these messages to compress them in the destination.
Because we are mirroring just bytes of data, we don’t care about the message boundaries of Kafka data and we just want to mirror chunks of data from Kafka as is. You want to be able to skip the process where the Kafka consumer de-serializes and skip the producer to do the re-serialization, which is known as passthrough compression. We know that this can save a lot of CPU cycles for Brooklin and therefore reduce the size of our Brooklin mirroring clusters.
We also want to do some read optimizations. If there are a couple of datastreams that are interested in member database, say that there are two tables inside the member database that customers are interested in, we would have to create one datastream to consume from table A and one datastream to consume from table B. However, we want to do some optimizations such that we only need to read from the source one time and be able to deliver these messages into topic for table A and topic for table B.
The last thing for the future of Brooklin, is that I am very excited to announce that we are planning to open-source Brooklin in 2019 and this is coming very soon. We’ve been having plans to do this for a while and it is finally coming to fruition.
Questions and Answers
Participant 1: I am really happy to hear about the open-sourcing at the end, I was going to ask about that. My team uses Kafka Connect, which is pretty similar to a lot of this and is part of Kafka. Can you give a quick pitch for why you might use Brooklin over Kafka Connect?
Kung: This is a pretty common question, it’s a good question. As far as I know, Kafka Connect, you can configure it with sync or source, but my understanding is that you cannot configure them with both. If you configure Kafka connect with a source of your choice, then the destination is automatically Kafka. And, if you configure it with a sync, then your source is automatically Kafka.
Brooklin provides a generic streaming solution – we want to be able to plug in the ability to read from anywhere to anywhere and Kafka doesn’t even have to be involved at all on the picture.
Participant 2: Fantastic talk. My team is heavy users of Cosmos DB that I saw it was on the slide “Future” and I was curious where that is at in the roadmap and if there are plans to support all the APIs that Cosmos offers, the document DB, Mongo, etc.?
Kung: I have to say that this is very early. We have just started exploring, so we are not quite there in providing support for Cosmos just yet, but it is definitely on the roadmap.
Participant 3: How do you deal with schema changes from the tables up to the clients who consume this data?
Kung: To handle schema changes, I think varies by the source, so it depends. All of these schema changes need to be handled by the consumer. These consumer APIs that are very specific to the source that you need to consume from, they each need to take care of all of this schema updates, and we handle it differently for each of our data sources. I’d be happy to give you a deep dive later if you can me in this conference to talk about how we solve it for Espresso vs how we solve it for Oracle, for example. It’s pretty low level.
Participant 4: Two questions. One is that we use Attunity or GoldenGate, one of the more established CDC products – how do you compare with those products? And number two, we have Confluent infrastructure that has a Connect framework. How do you play into this? How do you merge Brooklin platform into a Confluent platform?
Kung: Your first question: Golden Gate is for capturing change data from Oracle sources, right? As I mentioned earlier, Brooklin is designed to be able to handle any source, so it doesn’t have to be a database; it could be a messaging system. And it doesn’t have to be Oracle as well, but one of the features of Brooklin is to consume changes that are captured out of Oracle.
Participant 4: Maybe we should look for a more feature-by-feature comparison and if there is a website or someplace – it’s deeper than that.
Kung: I am happy to talk to you afterwards as well. Your second question was if we plug in to Kafka’s Connect at all? We don’t connect with Kafka’s Connect at all, Brooklin doesn’t as a product. To further elaborate on the question, we use the native Kafka consumer and Kafka producer APIs to be able to read from Kafka or produce to Kafka, we don’t use Kafka Connect.
Participant 5: On partitioning and on producing to Kafka, you mentioned ensuring partition keys. Do you guys have an opinion about how you go about finding those partition keys, mapping from one source to another?
Kung: How do you come up with the right partition keys to produce to Kafka? That is not something that Brooklin necessarily handles, but each application that’s writing to Kafka would need to select the right partitioning key, depending on the order of messages that they need. If they need to guarantee that all updates going to a particular profile were in order, then they would choose profile ID as the partition key for example – it just depends on the use case. Some applications don’t care about ordering within the partitions, so they would just use the default partitioning strategy of Kafka which is just Round-Robin of the partitions to send it to any partition.
Participant 6: Thank you for this amazing talk and looking forward to see the open-source. Can you tell us how easily we could extend and write plug-ins? Will you provide a framework or will there be a constraint on languages to use to write plug-ins for more sources or destinations? A preview of the open-source, basically.
Kung: Brooklin is developed in Java; when we open-source it, it will be Java and we designed it so that it’s easy to plug in your own consumer or producer, so the APIs are very simplified. I think each one of these APIs has four or five methods that you can use to implement your specific consumption from a particular source and write to a particular destination. We’ve done this a bunch of times, as you saw on the “Current” slide, we already support a bunch of sources. We built that with extensibility in mind, so hopefully it should be very easy for you to contribute to open-source by writing a consumer or producer in Java.
Participant 7: Maybe it’s orthogonal to the problem you guys have looked at, but what kind of data cataloguing, data management tools do you use as front-end for Brooklin? What data is available and who can access it? Some data is premium or not.
Kung: I briefly touched upon this, but to go in a little bit more detail, I mentioned that we have a self-service portal UI, where our developers can go to, to provision these pipelines – at LinkedIn it is called Nuage; it is like a cloud-based management portal. They connect with all sorts of sources like Espresso team and MySQL team, Oracle team, Kafka team to get all this metadata, and they house this metadata, so that they can show this up on the UI, so that application developers know what is available and what is not available.
See more presentations with transcripts
MMS • RSS
Article originally posted on InfoQ. Visit InfoQ
On his continuing quest for productivity and performance in the Java language, Brian Goetz, Java language architect at Oracle, along with Alex Buckley, specification lead for the Java language and Java Virtual Machine at Oracle, proposed a set of hyphenated keywords to evolve a mature language in which adding new features can be a challenge with the current set of keywords as defined in the Java SE 12 Java Language Specification.
The goals of implementing hyphenated keywords, as specified in JDK-8223002, are:
- Explore the syntactic options open to Java language designers for denoting new features.
- Solve the perpetual problem of keyword tokens being so scarce and expensive that language designers have to constrain or corrupt the Java programming model to fit the keywords available.
- Advise language designers on the style of keyword suited to different kinds of features.
Several techniques have been used over the years to evolve the language: [a] eminent domain – reclassify an identifier as a keyword (such as assert in Java 1.4 and enum in Java 1.5); [b] overload – reuse an existing keyword for a new feature; [c] distort – create a syntax using an existing keyword (such as @interface); [d] smoke and mirrors – and create the illusion of a new keyword used in a new context (such as var with limited to local variables). These techniques have all been problematic in some way. For example, the addition of assert as a keyword broke almost every testing framework.
The hyphenated keyword concept would complement these existing techniques and would use a combination of existing classic and/or contextual keywords. Classic keywords are “a sequence of Java letters that is always tokenized as a keyword, never as an identifier.” Contextual keywords are “a sequence of Java letters that is tokenized as a keyword in certain contexts but as an identifier in all other contexts.” Examples of proposed hyphenated classic keywords would include: non-final, break-with, and value-class. Examples of proposed hyphenated contextual keywords would include: non-null, read-only, and eventually-true.
One of the challenges implementing hyphenated keywords involves how an arbitrary lookahead or fixed lookahead lexer should parse an expression such as a-b as a three tokens (identifier, operator, identifier) or a hyphenated keyword.
An OpenJDK e-mail conversation earlier this year proposed introducing the break-with hyphenated keyword for JDK 13 (scheduled to be released in September 2019). However, it was ultimately decided to drop the break-with keyword in favor of a new keyword, yield and to re-preview switch expressions. The eventual finalization of the new switch expression construct should clear the way to introducing the pattern matching concept that has been under discussion for almost two years.
Goetz and Buckley commented on the pros and cons of the hyphenated keyword concept, writing:
Leaving a feature out of Java for reasons of simplicity is fine; leaving it out because there is no way to denote the obvious semantics is not. This is a constant problem in evolving the language, and an ongoing tax paid by every Java developer.
One way to live without making new keywords is to stop evolving Java entirely. While there are some who think this is a fine idea, doing so because of the lack of available tokens would be a silly reason. Java has a long life ahead, and Java developers are excited about new features that enable to them to write more expressive and reliable code.
Goetz spoke to InfoQ about these proposed hyphenated keywords:
InfoQ: What has been the community response for hyphenated keywords in the Java language?
Goetz: As you might expect, it has covered the spectrum. Some were pleased to see the care that goes into questions of how to best evolve a mature language; others complained that we were philosophizing about angels on the head of a pin, and would have preferred we work on their favorite feature instead.
InfoQ: What is the likelihood that the existing techniques, “eminent domain,” “overload,” “distort” and “smoke and mirrors,” be used again to expand the set of keywords in the Java language if the hyphenated keyword proposal isn’t accepted?
Goetz: I look at it as a menu of options, with an interesting and flexible new option having been added to the menu. Still, in any given situation, one of the other options may still be better. We’re not ruling anything out.
InfoQ: As per JEP 354, the proposed break-with hyphenated keyword was dropped in favor of the new keyword, yield for JDK 13. What led to the decision not to use the first hyphenated keyword in the Java language?
Goetz: The leading hyphenated candidate was
break-with, but in focus groups with users, people still found it fussy and non-obvious. Hyphenated keywords are on the menu, but that doesn’t mean we have to order them for every meal. Overall, people foundyieldmore natural (though, of course, some didn’t like that as it reminds them of returning a value from a coroutine). It turned out thatyield, in the specific grammar position it was in, was a reasonable candidate for a contextual keyword (not all grammar positions are as amenable).
InfoQ: As Java evolves more quickly with the six-month release cycle, how likely will a hyphenated keyword be ultimately introduced into the Java language?
Goetz: When we need one, it’s on the menu. It’s likely that Sealed Types will require a way to opt out of sealing, such as
non-sealed.
InfoQ: What is the single most important take-home message you would like our readers to know about hyphenated keywords?
Goetz: That we’re serious about balancing the need to evolve the language compatibility while keeping it readable.
Resources
Presentation: The User Journey of a Refugee: How we introduced an Agile Mindset to the Nonprofit Sector
MMS • RSS
Article originally posted on InfoQ. Visit InfoQ
About the conference

Many thanks for attending Aginext 2019, it has been amazing! We are now processing all your feedback and preparing the 2020 edition of Aginext the 19/20 March 2020. We will have a new website in a few Month but for now we have made Blind Tickets available on Eventbrite, so you can book today for Aginext 2020.
MMS • RSS
Article originally posted on InfoQ. Visit InfoQ
Transcript
Heinlen: It all started about a year ago, I got a new job at Netflix, it was super amazing. I got to be on this brand-new team, got to do some really cool projects which is always way fun. We evaluated what tools or languages we wanted to use as a part of this. A lot of teams at Netflix use Java, some are using Ruby, Node here and there. We read up on the pros and cons, but ultimately we chose Apollo, GraphQL, Node, TypeScript with very little entities. I’m very proud of that.
Over the year or so that I’ve been working on this project, our team often eats lunch together and they would always want to know how this project was going because we had adopted a lot of these new tools, and in particular the GraphQL segment of this there, was just a lot of interest in. As I learned more and more about this technology, I would always rave about the cool new features or how it was different than REST, or what I was confused about with what I was learning. I didn’t realize I was doing this, but every lunch I would be like, “Oh, I’m not really sold yet,” after every single time we would talk about it, so I inherited this catchphrase of not being sold yet, even though every day I’m talking about how cool it is.
After a couple of months my friends convinced me to give a talk from a skeptic point of view, so I did and I’ve given it this talk once before or so. The first thing you do when you get accepted to give a talk or when Anna asked me to come talk on this, is you buy all the books to try to figure out what the GraphQL is, so I did that.
I hope you’ve heard of this thing called GraphQL, if not, you’re probably in the wrong talk, but I really hope that I can shed some light to the power that I think GraphQL really brings. If not thing else, I hope to give you some talking points if you’re already sold to go tell your other teammates. The truth of it is, until recently I wasn’t really that big of a fan of GraphQL. I hadn’t really used it in any production capacity, I hadn’t built any side projects with it, and honestly, I thought it was just this new front end fad that would come and go. Once I started looking into it, really building things with it, digging into it, I noticed some things that I liked about it weren’t actually much of the technical parts at all. I really enjoyed what it would enable for an organization, and help solve problems I think people face day-to-day within big teams. Since then, I’m a convert. I’m GraphQL enthusiast.
I just moved from Australia, I like video games, I’m really excited to be here so please feel free to come talk to me after this. I’m happy to share all my experiences and thoughts around this topic, so don’t be shy.
Working at Netflix
I work at Netflix and I’ve been there a little bit over a year, it’s gone by amazingly fast. I feel really grateful to be a part of such a great organization and team within Netflix, and they have a very interesting culture, very unlike anywhere else I’ve ever worked. I think I’ve learned a lot and grown a lot professionally as well as technically.
Before we get started, I want to share some context around how Netflix actually operates and works. The topic of this presentation is basically two main organizations. One is product or streaming, which you are all hopefully familiar with, like recommendations, downloads, things like this. The other one that’s less known about is the content engineering space where we actually help build and facilitate all the tools that go into creating these shows that we all watch. That’s the one that I work within.
What does that really mean? Let’s say you want to make a band, you need to find people to be in your band. You’ve got to find a place to practice, you’ve got to figure out what kind of genre music you’re going to play. That’s just the start. You’ve got to get your first gig, you’ve got to record your first album. You start selling some CDs, where do you sell your CDs, what languages do you distribute this in? Stuff like this. You’ve got to work out who gets paid. Does the lead singer get paid twice as much because they sing? That doesn’t make sense. A whole lot goes into making these shows, and that’s basically where our teams come in.
In short, we help create all the Netflix originals. We’re building the largest internal studio in the world and we have to do that in a way that will scale, not with people but with technology. We often look at what technologies we can use to do this, and we really think that GraphQL is going to have a big impact on that role. Netflix has heaps of teams, an ever larger growing amount of teams, and each team has the freedom and responsibility however they see fit. There’s no one dictating way of ruling us, building systems, it’s very freeform. The top spots are innovation, creativity, and it powers individuals to build things the best way possible. This talk is going to specialize in particular within my team within my organization, but more and more teams are starting to use GraphQL across the entire company.
Netflix’s culture is very different than everywhere else, they like to take really big bets. They started getting DVDs and shipping them around the world, and now they’re one of the largest streaming platforms in the world. They didn’t do that by always playing the safe bet, we pride ourselves on making these big bets and like [inaudible 00:05:27] when made a mistake or when they fail, but we really believe that GraphQL is going to drive us forward in the next phase of our development cycle.
My team has been building a single entity graph over the last year or so. We have a lot of different downstream services, so some of them are gRPC integration, some of them are Java, some of them are Ruby, some of them are REST. The thing is, we don’t really care. We define a GraphQL schema that’s a product focus representation of our domain, and then we build UI’s against them. How we feed the data to that graph is irrelevant for allowing us to move very quickly. We’ve been showing this off to other people and they want it as well. It’s definitely spreading within our organization over the last many months. Many of these graphs, single entity graphs, are starting to emerge and people want to keep adding their entities to ours, they want to get ours into their systems, and it’s just really becoming a contagious system within our organization.
We’re still really early on in this journey. I think GraphQL is still a fairly new technology, and we’ve only recently been using it, so I’m excited to hear from people in this audience if you have more experience or things you can help us learn from, please come tell me those things.
QL is Good for Teams
Why should we all care about Graph QL? Why are you hosting a conference? Why are you all here listening to me talk about it? At the end of the day, I think GraphQL is really good for teams. It fosters team communication in an unmatched way, it radically improves the way front end and back end engineers work together, and acts as a living source of documentation for your taxonomy of your API of your system. It’s a really powerful tool, so let’s dig into why I think it’s good for teams.
This is a really big rock, and so is this one. Any guess what this one is? These are all monoliths. This might be an unpopular opinion, but I think monoliths are really great. They have their own problems, I’m sure. Maybe you’ve all experienced them in your past, but I would argue that a lot of essential companies started as a monolith and there must be some reasons for this. If you look into them, they have some really interesting characteristics.
All the code lives in one source, single system. Each commit is an atomic action. It’s easier to debug because it’s all in one stack trace. You generally don’t version because you’re the only client of yourself generally. I guess you could summarize to say information is easy to find when it’s in one place. It might be a big ball of mud, but you love that ball of mud and you know how to find it, dig your way through it.
On the other hand, though, distributed systems are inherently complex. They’re only as good as the internet in between them. You have to figure out some way to pass messages between them, you have distributed transactions, you have eventual consistency. Some of those buzzwords I was able to find on google.com. Anyway, information is harder to find when it’s spread across everything, so everything is isolated and separated. There’s definitely a lot of pros of this, but I would argue it’s much more complex.
Why do we opt for the more complex almost often of the two? I think most successful projects started as a monolith, but we almost always choose the harder of the two. I don’t believe it’s a coding problem at all, I think it’s a people problem, because when you break it down, communication is very complex. It’s inherently lossy, it breaks on its scale. It’s just an interesting topic in general, where I have a thought in my mind and I want to put that same thought in your mind, and all I have to do that is with words. And that’s just challenging one-to-one, let alone when you have 30 or 40 people on your team all trying to move the same directions. Computers will do what we tell them to; people aren’t always so easy.
I’ve been mixing these words on purpose here. There’s a really good talk by Rich Hickey called “Simple Made Easy.” He covers the main difference between simple and easy, complex and hard. You should really go watch that, so much better than this one, but not right now. I’ll try to summarize it very quickly. Simple is composed of a single element. It’s very easy to see where one thing starts, and where it ends. A straight rope, pretty simple. On the other hand, this is a complex system. There’s one rope, it’s very hard to know where one starts and one ends, they’re really combined together. This is interesting, but let’s see how this comes into play with our day-to-day interactions within our team.
If you look at this amazing diagram that I prepared earlier, each circle is a person and each line is a communication path between a person to a person. If you have three people on your team, you have three lines and they’re very simple, they’re not complex, they’re very one-to-one. If you double the size of a team to six, now you have 15 lines. If you go to a team of just 12, it becomes a very complex matrix of interactions within people on your team. As lines generally get bigger or more numbers of them, you usually need more process. You might have impromptu daily standups or you might have Scrum management, you might have Agile coaches, whatever. It gets way more complicated as you progress in the system.
How do we scale this? There’s no way that 12 people or 50 people or 100 people all working on one system can really work efficiently, quickly, all moving in the same direction, because the cost of communication is too complicated and too high. The most logical thing, which I’m sure is no surprise to much of you, is to break these into smaller teams. When you go back to the dream people of three people, three lines, not a very complicated system. The same number of engineers, you can have a much more efficient well-oiled machine doing their little bits.
With microservices, we optimize for independent teams. Each team can become their own dream team and moving very quickly in the same direction and the cost of communication is quite low. This empowers single teams to move very quickly, but that’s only one team. What happens when these teams need to work together? Data requirements very rarely ever live on just one system. You need to push and pull data between them. How do we do that today?
There are a number of ways, but a very common way is REST. I’m not here to bash REST, REST has gotten us a very long way and has a lot of good things about it. File uploads, for example, do that with REST, GraphQL is still hard. The main issue I still have with REST is I feel like it’s easy to make mistakes with REST. Let’s say the resource of person, is the plural of this person, is it people, is it persons? I’m sure the spec talks about exactly what to do, but would you know what to do or would your teammate know what to do when they go make this endpoint? What about versioning?
Great, you want to make a breaking change, you slide everything under a V2, make your new code, you deploy that new resource that you’ve added, that you’ve changed. Do you bump all the existing ones to V2, or do you now have a V2 and a V1 and all your clients even know which one to hit? I feel like you’ve added a complicated system to a complicated system. I’m sure the spec talks about what’s the best way to do this but it’s been done differently at every company I’ve ever worked at.
The mesh is back, except it’s not with people, it’s with many systems, and that’s much more challenging over the internet. Each new client, each new resource has to be created manually with all of its nuances. A client needs to know which API do I talk to, what are the auth requirements or what are the API versions? It just becomes a very complicated system which is a costly thing.
GraphQL Allows for Optimizing for Organizations
I believe GraphQL also goes a step further beyond REST and it helps an entire organization of teams communicate in a much more efficient way. It really does change the paradigm of how we build systems and interact with other teams, and that’s where the power truly lies. Instead of the back end dictating, “Here are the APIs you receive and here’s the shape in the format you’re going to get,” they express what’s possible to access. The clients have all the power between pulling in the data just what they need. The schema is the API contract between all teams and it’s a living evolving source of truth for your organization. Gone are the days of people throwing code over the wall thing like, “Good luck, it’s done.” Instead, GraphQL promotes more of a uniform working experience amongst front end and back end, and I would go further to say even product and designer could have been involved in this process as well to understand the business domain that you’re all working within.
The schema itself can be co-developed amongst anyone because it’s just an SDL or a Schema Definition Language that has an implementation detail, it’s just some syntax that describes where are the entities in your domain. I’m pretty sure most people could write these if they’re familiar with their domain apps. No more making funky APIs to meet your graphic needs of your UI constraints, and no more back ends giving you, “Here’s what you have to use because it works for us.”
Instead, you build a schema that’s a representation of your business, and I would argue that schemas are a superset of all use cases because once you have this system defined in a very neat way, many teams can build against that without having to change much. Instead of exposing database tables over in API, which I feel often is done in REST, instead, you can build a product focus schema that really reflects your business and what is possible to do within this domain. I think that is what really powers the clients to build amazing UIs and prototype very quickly, whether that’s on an Android device or an iOS device. They can all leverage the same system that is product-focused.
Have you ever been in a meeting where people are talking about slightly different things, users, guests, admins, you’re all trying to figure out what you all mean and then you go back to your editor once you’ve all aligned on what you’ve got to go build, and you’ve converted into another word? I think it’s a very common within most coding organizations because coding is just challenging. People don’t have a ubiquitous language to define what their system actually is and what it does, but I believe GraphQL promotes that by nature of having one schema that reflects your app entities, so if you’re all discussing the same words meaning the same things, whether you use GraphQL or not I think having that ubiquitous language is generally a good thing to do in the business, but if technology can drive that as a way of implementing it, that’s only going to bring amazing results.
If you have this product schema, you have your designers, your PMs, your other engineers on board, it’s going to change. I complained earlier about REST end versioning, I feel like it’s a lot easier to do this with GraphQL because you never delete anything, you just always go forward. I’m just kidding, you can delete things but it’s much more of an evolution so you keep adding fields, you deprecate old fields, you do some analytics, you say, “Look, no one’s using that old field. It’s now safe to remove that thing.”
There are amazing tools like Apollo Engine and I’m sure there will be many others that come out, that do auditing and client detection of what’s actually being used, what’s low. You can see your graph for what it is and just move forward, change the shape of the message, deprecate the old things. It’s a rolling forward development cycle, as opposed to breaking changes, big bang, V2.
One of the biggest fears I see when people are faced with GraphQL is they have to rewrite the world. You’ve already built your castle, you have your amazing infrastructure, you have all these microservices, but in reality, none of that has to change. You can leverage your existing tools and platforms and just enhance it with the GraphQL. You don’t have to rewrite the whole world.
What this means for back end engineers is amazing, they can keep operating in their same development cycle, they can have their high SLAs, they can care about their gRPC endpoints that they maintain and just wrap that with a GraphQL schema. If you have an old API that no one knows how it works? Ok, treat it as such, make it a black box. Expose the endpoints that you need to interact with it over a GraphQL endpoint. You can continue to optimize what team is best at, while enabling everyone to move quickly and iterate on the UX of their product, or even allow other back end engineers consume this graph if that serves their needs.
You have this product schema, things are moving quickly and you can evolve ever requiring changes that come up. What happens if you have a few of these entity graphs? I’ve been talking in the context of one entity graph. There are amazing tools, like Apollo Federation that’s coming out really soon, which is a way to deploy an API gateway that can emerge all of these entities into one graph. It’s really interesting, some people have gone this far, automating this entire process with custom tools, but all of those opensource work is coming out to be available to everyone. What would this look like in practice?
For my amazing graph I prepared earlier as well, these teal boxes are the microservices for users, products, accounts, and reports. Each of these can have their domain entity graphs, their small dream teams working really quickly, moving very fast, and they define their own schema. They can push this up into a schema registry. This is a more specific implementation detail, but basically you want to merge these entity graphs into a way that you can track changes and update and automatically code-gen effectively this federated graph, which is one graph of all of the entities, that then any of the clients can consume and then drive their products forward.
As a consumer of your PS4 or your iPhone, you don’t have to care. You say, “Here’s one graph of all of my apps,” business domains, context entities, how they work. I go there, I get my information, I can build my systems, and as a microservice provider you say, “Here’s a graph that I own. Here’s entities within them, and here’s the schema of that.” Then, merge them together.
Let’s build our distributed monolith. We’ll have a single graph, a single API team developing rapidly, all speaking the same language, moving quickly, and understanding the actual needs of the business. This will empower many teams to move very quickly. I think GraphQL promotes a new type of service. It’s a higher-order service. It’s like a giant map function in the cloud. Countless clients can develop against it and build whatever workflow or tool they need to make an impact within their business. As I mentioned, my team over the last year has been building this single entity graph.
Having this graph has really changed the way that we think about the information within our system. As I mentioned, we have many downstream services and historically it’s been, “This is the data we can get from here. Here’s the data we can get from there,” and it’s been very siloed of how we actually implement systems. Going to this graph model, it doesn’t really matter; we just say, “Here’s the information. What do we need to solve for the user to build our products?”
We can really dig into the complexities of not where the data’s stored, but what do we provide to people that need our tools? This scale’s not even within our team. Sure, we build the graph and how it works, but other teams can go to our graph through a graphical tool and explore our schema and understand all of the data entities within our system, without even reading any of our documentation, without talking to us about it, meeting or handover. They can just fetch the data very trivially within our system so it’s an optimization there as well.
It’s a new way to answer questions that previously have been impossible to answer. We see things as a unified model, but the thing is, this is just the start for us, the prize is bigger. Once you’re able to answer these questions and you have this entity in how they relate to things, you can really start to change how you develop systems because you no longer need to care about persistence or things like this. Sure, those things do come up in terms of performance or, we’d have to write things like this, but those are implementation details I feel like the graph schema allows you to change the way they think. The problem is once you have one entity, you really need them all, because like I mentioned earlier with REST, one system really only has one entity within it. They need to push data between them. Things naturally relate to each other and they often live within different systems.
To have a full graph of entities, you want to traverse these relationships and understand them in a much bigger scale. Luckily for us, other teams have wanted to contribute to this system. People are excited to talk about what should it be named, what is the proper meaning of this field, how do we change this moving forward, how do we migrate and also to this model and it’s spreading. Over the last year we’ve had many dozens of apps, but they’re single entity graphs and we want to put them together so people are really excited to work on this initiative.
Over the last year, we’ve been doing exactly that. We have a team dedicated to building a multi-entity graph which is a holistic view of all our content engineering, entities, domains, and operations we can do on them. They’ve been pulling them into this federated graph and it’s a pretty challenging effort. Each team operates independently, they have their own release cycles, their own product managers, their own needs. It’s not coming for free, but the trick is we’ve been using GraphQL for a while at Netflix – not really GraphQL but there’s a thing called Falcor and we’ve been using that for quite a while as well. It’s also a graph database or graph API rather.
If you haven’t heard about it, it basically supports netflix.com and it’s the way that we fetch data for the needs of product. It’s very different, but it has a lot of similarities. You define the paths of the field you want to select and that’s only when it’s returned to the client. There’s a lot of caching, duplication reference and normalization. Some of the things are in GraphQL, some of them aren’t, but the thing about it is, we have a lot of experience building Graph APIs to support our products.
We’ve been sharing notes, we can cheat on this test of learning from the people who have been doing it for the last 5 or 10 years. They work right next to us and we’ve recently had a reorganization to move our two organizations to be a part of the same team, so a single platform team is not going to be maintaining the graphs for both product and for our content engineering space to allow us to move very quickly and learn from all those experts that have been doing this for quite a while. I’m very interested to see where this goes in the next six to nine months, I’m excited.
Challenges
With GraphQL there are still some challenges that we’re trying to face. One of the learnings I wish we had done was talk to the Falcor people much earlier but we’re there now so that’s ok. There are a few things that we still need to figure out. Schema management is a very challenging topic. I’ve alluded to that it’s great if you can align and move in the same direction, but there are many ways to solve this problem and I really do think that it depends on your organization and the size of your team to do this well, but I’ll just go over some of the challenges or ways that you might be able to do this within your teams.
Do you define the schema to reflect your UI’s, or do you define it to reflect your products? As I mentioned before, there are users, products, payments, and reports. Do you take those exact entities, put it into a graph, and expose that to your UI’s directly, or instead do you say what do the UI’s need exactly, like a gallery or a discount section and find the products use cases and the UI in the schema to be easier to consume. There are pros and cons definitely to both approaches, so that’s something you’ll need to figure out what makes sense for you.
Then, who owns the schema? Do you have a single team that mandates which changes can be allowed in? Do they say, “No, that doesn’t fit our use case,” or, “We’re actually going to hold off on that until more teams need it.”? This can work very well if your organization is small or very large either way, but it’s definitely something that is to be considered. Another approach is do you instead have informed captain? Informed captains is a thing we use at Netflix to derive or to determine who’s leading an initiative. Potentially per entity you have an informed captain that says, “Here’s a schema for our entity and we’re going to be the source of truth for maintaining that and extending that, so if you want to make a change come talk to us,” is another approach you can take to define your schemas.
Another challenge we’ve also faced is distributed rights. Everyone talks about GraphQL for reading information. That’s only half of the internet, the other half is changing it. How did we solve this? Within our domain we have chosen to only do single entity rights for now, and if we do choose to go down a multi-distributed transaction route, we will have to face very challenging topics at that point, but I believe we can solve this with a new job idea and maybe send a finished payload through a subscription or something like this, we have yet to solve this case but it’s something we have punted on it until later.
Another thing that has been quite challenging to figure out how to do it correctly is actually error handling. In the GraphQL spec, there is an errors part of the response that you get back, but I would argue that that is not what you should use it for, that it’s more like exceptions, things that your server could not handle. Instead, I would encourage people to look at putting your errors into the schema. For example, if you’re loading a user’s page and the user’s not found, that is a known type of state your app can be in, so your schema should effect all possible known states so you might get user payload back or an authorized payload back or user not found payload back, and your schema tells you the information you need. Your UIs’ can be built around that.
There are very clever things you can do around client selection sets that allow us for moving forward, especially on mobile that you don’t break older clients, but it’s an implementation detail. Errors I feel should be in the schema and I’m sure I’ll get questions around that in a moment, but that’s one.
Those are a few of our challenges and we have been working very closely with the product team to figure out what can work for us. On product and streaming to the best of my knowledge, they’ve been using the ivory tower bucket defining the schema. Our core teams are maintaining schema entities and controlling what goes in and what changes, but they’ve encouraged us to try this new approach where each service owner or domain entity owner, what we’re calling domain service entities or whatever, will maintain their own subgraph and that will get merged into the federated graph, so we’re adopting this approach and we’re very interested to see how this plays out.
In regards to do you make the graph UI centric or do you make it entity-centric? We are still evaluating the exact approach to solve here, and I’m on a working group interviewing all of the organization to see what are the exact use cases of each team. What we are evaluating is potentially providing a managed experience to put in front of this federated graph that is a BFF, or a back and forward front end for each UI team, to potentially do their own data transformations, maybe extend their graph to be more product-centric, but we’re still evaluating the needs of the teams before we rush into solving this problem.
The way that we actually do this is through working groups. It’s a very interesting way to solve this problem. Instead of prescribing a solution, we talk to everyone and we say, “What do you actually need? What problems are you facing now and how can we help you?” This has been very successful for us and I think it’s been probably one of the bigger factors of why I think GraphQL succeeded in Netflix. There’s been lots of interest from product as well as our content space in exploring this, but a lot of the learnings that we’ve been having we’ve been sharing amongst the teams. I feel like it’s just driving it forward in a very nice way.
Having this unified graph is really going to allow us to answer questions to product people that we haven’t ever been able to answer before, because it’s been in a siloed system. Once you have this main entity graph or multi-entity graph, it really changes the way that you want to build applications. You don’t have to think about talking to this team to get this extended, join that team to get that extended. Instead, all the data that’s possible in your organization is there and you just build against it. Within my team in particular back to a smaller scope, we want to see how we can start building applications. Is that possible? What would that look like?
We have a localized innovation lab where one or two people per quarter will basically hack on projects and see what we can do. We’ve had some really initiative things come out of this which we hope to opensource, but what if you could write an entire app without any GraphQL? We use TypeScript. What if you could just access the data you want, look at the types, map them to props, map that to your GraphQL query, and then send that to the server without writing any GraphQL? We have a library that does that, whether or not we use that in production or whether or not. Maybe it’s terrible idea but it’s just interesting. What we could go further and have the schemas and have drag and drop GUI’s to make UI’s? It’s possible if it’s all typed. It’s very interesting, so come help us solve these fun problems.
If you have any new crazy ideas on how we can build new apps or make studio better for the world, please come speak to me, we’re always hiring. I’ll leave you with one final thought. I think GraphQL is amazing, not necessarily for the technology or the tools that are on it, like Apollo and whatever else. GraphQL wins my heart because I think it creates human behavior. It starts teams talking to each other on how they can evolve and enhance the schema, it’s a typed living source of truth of what the API taxonomy is for your entire organization, and it moves us back to the monolithic dream team. Each team can be independent and moving quickly, and your monolithic API allows your entire organization to be represented in one place. Together, we can do what we do best, all while bringing everyone together.
Questions and Answers
Participant 1: I have a question about performance and trade limits. For example, when you manipulate REST API, you can say that “Ok, movies are quite fast and not time-consuming, but movies/IDs/reviews are a very heavy request and you can’t send more than 100. For GraphQL we have queries and one endpoint. Did you encounter everything and if yes, how’d you try to solve this problem?
Heinlen: There are many questions in there. I’ll try to answer all of them. If you want to do rate limiting and complex analysis of the actual GraphQL query, you can definitely do this and you can basically be a for-filter. As part of the validation of the actual schema, you can say, “If the complexity of this query is too deep or has too many field selections, reject their query altogether.” You can go further to say, “Here are all the client’s queries that we know about and we’re going to basically whitelist them and everything else is blacklisted,” so you know exactly which query they’re going to run to production and optimize them. In terms of knowing what’s being used and knowing the speed of these things, there are amazing tools like Apollo Engine, but you also build internal tools.
In all opensource libraries there’s a spec that gives you timings per field per resolver, to understand the app, basically. I would encourage you to read Principled GraphQL. It’s a one page doc that talks about how to build these things in production, and part of that is basically optimize when you have a problem, because it’s an end-to-end super complicated problem to know what is every possible combination of queries that I’m going to be receiving. I feel like, solve your known use cases, whitelist your queries, persist your queries if you need to do this in production especially, and then tweak your performance from there.
Yes, you can block the request if it’s too complicated, if it has too many fields. You can do detection and timings, opensource tools like Apollo Engine or request pipeline, and stuff like this. I would say optimize when you have a problem. Those are my suggestions.
Participant 2: I have an additional question to the previous one. We have some federated graph with our entities and, for example, we query film review and user entity. What about concurrency and parallelism? Do you use it in Netflix and how?
Heinlen: We have yet to tackle this problem but it’s coming in soon with the work of the federated graph. The new tooling from Apollo, Apollo Federation, is going to be opensource or it’s opensource as of two weeks ago. It’s very complicated. I would recommend that you go read their docs around how they implemented this, but the way they do this is they have a SQL planner but for GraphQL Planner. They’re able to detect, “This is the first ID we must have, we have that ID now, we can make all these in parallel, and then we can go make this last request once we have the sequential ID from the previous request.” They’re trying to optimize chaining the operations which you must do in which order, and that is going to be open-sourced. I think there’s also a paid thing to do the side of that, I suppose.
We’re evaluating using that. We’re building something similar internally, but that’s where the infrastructure team is now dedicated to solving in the coming months, but it is possible, it’s just not trivial. If you need it you build it, if not you’ll buy it, I suppose would be my tooling, but we’re not there yet for the actual solution. I would recommend looking at Apollo Federation, at least how they’ve gone about solving the problem, and maybe you can build something similar in your team. Another thing I mentioned in terms of performance is, you can do data loading which is a very common way to also speed up apps, so you can cache the request, you can memorize a request.
For example, if your query is user, comments, user, you wouldn’t naturally request user one twice. You can memorize it, basically, so if you’ve already fetched that data per request, you’ll get back the same entity and memory as opposed to hitting the API twice, or you can also data load multiple IDs at once so you might have a recursive structure that’s, “Get the vendors. Get the vendors.” You might make 100 requests to that service, you can as I said, batch up the ideas, make one request and it’ll merge it back in the graph. There are lots of strategies to try to optimize and make this more performance heavy, but I feel like that’s implementation and I wanted to get, “Here are the nice things about GraphQL.”
Participant 3: In terms of GraphQL, what do you guys use to resolve latency problems when you are using GraphQL to reach out to different sources when they pull back information?
Heinlen: Do you mean if part of the request has failed, or in general?
Participant 3: Yes, if part of the request fails.
Heinlen: I didn’t get into the specifics, but there’s a really good talk by this woman. She used to work at Medium but now she’s at Twitter, that talks about error handling. I would put that into the schema, if something can fail and you know it can fail, it depends on the type of issue it is. For example, an unauthorized system, that’s a different type of error than an intermittent this thing if you retry it it’ll be fine, but we design our systems and our schema. Everything can be nullable, and the UI can handle something being null, and if there’s actually business rules that say, “This can never not be blank,” then sure, make that a required field and throw up your exception in your server.
In terms of intermittent failures, you could do retry logic in the resolver. We’d do that in some scenarios, or we try a couple of times before we actually bailout of the resolver, but we don’t have a uniformed, “This is the best way to solve this problem generically,” but I feel like it really depends on your type of error and if you can retry, go for it. If it’s something that can be null, let it be null in the schema, or if it’s like an actual “That’s going to cause a business logic error,” then put that error into the schema that you can reflect better to your users as what’s actually gone wrong.
Participant 4: How do you resolve the situation when you have multiple teams using essentially the same business entity, but they have, let’s say, a different view of the entity, that they won’t use different data? I suppose you do not want to load the entity with all the fields, etc.
Heinlen: Yes, most definitely. This is obviously going to be challenging but user, for example, I would imagine most people are going to have a user entity in their system and they may have different fields or different representations of that. With this Federation thing from Apollo and the opensource thing, basically each subgraph extends the basic type and only one team will actually own the main type. If there’s any merge resolution conflicts, you’ll get that in editor with amazing tooling. You can get query timing, you can get per field level timing. This has an ID, how about a string? That’s invalid.
I mentioned in my second diagram of the schema registry and that’s where it comes into place. Each team locally and in production every environment builds against this schema registry and as a part of your deployments, it basically validates that yes, this won’t break any clients. Yes, this marriages all the other entities fairly well, and if it doesn’t, it’ll get a build error or a PR error and you can go further to dig into this. To summarize, each team can extend these user types that are shared or entity types that are shared and as a part of your validation deployment step with the help of a schema registry, you can actually validate and check that that’s not going to break the bigger system.
Participant 5: I was wondering if you could elaborate a little bit on how you guys numerated business logic errors, specifically around the implementation. Are they first-class types or are they fields on a certain type?
Heinlen: This is an ever-evolving topic and there’s the GraphQL Paris conference that happened last week, and there’s a talk explicitly on this, look up GraphQL Paris Errors and you’ll find her talk. She’s amazing, she used to work at Medium, now she works at Twitter. You define a union type, instead of you say, “I want users one,” as your query and you get a user object back, what happens if that user didn’t come back? Maybe there’s not a user one in your system.
Instead, your queries return type would be a user payload or 404 or unauthorized and those are other types and then they may have specific fields of the errors or the validation rules or whatever message you wanted to use to just play that in their UI. Then as a client developer, for example, if you use Apollo, a query component, you switch on the data and you do a union and you say, “If it’s this type, render this component. If it’s this type, render this component.”
You can actually have better-represented errors through users as opposed to a big banner on the top being, “Uh-oh.” You can redirect them back to the flow you want them to go through if you know exactly what broke, as opposed to digging into the data.errors array and there are 100 field selections in there. If you can co-locate your data request in your errors, you’re going to have a much better time as a UI developer and you can actually reason about why things break, as opposed to you as a consumer having to figure out why something might have broken.
Participant 6: As your teams are growing and you’re moving into this federated graph, how do you deal with breaking changes that may be introduced from other teams, changing types even in small ways? Is there some system that you handle that you use in CI that gives you some log file for type changes?
Heinlen: We are currently using Apollo Engine which is in production. Every request, all the timing and query information will go to their system and it gets logged. Even development time in your editor you can have your little GraphQL tag in your editor and it’ll give you timings, “This field costs this much time,” and it uses production data to give you that field by field, but as well as, locally you can do Apollo check or put this into CIG against Java or whatever you’re using for CI, to basically say, “Here’s the schema that we’re going to publish. Does that meet all of our client’s specifications and does that match against production, traffic, over the last couple of months? Not only does the type match, but does it match production usage of this?”
It doesn’t get into the rules of, “Is this correct for your business?” I feel like that’s where PR’s would come in but at least the timing and the usage of that graph could be checked with this tooling. That’s where the registry comes into play as well; you wouldn’t be able to actually publish a schema if it broke your known client’s usage of this. In terms of how we do the version changes, again, I’m still mentioning this because it’s being developed actively at the moment, but I would roll forward with new fields, new messages, and new queries if you’re going to make breaking changes in almost all scenarios if it’s possible.
Participant 7: If you could elaborate on your investigation from a tech stack point of view, why you would choose GraphQL over another query language, say, OData?
Heinlen: I can’t speak to that because I do not know the other one. Sorry about this, but I have only had a nice experience with GraphQL as of yet. It allows your UIs to move very quickly. I feel like that is a huge advantage as opposed to not using GraphQL. I think it’s client-centric, but that’s not to say that you can’t use it from server to server, but if you are to do this, there’s gRPC, there are other nice tooling that have two-way data streaming and stuff like this, but I would think it’s optimized for clients especially, and it’s made by Facebook and it’s all the rage. Maybe there is some hype to it, but I’ve only had good experiences with it so far, but I can’t speak to the other one.
Participant 8: Regarding the teams, is there a methodology that you are using in the communication of the teams, so you can communicate with the teams through this tool or this methodology?
Heinlen: Do you mean in terms of the schema design?
Participant: Yes.
Heinlen: We do have these working groups where we talk more generally around, “Should we do the relay for pagination, should we do this for errors?” We have this forum to discuss these things more publicly, but now with this new reorganization of both product and content engineering merging, we do have a dedicated team to be building out these federated entity graphs and they’re kind of making these decisions at the moment.
The ultimate goal is, these per teams will maintain their own graphs themselves. Yes, that’s something to consider, how we can enable these teams to elaborate more effectively, especially if they’re dealing with multiple entities across multiple domains, extending them and not conflicting with this. I feel like as soon as you go to this distributed model, you do need tooling and communication to do this well, so that’s something to be mindful of, but I don’t have a clear answer for the best way.
Participant 9: My question is, how do you determine when a graph is needed? Do you build a graph for every feature of your product? Particularly what I’m interested in is as your product becomes larger, how do you prevent a proliferation of all of these graphs, where there’s some type of duplication of effort in places, in bits of your product?
Heinlen: That’s definitely a fair concern. As of yet, our teams and many teams have been using this are 100% on the GraphQL interface for dealing with the back ends, but I can imagine a world where if you’re doing CQRS or you’re doing file uploads or something that doesn’t fit that paradigm, or doing streaming, you could do subscriptions, but that’s less use as of yet. You might want to go out of that scope, but as for us, we find we have no need to not use the graph for all of our use cases so far.
In terms of bloat and over time getting too big, I feel that’s just a matter of versioning and deprecating fields if you really want to remove them. In terms of adding new things, I think that’s more of an organizational problem to try to solve; do you really need five user systems or can it all be within one? I don’t know, we haven’t gotten to that stage of that maturity for us to have a good answer for that. I do not know.
Participant 10: My question’s just about coupling. I think it’s been covered by a few questions already, but I’m just curious about your long-term deprecation strategies. For instance, with your federated graphs, to stop this bloat that people have mentioned and having these older entities hang around for 5, 10 years because some other teams may be using it, do you have maybe a more aggressive deprecation strategy that you’ve been talking about internally?
Heinlen: At Netflix, we don’t tell anyone what to do. Everyone has the freedom and responsibility to do what they want to do, and the judgment comes into that. What things should we be focusing on, what things should we do, but to the best of my knowledge, I could be wrong, don’t quote me on this, but I believe Facebook has never deprecated a single API they’ve ever made and they’re doing fine. I don’t know around getting rid of old things. I’m sure there are good strategies for that.
If you control all of your clients, you can just say you get to upgrade in the next quarter or something, and we’re going to turn old one off. Great, if you have that luxury, I think that’s fine. We don’t control every single client that uses our app, we can’t tell people what to do, so it’s just a matter of being, “Please move to the new ones, you get new features.” Convince them with the new shiny maybe? I don’t know. We have yet to run into this problem and I’d really be curious if it actually becomes one, personally.
Participant 11: I haven’t really used GraphQL myself but I read a good amount of literature about it. I’m concerned about one thing. From what I understand, for each query you still need to write a resolver, which is the way I see it from outside, is more like writing an API, a REST API, REST endpoint so you still need to implement the resolver for it. Do you see the advantage of GraphQL in the power of expressing queries in a way which I don’t understand yet, or do you see it more in the fact that because you have that uber taxonomy you can make those queries more powerful? The simple fact that you have taxonomy gives the entire organization a common understanding and allows those queries. Do you it more in the intrinsic query power, or more in the advantages that taxonomy gives you?
Heinlen: I think both, personally. As a UI engineer, you can go to this graph. I should have shown an example but it’s not a very specific talk, but as a consumer, you can just go CMD+TAB and see all the people queries that are available. You go into there, CMD+TAB what fields are available, what the description and the type, and you just keep digging down as a UI engineer and you’re, “, I want this and this,” and that’s the only data you get back. It’s very nice as a UI engineer. You don’t have to worry about, “I get this from this REST endpoint. Ok, in that big JSON body I get an ID, I go somewhere else, get some more, and maybe an included batch.”
I feel like it definitely helps the consumer of the API get just what they need when they need it, and I feel like the taxonomy, the documentation of your entire system, is also very appealing. To speak to the REST resolver implementation comparison, it’s just a transport layer way to define how to get data. It’s the boundary of your system, so you’ve still got to implement it, I think, at some level, but the bigger benefit is for the clients, I would imagine.
See more presentations with transcripts
MMS • RSS
Article originally posted on InfoQ. Visit InfoQ
Mark Christian and Johnny Rodgers recently discussed on the Slack Engineering blog how Slack successfully rebuilt the desktop version of Slack. The article quotes an incremental rewrite and release strategy as a key success factor.
Two decades ago, quoting Netscape’s misadventures, Joel Spolsky, co-founder of Stack Overflow, posited in his landmark essay Things You Should Never Do that rewriting code from scratch is the single worst strategic mistake any software company can make. Spolsky mentioned two issues with rewrites. First, the existing codebase often embed hard-earned knowledge about corner cases and weird bugs, knowledge which may be lost in the rewrite. Second, rewrites can be lengthy and divert resources which could be used for improving the existing codebase and products, and can result in the product being displaced by its competitors. Refactoring legacy code — rather than rewriting it, seems, for some opponents of rewrites, a less risky option.
Conversely, there are arguments in favor of complete rewrites. The conventional wisdom reflected in “If it ain’t broke, don’t fix it” also means that, in case of software which can no longer be evolved at a satisfying cost, a rewrite may be justified. This may happen when maintaining and adding features to the legacy codebase is prohibitively expensive, or former technological choices cannot support the new use cases. Rewrite proponents may support taking advantage of the new effort to build a new application entirely. Alternatively, they may instead prefer replicating the existing application features without adding new ones, to lessen the project risk.
The Slack team credits the success of their rewrite of the Slack desktop application to having adopted a middle-ground, incremental, rewrite strategy. Code was not rewrote from scratch and released in one go. The legacy code and new code coexisted for the duration of the rewrite project, with the new code progressively replacing the old code.
The Slack strategy involved the definition of a target architecture, and interoperability rules which kept the old and new code separate, while allowing targeted reuse between old and new code:
(…) We introduced a few rules and functions in a concept called legacy-interop:
- old code cannot directly import new code: only new code that has been “exported” for use by the old code is available
- new code cannot directly import old code: only old code that has been “adapted” for use by modern code is available.
The classic version of Slack (loading the new code and the old code) would coexist with the modern version (which only included the new code) till the moment when the modern version would reach feature-parity with the classic version:
(…) [That way] legacy code could access new code as it got modernized, and new code could access old code until it got modernized.
The incremental rewrite strategy was associated with an incremental release strategy. The article explains:
The first “modern” piece of the Slack app was our emoji picker, which we released more than two years ago — followed thereafter by the channel sidebar, message pane, and dozens of other features. (…) Releasing incrementally allowed us Releasing incrementally allowed us to (…) de-risk the release of the new client by minimizing how much completely new code was being used by our customers for the first time.
After using the modern-only version of the app internally for much of the last year, the Slack team is now ready to release the new modern desktop application to customers.
The old version of the desktop application featured a stack including jQuery, Signals, and direct DOM manipulation on Electron. It also exhibited a memory consumption increasing rapidly with the number of workspaces and lower performance for large workspaces due to eager data loading. The modern version is built on React and shows a near-constant memory consumption with respect to the number of workspaces. The modern version additionally loads data lazily and presents a better performance profile.
MMS • RSS
Article originally posted on Data Science Central. Visit Data Science Central
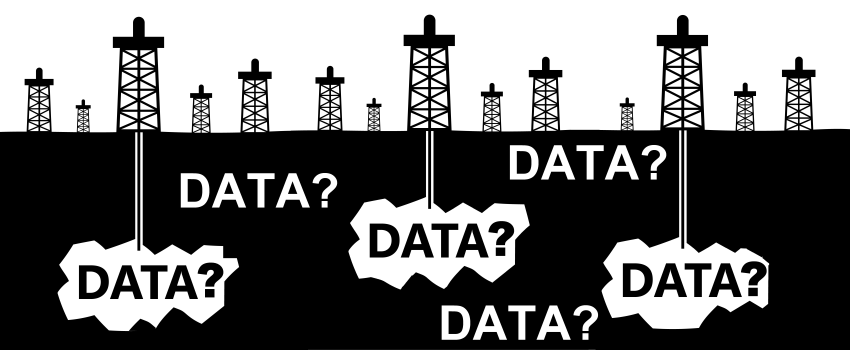
Note: This blog was written by Dr. William Goodrum and originally posted on www.elderresearch.com.
____________________________
It has become common to talk about data being the new oil. But a recent piece from WIRED magazine points out problems with this analogy. Primarily, you must extract oil for it to be valuable and that is the hard part. Framing data as oil is not illuminating for executives trying to value their data assets. Oil is valuable, marketable, and tradable. Without significant effort, data is not. Data has more in common with land that may contain oil deposits than it does with oil.
Framing data as a real asset may help executives understand its value.
Why Data Is Not Oil
Some high-profile publications recently emphasized the lucrative potential of data. For example, the New York Times highlighted how revisions to Facebook’s privacy wall caused an explosion of third-party data sharing, and referred to it as “the most valuable commodity of the digital age.” The Economist called data “the most valuable resource in the world,” surpassing “black gold” and other commodities in terms of its revenue potential.
In WIRED, Antonio Garcia Martinez critiques the oil analogy from an economic perspective, especially the proposed “data dividend” schemes that attempt to remunerate consumers for the use of their data. The article is well-written and clarifies the economics of data.
But Garcia Martinez does not go far enough and provide an alternative analogy. Not all assets are fungible or tradable, but all assets have value. So, if data is not a fungible, marketable good, then what is it?
Data As A Real Asset
A better analogy is to think of data as a real asset; in other words, land. Martinez misses on this in his Amazon data example. He argues that receiving hard drives with the complete set of Amazon customer data is worthless because it references only Amazon customers and therefore is only valuable to Amazon. He is wrong to argue that this data cannot be sold to others on its own. The data are not worthless, one would just have to work hard to make good use of them.
Data are an asset, but merely having them does not reveal their value; it must be developed to maximize its value. The value of data is not what someone else will pay for it, it is in how you can use it.
Assess Data Value In Context
In real estate the three most important factors impacting property value are location, location, and location. Selling someone a house in the mountains does not make sense if they want to be near the beach. Creating a subdivision downwind of a paper mill is a bad idea unless land is so scarce that getting a home anywhere is still desirable (regardless of the smell). The primary factor for determining property value is location: is it close to something or somewhere that people care about so much that they will pay for that proximity?
Similarly, valuation of data assets must assess how close they are to a company’s strategy and goals. Data delivers value only when it is used to solve problems or answer important questions. In his book,Infonomics, Laney measures the performance value of a data asset from the relative change in a Key Performance Indicator (KPI) over time. In this way, the “location” of the data relative to business value can be tangibly assessed. That is, if the KPI is well-defined, its change in value while the data asset was established and maintained is the contribution of that data asset.
To Martinez’ point, Amazon data is primarily valuable in the Amazon business context. For example, data on past purchases can be used to recommend future purchases. But other secondary contexts exist where that same data could provide value. Consider predicting relocation based on Amazon search history for items related to moving. Or using the data to predict the efficacy of cross-promotion into new markets. If your goal is to acquire new customers, collecting additional data on existing customers is not likely to help. Or, if you are interested in modeling the churn of your existing customers, introducing aggregated data on new customers is not likely to help. Just like in real estate, proximity is key; here, of third-party data to your business problem.
Data Development — build, baby, build
Anyone who has bought or sold real estate knows that the value of the land changes dramatically when you make substantial improvements – e.g., you build a house on it. Developers stake their businesses on being able to upgrade valuable spaces, whether that is retail, commercial, or mixed use. Land is worth more when improvements are made to it.
Land is what economists call a rival good: only one person, entity, or corporation may possess and make use of it at any time. Also, once land has been improved, it cannot be used for something else without destroying its previously envisioned purpose. As a recent article by Jones and Tonetti illustrates, data is a non-rival good: more than one person or entity can develop it in completely different ways, deriving value for their context without eroding the value available to another party. For example, if you want to understand your customer’s behavior your Data Scientists could develop applications related to:
- Likelihood to purchase
- Recommendations of like items
- Detection of fraudulent transactions
While the raw data for all of these applications will likely be identical or very similar, the specific datasets going into each model will be different due to feature engineering and derivation. For this reason, it is important for companies to have a cohesive data strategy. Clear governance, with strategic intent to retain important raw data, can have value implications across many arms of a business. Because data is non-rival, it may in fact be even more valuable than the real assets that your company holds!
The hype around data, Data Science, Machine Learning, and AI — in addition to the stratospheric valuation of big tech companies like Google, Facebook, and Amazon — make a case for the “data is like oil” analogy. Still, the analogy is fundamentally flawed. Thinking about data as oil does not help CDOs, CAOs, or CEOs to properly value their core data assets, since it relies on estimating the market value of their data to others. It also assumes that the value available in data has already been painstakingly extracted. A better, though still imperfect analogy is treating data like land; that emphasizes that the data must be developed for it to be useful and valuable. Thinking of data as a real asset can guide the formation of a cohesive data strategy that can deliver real value in support of business goals.
There might be oil in those hills, but you’ll have to buy the land and work it if you want to reap the rewards.
MMS • RSS
Article originally posted on Data Science Central. Visit Data Science Central

Note: This blog was written by Dr. John Elder and was originally published on www.elderresearch.com/blog.
______________________________
Elder Research has solved many challenging and previously unsolved technical problems in a wide variety of fields for Government, Commercial and Investment clients, including fraud prevention, insider threat discovery, image recognition, text mining, and oil and gas discovery. But our team got its start with a hedge fund breakthrough (as described briefly in a couple of books1,2), and has remained active in that work, continuing to invent the underlying science necessary to address what is likely the hardest problem of all: accurately anticipating the enormous “ensemble model” of the markets.
It is extremely challenging to extract lasting and actionable patterns from highly volatile and noisy market signals. In theory, timing the market is impossible – and in practice that is a good first approximation. However, small but significant advances we made over the past two decades in three contributing areas, briefly described here, have combined to lead to breakthrough live market timing strategies with high Sharpe ratios and low market exposure.
1. Luck, Skill Or Torture? How To Tell
Because of the power of modern analytic techniques, it is often possible to find apparent (but untrue) predictive correlations in the market due to over-fit—where the complexity of a model overwhelms the data or, even more dangerously, from over-search—where so many possible relationships are examined that one is found to work by chance. Wrestling with this serious problem over many years in many fields of applications, I refined a powerful resampling method, which I called Target Shuffling, to measure the probability that an experimental finding could have occurred by chance. It is far more accurate than t-tests and other formulaic statistical methods that don’t take into account the vast search performed by modern inductive modeling algorithms. With this tool, one can much more accurately measure the “edge” (or lack thereof) of a proposed investment strategy (or any other model).
Years earlier, to more accurately measure the quality of market timing, or style-switching strategies, I defined a criterion I called DAPY, for “Days Ahead Per Year”. It measures, in days of average-sized returns, the expected excess return for a timing strategy compared to a benchmark similarly exposed to the market. The Sharpe ratio can be thought of as measuring the quality of a strategy’s returns; whereas DAPY measures its timing edge. Together, they are much more useful than Sharpe alone. Most importantly, Elder Research studies have shown DAPY to be better than Sharpe at predicting future performance.
2. Global Optimization (combined with Simulation and sometimes Complexity Regularization)
Even the most modern data science tools most often attempt to minimize squared error, due to its optimization convenience, when forecasting or classifying. But that metric is not well-suited for obtaining market decisions, as the user’s criteria of merit has much more to do with return, drawdown, volatility, exposure, etc., than with strict forecast accuracy. (If one gets the direction right, for instance, it is not bad to be wrong on magnitude, much less its square.) What we need are optimization metrics that reflect our true interests, as well as an algorithm that can find the best values in a noisy, multi-modal, multi-dimensional space.
 Early years of my career working with the markets were marked by continual failure, even after strong success in aerospace and a couple of other difficult fields. I became convinced of the need for a quality search algorithm in order to allow the design of custom score functions (model metrics). I returned to graduate school and made this the focus of my PhD research. I created a global optimization algorithm GROPE (Global Rd Optimization when Probes are Expensive) which finds the global optimum value (within bounds) for the parameters of a strategy, using as few probes (experiments) as possible. By that criterion, it was for many years (and may still be) the world champion optimization algorithm. (Note in Figure here how it represents a nonlinear 2-dimensional surface as a set of interconnected triangular planes.)
In Elder Research’s investment models the global optimization often works in a second stage after a smallish set (i.e., dozens) of useful inputs have been identified – in a quantitative and not qualitative manner – from thousands of candidate inputs. The winnowing is accomplished in a first stage through regularized model fitting, such as Lasso Regression, to filter out useless variables while allowing unexpected combinations to surface.
3. Ensemble Models
Ensemble methods have been called “the most influential development in Data Mining and Machine Learning in the past decade.” They combine multiple models into one often more accurate than the best of its components. Ensembles have provided a critical boost to industrial challenges—from investment timing to drug discovery, and fraud detection to recommendation systems—where predictive accuracy is more vital than model interpretability. In 2010 I had the privilege of co-authoring book on Ensembles with Dr. Giovanni Seni, about a decade and a half after I’d been one of the early discoverers and promoters of the idea. The investment system we use, as well as many of our models for other fields, employ an ensemble of separately-trained models to improve accuracy and robustness.
Even with these breakthrough technologies, most of the investment models we attempt do not work. The general problem is so hard that our attempts to find repeatable patterns that work out of sample fall apart at some stage of implementation – fortunately before client money is involved! Yet, we have had a couple of strong successes, including a system that worked for over a decade with hundreds of millions of dollars and for which every investor came out ahead. The Target Shuffling method not only convinced the main investor at the beginning that it was significant (a real pocket of inefficiency) but it provided an early warning when its edge was disappearing and when it was time to shut it down. Together, these three technology breakthroughs made the impossible occasionally possible.
1 See Chapter 1 of Dr. Eric Siegel’s best-selling book, Predictive Analytics: The Power to Predict Who Will Click, Buy, Lie, or Die
2 An excerpt from the book Journeys to Data Mining; Experiences from 15 Renowned Researchers briefly recounts the start: “The stock market project turned out, against all predictions of investment theory, to be very successful. We had stumbled across a persistent pricing inefficiency in a corner of the market. A slight pattern emerged from the overwhelming noise which, when followed fearlessly, led to roughly a decade of positive returns that were better than the market and had only two-thirds of its standard deviation—a home run as measured by risk-adjusted return. My slender share of the profits provided enough income to let me launch Elder Research in 1995 when my Rice fellowship ended, and I returned to Charlottesville for good. Elder Research was one of the first data mining consulting firms…”
MMS • RSS
Article originally posted on Data Science Central. Visit Data Science Central
I enjoy data prep munging for analyses with computational platforms such as R, Python-Pandas, Julia, Apache Spark, and even relational databases. The wrangling cycle provides the opportunity to get a feel for and preliminarily explore data that are to be later analyzed/modeled.
A critical task I prefer handling in computation over database is data loading. This is because databases generally demand the table be created before records are inserted, while computational platforms can create/load data structures simultaneously, inferring attribute data types on the fly (these datatypes can also be overridden in load scripts). When data are sourced from files available on the web, the latter can afford a significant work savings. Examples of such web data relevant for me currently are Census and Medicare Provider Utilization and Payment. Each of these has both many records and attributes.
A challenge I recently gave myself was loading a 15.8M record, 286 attribute census data file into PostgreSQL on my notebook. It’s easy to work with the PostgreSQL data loading capability after the table of 286 columns is created, but how to easily formulate the create table statement?
One possibility is to use the database connect features provided by the computational platforms. Both Python-Pandas and R offer PostgreSQL libraries, and each supports copying dataframes directly to PostgreSQL tables. Alas, this option is only resource-feasible for small structures. There are also adjunct libraries such as sqlalchemy and d6tstack available for Python that enhance dataframe to PostgreSQL copy performance, but for “large” data these ultimately disappoint as well.
As I struggled with divining a workable solution, the idea occurred to me to consider the computational copy feature to create the table with a very small subset of the data, then bulk load the data files into the database using efficient PostgreSQL copy commands. Turns out I was able to combine these computational and database load capabilities for a workable solution.
The strategy I adopted is as follows: 1) use Python-Pandas and R-data.table to load a small subset of data into dataframes to determine datatypes; 2) leverage that dataframe/data.table to create a relational database table in PostgreSQL; 3) generate bulk load sql copy commands along with shell scripts based on meta-data and csv files; 4) execute the shell scripts using a variant of a system command to load data with the efficient copy statements.
Up first is Python-Pandas, presented below. A proof of concept only, there’s no exception/error handling in the code. Hopefully, the ideas presented resonate.
The technology used is JupyterLab 0.35.4, Anaconda Python 3.7.3, Pandas 0.24.2, sqlalchemy 1.3.1, psycopg2 2.8.3, and d6tstack 0.1.9.
Read the entire blog here
Researchers Develop Technique for Reducing Deep-Learning Model Sizes for Internet of Things
MMS • RSS
Article originally posted on InfoQ. Visit InfoQ
Researchers from Arm Limited and Princeton University have developed a technique that produces deep-learning computer-vision models for internet-of-things (IoT) hardware systems with as little as 2KB of RAM. By using Bayesian optimization and network pruning, the team is able to reduce the size of image recognition models while still achieve state-of-the-art accuracy.
In a paper published on arXiv in May, the team described Sparse Architecture Search (SpArSe), a technique for finding convolutional neural network (CNN) computer-vision models that can be run on severely resource-constrained microcontroller-unit (MCU) hardware. SpArSe uses multi-objective Bayesian optimization (MOBO) and neural-network pruning to find the best trade-off between model size and accuracy. According to the authors, SpArSe is the only system that has produced CNN models that can be run on hardware with as little as 2KB of RAM. Previous work for MCU-hosted computer-vision uses other machine-learning models, such as nearest neighbor or decision trees. The team compared its CNN results with several of these solutions, showing that SpArSe produces models that are “more accurate and up to 4.35x smaller.”
MCU devices are popular for IoT and other embedded applications because of their low cost and power consumption; yet these qualities come with a trade-off: limited storage and memory. The Arduino Uno, for example, has only 32kB of flash storage and 2kB of RAM. These devices do not have the resources to perform inference using state-of-the-art CNN models; their storage constrains the number of model parameters, and their RAM constrains the number of activations. A relatively small CNN model, such as LeNet, with approximately 60,000 parameters, requires almost double the Uno’s storage, even using compression techniques such as integer quantization. The only solution is to reduce the overall number of weights and activations.
The key to reducing model size with SpArSe is pruning. Similar to dropout, pruning removes neurons from the network. However, instead of randomly turning off neurons during a forward pass in training, pruning permanently removes the neurons from the network. This technique can “reduce the number of parameters up to 280 times on LeNet architectures…with a negligible decrease of accuracy.”
In addition to network pruning, SpArSe searches for a set of hyperparameters, such as number of network layers and convolution filter size, attempting to find the most accurate model that also has a minimal number of parameters and activations. Hyperparameter optimization and architecture search—often described as automated machine learning (AutoML)—are active research areas in deep learning. Facebook also recently released tools for Bayesian optimization techniques similar to those used by SpArSe. In contrast with SpArSe, however, these techniques usually concentrate on simply finding the model with the best accuracy.
The research team compared the results of SpArSe with Bonsai, a computer-vision system based on decision-trees that also produces models that will operate in less than 2KB of RAM. While SpArSe did outperform Bonsai on the MNIST dataset, Bonsai won on the CIFAR-10 dataset. Furthermore, SpArSe required one GPU-day of training time on MNIST and 18 GPU-days of training on the CIFAR-10 data, whereas Bonsai requires only 15 minutes on a single-core laptop.