Month: January 2020
Web Packaging Proposal to Enable Offline Distribution, Installation and Usage of PWAs and Websites

MMS • Bruno Couriol
Article originally posted on InfoQ. Visit InfoQ

The Web Packaging proposal was recently published by the Web Platform Incubator Community Group (WICG). Web Bundles, more formally known as Bundled HTTP Exchanges, are a key part of the packaging proposal and seek to address the offline distribution, installation, and consumption of web resources.
Web packages provide a way to bundle web resources in one package and transmit them together. These bundles can be signed to establish their authenticity. The proposal states:
People would like to use content offline and in other situations where there isn’t a direct connection to the server where the content originates. However, it’s difficult to distribute and verify the authenticity of applications and content without a connection to the network.
The proposal describes three essential use cases. The first use case is the offline installation of Progressive Web Applications (PWAs), Once installed, the PWA can be used entirely offline. When a connection is available, the bundle may be updated to reflect changes in the application. While running applications offline is already supported by service workers, web packages also address the problem of secure distribution. For example, the PROXX bundle allows users to play the minesweeper game offline.
The second use case is offline browsing. Users may download a file, possibly containing a large website, and browse the site entirely offline. For instance, the entire web.dev site (as of 2019 October 15) can be accessed in a 200MB web.dev.wbn bundle file.
The third use case is saving and sharing a web page, which can be viewed in any browser implementing the proposal. Currently, browsers do allow their users to save pages. However different formats (like MHTML, Web Archive, or files in a directory) are used, which restricts the sharing of the saved pages to a specific browser.
Web bundles can be built using the go/bundle CLI, a reference implementation of the Web Bundles specification. To build a bundle for the TodoMVC Preact app, developers need only (assuming go and go/bundle are installed), build the app, and run the following command:
gen-bundle -dir build -baseURL https://preact-todom.vc/ -primaryURL https://preact-todom.vc/ -o todomvc.wbn
Web bundles are supported in Chrome 80 (scheduled for release in February of this year) behind a flag (chrome://flags/#web-bundles). Chrome 80 presently only allows navigating into a Web Bundle stored in a local file. The Web Bundle API implementation in Chrome is experimental and incomplete. Feedback from web developers is welcome. Feedback on the spec can be logged as issues in the webpackage GitHub repository. General feedback can be sent to webpackage-dev@chromium.org.
MMS • Jonathan Allen
Article originally posted on InfoQ. Visit InfoQ
We last mentioned primary constructors in 2014 when it was removed from the candidate list for C# 6 and VB 12. Late last year, Primary Constructors reappeared as proposal #2691, which is now a candidate for C# 9.
The basic idea behind a primary constructor is it reduces the amount of boilerplate code needed to initialize a class.
class C(string x)
{
    public string X
    {
        get => x;
        set {
            if (value == null)
                throw new NullArgumentException(nameof(X));
            x = value;
        }
    }
}
compiles as…
class C
{
    private string _x;

    public C(string x)
    {
        _x = x;
    }
    public string X
    {
        get => x;
        set {
            if (value == null)
                throw new NullArgumentException(nameof(X));
            x = value;
        }
    }
}
Richard Gibson summarizes how they would be useful,
a quick sample taken from our codebase of 30 classes shows that 22 of them (73%) had an explicit constructor defined and of those 21 (> 95%) did nothing other than set private readonly fields) are dumb, tedious, can be auto generated, are rarely read–normally skipped over–by humans (because they’re usually so dumb) and are therefore a surprisingly common source of bugs.
He goes on to explain those bugs are usually come down to accidentally assigning a constructor parameter to the wrong field.
This concept heavily overlaps with the records proposal we reported on in Easier Immutable Objects in C# and VB. MgSam writes,
This proposal seems completely incompatible with the current record proposal. And I disagree with the statement in the proposal saying this is more widely useful than records. I think this saves a little bit of boilerplate- records (and related features of auto-generating GetHashCode, Equals, ToString) can potentially save a ton of boilerplate in a lot of scenarios.
HaloFour also weighed in on the topic,
With the way records have been proposed for C# they include symmetric construction and deconstruction as well as identify based on a specific set of properties. Primary constructors get you all of that in one parameter list given that the parameters are also properties and that list gives you an order in which those properties can be deconstructed.
C# records, as they have been proposed, are more like Scala case classes or F#’s single case unions, and both languages define the construct by how they are constructed.
MMS • Jan Stenberg
Article originally posted on InfoQ. Visit InfoQ

From observing what is currently happening in the IT community, Kamil Grzybek concludes that most new projects are implemented using the microservices architecture. He believes though, that we in the IT industry are making a mistake adopting microservices just because we believe they will solve all problems in monolithic applications. Instead, Grzybek recommends we focus on architectural drivers, and emphasizes that every architecture has its pros and cons – it will solve some problems but also create new problems. In a series of articles, he has started to describe the basic concepts and properties of a modular monolith and the drivers leading to a specific architecture.
Grzybek, architect and team leader at ITSG Global in Warsaw, started by pointing out that the terms monolith system and monolithic architecture commonly describe a system where all parts form one deployment unit, but they are often also assumed to be interwoven rather than containing architecturally separate components, and both interconnected and interdependent rather than loosely coupled. He thinks this a very negative characterization and not the ultimate attribute of a monolith. He instead defines a monolith only as a system that has exactly one deployment unit.
To achieve modularity, and hence a modular architecture, Grzybek notes that you must have modules that are independent and interchangeable, and each module must have a defined interface and implement everything necessary to provide the functionality the interface describes. A module is never totally independent; it’s always depending on something else. But the dependencies should be kept to a minimum matching the principles: Loose Coupling, Strong Cohesion. To determine how independent and interchangeable a module is, we must look at three factors: the number of dependencies, the strength of these dependencies, and the stability of the modules it depends on.
Changes in a system more often target business functionality rather than technical parts. A module should therefore provide a complete set of features from a business perspective in order to be more autonomous and independent. It should also have a well-defined interface – a contract that defines what the module can do and hides or encapsulates how it is done. Grzybek notes that encapsulation is an inseparable element of modularity.
Architectural drivers are the set of requirements that have a significant influence over an architecture, and Grzybek refers to Michael Keeling for this definition. Grzybek classifies drivers into four main categories: Functional requirements define what problems a system solves, and how. Quality attributes determine qualities like maintainability and scalability. Technical constraints are about tool limitations, team experience and technology standards. Finally, business constraints relate to things like budget and hard deadlines.
Grzybek emphasizes that all architectural drivers are connected to each other; a focus on one of them often causes a loss for another driver. The software architecture of a system is for him a continuous choice between different drivers, and he notes that there is no predefined right solution – there is no silver bullet.
One common architectural driver discussed when comparing a modular monolith with a microservices architecture is level of complexity. Grzybek finds the modular monolith less complex than that of a distributed system. High complexity reduces maintainability, readability and observability. It also requires a more experienced team, an advanced infrastructure, and a specific organizational culture. If simplicity is a key architectural driver, he therefore strongly recommends a team to first consider a monolith and refers to an article by Martin Fowler: Monolith First.
In his article, Grzybek also discusses other drivers including productivity, deployability, performance, failure impact, and heterogeneous technology, and for each he gives an example and the driver’s impact on different types of architectures.
Grzybek concludes by emphasizing that:
the shape of the architecture of our system is influenced by many factors and everything depends on our context
Late last year Grzybek published a project where he designed, implemented, and in detail described a monolithic application with a Domain-Driven Design (DDD) approach. His goal with this project was to show how a monolithic application can be designed and implemented in a modular way.
At the microXchg 2019 conference in Berlin, Jan de Vries argued for building a monolith before going for microservices.
In a presentation at the Reactive Summit 2018 conference, Randy Shoup described an incremental architecture approach to building systems, and claimed that we should start with a simple architecture and evolve it as needs arise.
In a blog post 2015, Stefan Tilkov argued that the main benefit of microservices is creating clear and strict boundaries between different parts of a system. He also argued against the idea that a microservices architecture always should start with a monolith, and claimed that building a well-structured monolith, with cleanly separated modules that later may be moved out as microservices, is in most cases extremely hard, if not impossible.
MMS • Helen Beal
Article originally posted on InfoQ. Visit InfoQ

Kubernetes application performance management vendor, Instana, has announced support for managing CRI-O Kubernetes run-time containers and the applications that run on that infrastructure.
Instana monitors applications that run in containerised environments orchestrated with Kubernetes distributions including open source K8s, Red Hat OpenShift, Tectonic, IBM Cloud Kubernetes Service, Microsoft Azure Kubernetes Service, Amazon Kubernetes Service, Google Kubernetes Engine, Pivotal Kubernetes Service and Rancher Kubernetes. Now Instana also natively monitors container infrastructure and containerised applications by automatically discovering, deploying, monitoring and analysing data from CRI-O, correlating infrastructure and application information with other monitoring information.
Instana automates the lifecycle of application monitoring from application discovery and mapping to monitoring sensor and agent deployment, and application infrastructure health monitoring. When an update occurs to dynamic applications, Instana recognises that a change has happened within the application, and then makes the appropriate adjustments to maps, monitoring thresholds and health dashboards. InfoQ asked Matthias Luebken, infrastructure product manager at Instana to expand on the announcement.
InfoQ: Why is CRI-O considered important by Instana?
Luebken: CRI-O is the first Kubernetes run-time based on the Open Containers Initiative (OCI). That makes CRI-O attractive to application developers standardised on OCI. As those applications go live, correlated visibility into the applications and the stack will be critical for production monitoring.
InfoQ: How does Instana automatically deploy its monitoring capabilities?
Luebken: Instana has a single agent, multi-sensor system that builds on our experiences in APM along with later breakthroughs in SaaS and cloud computing. Our single agent runs at the host level and auto-detects what’s running from infrastructure up through application code. When it finds a particular technology it loads a purpose-built sensor, providing visibility into the stack and application. On bigger clusters the agent is backed by a Kubernetes operator which injects cluster knowledge into the management of the agent.
InfoQ: How does Instana help operators avoid alert noise or fatigue?
Luebken: By correlating infrastructure, scheduler and logical events and only reporting escalated incidents which may have an impact on end users. Events associated with the incident are then shown, along with analysis and a recommendation of the probable root cause.
InfoQ: How does Instana integrate with other tools such as service desk management?
Luebken: Instana makes use of APIs for both data collection and operations management, allowing data outside of Instana’s monitoring sensors to be included in the performance management analysis. There are also several methods for integrating with service management solutions – also through APIs or other standard communications.
InfoQ: Can Instana measure the business impact of a change?
Luebken: Instana works on an infrastructure level, on schedulers and on a logical level which provides users with insights into their business services. Individual services can be tied to the specific business processes or transactions with Instana’s application perspectives, which measure the parts of the application needed for specific business processes. Together with custom business metrics, it allows users to measure the impact of any particular change for the business.
InfoQ: How can Instana help organisations who are rearchitecting applications from monoliths to microservices?
Leubken: The automatic discovery and monitoring setup and the ability to support both a microservices and monolithic application architecture help here. The best practice our customers employ is to first place Instana on the monolith they’re going to convert. Instana will deploy all necessary sensors and capture the performance data needed to establish the golden baseline for post-conversion. This can be captured and stored as a snapshot in time. After deploying the microservice version, Instana will gather the new performance characteristics of the respective services. Instana identifies newly installed pieces of technology, begins monitoring their performance and displays them side by side to the monolith performance.
InfoQ: When teams are deploying to hybrid cloud environments, how does Instana help them manage that complexity?
Luebken: The key to monitoring applications in hybrid cloud environments is the ability to see the entire application end-to-end, even as it crosses cloud boundaries. Instana has that ability, which not only helps understand how one cloud system impacts another, it is also critical to Instana’s ability to trace every request end-to-end.
CRI-O is an implementation of the Kubernetes Container Runtime Interface (CRI) to enable using Open Container Initiative (OCI) compatible runtimes. It can be accessed on GitHub here.
Ballerina – An Open Source JVM Language and Platform for Cloud-Era Application Programmers
MMS • Michael Redlich
Article originally posted on InfoQ. Visit InfoQ
Open-source technology company, WSO2, have released Ballerina 1.1.0 with new features including: the new Ballerina Tool, enhanced IDE support for VSCode and IntelliJ IDEA; and improved performance in runtime type checking and creating and accessing maps, arrays and records.
Ballerina, a new open-source programming language for writing network distributed applications, is a new player among the non-Java JVM languages such as Scala, Groovy and Clojure. The release of Ballerina 1.0 in September 2019 was an effort three years in the making after WSO2 decided to create their own programming language in their efforts to improve the enterprise service bus (ESB).
Early in its development, the Ballerina team attempted to implement their own virtual machine, but experienced performance bottlenecks. Known as the Ballerina Virtual Machine (BVM), it executes Ballerina programs by interpreting BVM bytecode emitted by the Ballerina compiler. The Ballerina team ultimately decided that the BVM, despite having been implemented in Java, was not ready for production use and decided in favor of including a compiler that targets the JVM with the release of version 1.0.
As a platform for cloud-era application developers, Ballerina promotes networking as a first-class citizen into the language with the introduction of fundamental, new abstractions of client objects, services, resource functions and listeners. Developers can now build resilient, secure, and performant network applications that address the fallacies of distributed computing.
Lakmal Warusawithana, senior director of developer relations at WSO2, spoke to InfoQ about Ballerina.
InfoQ: What was the inspiration to create Ballerina?
Warusawithana: WSO2 was founded with the vision of “making integration better.” Our team has worked on thousands of integration projects. The Enterprise Service Bus (ESB) is designed to make integration simple by using a domain-specific language (DSL). The ESB’s higher-level abstractions, like mediators, endpoints and proxy services helped to create a solution for enterprise integration with a meaningful graphical view that wouldn’t be possible with a solution that was written in a programming language like Java, JavaScript or Node.js.
With our 15+ years of experience, we came across some complex scenarios that cannot be described by the DSL. Typically, these will end up by writing extensions with Java. In practice, this means that complex solutions are written as a combination of DSL configurations and Java extensions. This brings down the advantage of GUI based integration projects because Java extensions are a black box as far as the ESB’s graphical interface is concerned.
This creates additional complexity for many aspects of the software development process like the build, deployment, and debugging. ESBs are designed to work well in a centralized architecture where a single monolithic ESB controls the entire enterprise integration. It is an anti-pattern for modern microservice architectures and badly affects the agility and DevOps of enterprise integration projects.
These limitations led us to create Ballerina. The high-level goal is to create a programming language and a platform co-designed together to make enterprise integration simpler, more agile and DevOps friendly by including cloud-native and middleware abstractions into a programming language in addition to the expected general purpose functionality.
InfoQ: Please describe how Ballerina addresses the fallacies of distributed computing.
Warusawithana: With the emergence of microservices architecture, applications are developed by using a large number of smaller programs. These programs are mainly integration microservices. They interact with each other over the network and provide the application functionality. Now developers have to deal with all the fallacies of distributed computing in these smaller applications.
For example, developers usually implement these services by writing an explicit loop that waits for network requests until a signal is obtained. But if you use Ballerina to write a service, you can use the language-provided constructs and it just works. Network abstractions like endpoints, listeners, services, and remote methods are first-class language constructs in Ballerina. It makes dealing with a large number of smaller services a lot more convenient.
Ballerina services can have one or more resource methods where you can implement the application logic. A service can work in conjunction with a listener object. A listener object provides an interface between the network and the service. It receives network messages from a remote process according to the defined protocol and translates it into calls on the resource methods of the service that has been attached to the listener object. HTTP/HTTPS, HTTP2, gRPC, and WebSockets are some of the protocols that are supported out-of-the-box in the listener object.
Another key abstraction is the remote method, which is part of the client object. In Ballerina, a remote method is invoked using a different syntax from a non-remote method. A program sends a message by calling a remote method by using the protocol defined in the client object. The return value corresponds to the protocol’s response. Since these remote methods are calling over the networks, we need to implement different resilient techniques in our code to deal with unreliable network behavior. Resilient techniques like a circuit breaker, load balancing, failover, retry, and timeout comes out-of-the-box in the Ballerina HTTP client object.
Ballerina does not try to hide the network in the application code. Network data types like XML, JSON, table, and stream are built into the language. Due to the inherent unreliability of networks, errors are an expected part of network programming. Ballerina’s approach is to explicitly check for errors rather than throw them as exceptions. It’s pretty much impossible to ignore errors by design.
Distributed systems work by sharing data between different components. Network security plays a crucial role because all these communications happen over the network. Ballerina provides built-in libraries to implement transport-level security and cryptographic libraries to protect data.
In addition to this, Ballerina has an built-in taint analyzer in its compiler. Taint analysis is designed to increase security by preventing any variable that can be modified by user input. All user input can be dangerous if they aren’t properly checked. As a result of the taint analysis mechanism, the Ballerina compiler identifies untrusted (tainted) data by observing how tainted data propagates through the program. If untrusted data is passed to a security-sensitive parameter, a compiler error is generated. Since the taint check happens at the compiler stage, the programmer can then redesign the program to erect a safe wall around the dangerous input.
Earlier, developers simply wrote their program, built it and ran it. Today, developers also need to think of the various ways of running it, whether it be as a binary on a machine (virtual most likely), by packaging it into a container, by making that container a part of a bigger deployment (Kubernetes) or by deploying it into a serverless environment or a service mesh. However, these deployment options are not part of the programming experience for a developer. The developer has to write code in a certain way for it to work well in a given execution environment, and removing this from the programming problem isn’t good.
Ballerina specializes in moving from code to cloud while providing a unique developer experience. Its compiler can be extended to read annotations defined in the source code and generate artifacts to deploy your code into different clouds. These artifacts can be Dockerfiles, Docker images, Kubernetes YAML files or serverless functions.
InfoQ: Please describe the concept of the sequence diagrams for programming. Is it simply a method to write code based on a sequence diagram? Or is there a way to generate source code from a sequence diagram and/or export a sequence diagram from source code?
Warusawithana: With our 15+ years of experience working with customers on thousands of integration projects, we saw that a sequence diagram is the best way to visually describe how services interact. This was the foundation for designing the syntax and semantics of the Ballerina language abstractions for concurrency and network interaction so that it has a close correspondence to sequence diagrams. Additionally, this is a bidirectional mapping between the textual representation of code in Ballerina syntax and the visual representation as a sequence diagram. The Ballerina IDE plugin (for example, the VSCode plugin) can generate a sequence diagram dynamically from the source code. The generated sequence diagram fully shows the aspects of the behavior of that function that relates to concurrency and network interaction.
InfoQ: How was the name Ballerina chosen for this new language and is there a significance to the name?
Warusawithana: At the beginning of this project, we did not have a proper name and we used a code name called NEL (New ESB Language). There were a couple of internal mail threads with more than 100 mails suggesting different names but we never settled on a single name. The name “Ballerina” was initially suggested by Manuranga Perera, lead engineer – Ballerina team, as enterprise integration and the interactions of components is similar to how ballets are coordinated and choreographed.
InfoQ: What’s on the horizon for Ballerina?
Warusawithana: Ballerina is not a short term project. Ballerina is set out with grand plans to bring pretty much all enterprise middleware into a programming language. The current Ballerina release is based on the jBallerina implementation which provides a compiler that produces Java bytecodes as well as an implementation of the language library and the standard library. We are planning to do an implementation that compiles directly to native code and the Ballerina team has started to look at using LLVM for this.
As per the short term goals, in 2020, the Ballerina team is planning to add the following features:
- Language integrated query
- Streaming query
- Better concept of tables
- Better database integration
- Transactions including distributed transactions between Ballerina programs
- Locking
- Dataflow style data mapping
InfoQ: InfoQ: What are your current responsibilities, that is, what do you do on a day-to-day basis?
Warusawithana: In my current role, I am focusing on evangelising and building developer relations around the Ballerina community. I spend most of my time working on evangelism presentations, speaking, writing articles, and building ecosystems around Ballerina. Previously I have contributed to the Ballerina spec, design, and architecture mainly on Docker and Kubernetes integration with Ballerina.
Getting Started
There are two valid entry points for a Ballerina application: a method, main(), which runs as a terminating process; and a hosted non-terminating process, service.
A GitHub repository containing short examples demonstrating how to use both entry points is available to get started. Ballerina also offers numerous examples and a repository of reusable modules.
Ballerina plugins for both IntelliJ IDEA and VSCode are also available for developers.
Resources
MMS • Sergio De Simone
Article originally posted on InfoQ. Visit InfoQ
IBM has recently discontinued its involvement in Server-side Swift development, which started soon after Swift was open-sourced, and relinquished its leadership in the Swift Server Work Group [SSWG]. InfoQ has talked to IBM’s Chris Bailey to learn more about what this may imply for Swift and the Swift community.
The announcement, that went public on Swift’s mailing list last month, sparked immediate reactions (1 and 2) in the Swift and broader developer community. Comments ranged across a rather large set of conjectures and diverse ideas about what IBM’s announcement may actually mean for Server-side Swift development and what led IBM to such a decision.
Some developers hinted at Vapor, a competing framework to Kitura, IBM’s framework for server-side Swift development, gaining more traction and making Kitura a less compelling choice. Others pointed at competitor languages such as Rust and Go as being more successful than Swift on the server. Some went so far as to suggest this could be the end of the Swift-on-the-server story. For each argument, some kind of counter-argument could be thought. Twitter offered a similar landscape.
To contribute to clarify how things really stand, InfoQ has taken the chance to speak with Chris Bailey, former Senior Technical Staff Member working on runtime technologies for Swift, and one of the two IBM contributors who left the Swift Server Work Group, along with Ian Partridge.
Could you describe your past involvement with the Server-side Swift project? What were your main contributions to the project?
Myself and the wider IBM team have been involved in the open source Swift.org project since it was announced. In the early days that was primarily making the core Swift language and APIs a viable option on Linux and in server environments. This included working on the Swift language itself, the Dispatch concurrency library, and the Foundation API library all of which form the Swift runtime. We also launched the Swift Server Work Group (SSWG) to bring together the various community groups working on server frameworks to collaborate on a common set of core libraries and expanding the server ecosystem.
Outside of the Swift.org community, we also created the Kitura framework and an ecosystem of libraries and tools around it to provide a complete microservices framework, with everything needed to run cloud-native applications.
Kitura is a well established framework, with over seventy contributors and 163 releases over the years. Do you think it remains a great options for developers wishing to use Swift even after Ian Partridge and you have left the project?
Kitura has thousands of downloads each day, and a number of large enterprises are using it in production — some of whom have talked publicly about how they are using it.
IBM is still supporting Kitura through any existing commercial agreements, but we’re reducing our contributions to onward development of new features. This provides more space and opportunity for the wider community to engage — and we’re working to enable interested parties from the community to pick up this technology. Like any open source project, its long term success is dependent on there being an active community around it, and one where users are also willing to contribute to the technologies that they consume.
The hope is that this will make Kitura a more community led project and that it will continue to flourish.
What is the status of Swift for Linux? What needs to be done in your opinion to make it a competitive player for that platform?
Swift is a great technology and one that stands firmly on the shoulders of giants — as a new language it has been designed and built fully in the knowledge of what has gone before and has adopted some of the best aspects of other languages.
It also has good fundamental characteristics for use on the server. Its heritage and focus on being used for mobile devices also means that it has a low memory footprint and benefits from fast startup – both of which are also valuable when running on servers.
The big question has always been whether it can cross the chasm from being something that iOS mobile developers use to build a full-stack backend for frontend (BFF) for their mobile apps, to a general purpose server technology used for a wider set of use cases.
Swift benefits greatly from being an embedded part of Apple’s ecosystem, but it also provides challenges for its organic growth as there’s a lot of dependency on Apple for capabilities that the server ecosystem requires. For example, almost all Swift developers use Apple’s Xcode as their IDE and it has fantastic support for developing for iOS devices, including the ability to run locally in emulator environments. It would be great to add support for writing server code that allows developers to develop directly into containerized environments from their local IDE by supporting the simple integration into Xcode of development tools such as Appsody. Where there is open governance and open ecosystems, it enables the community to contribute and to solve the problems and use cases that are important to them.
Apple are working hard to address these issues, to make Swift more open, and to help build the server ecosystem — and this has recently stared to pick up pace. Tom Doron has been a driving force from Apple in promoting the server ecosystem through the Swift Server Work Group and leading Apple’s efforts in the server space. Additionally Ted Kremenek has recently posted On the road to Swift 6, which describes a strong statement of intent on steps to expand the ecosystem and make it more open — including driving more focus around the fledgling Language Server Protocol (LSP) project, which will enable other IDEs to better support Swift development.
Since Server-side Swift and Kitura were launched, the server-side, native language arena has seen the rise of Go and Rust. Rust especially seems to be a direct competitor to Swift, at least in terms of its focus on safety-first. How do you see those languages stack up against each other?
Go, Rust and Swift are often grouped together as “Modern Native Languages” being type-safe, compiled, native languages which are seen as modern replacements for C and C++.
In terms of programming languages, Swift is very young. It first appeared in mid 2014, but its first release as an open source project with official support for Linux didn’t occur until September 2016 — making it only 3.5 years ago. By contrast, Go is just over 10 years old and Rust is 9.5 years old. This means they’ve both had a significant head start.
Go has found a real niche as a systems language being used for the core infrastructure of cloud technologies like Kubernetes, as well as for developing CLIs. Rust is still finding its niche to a certain extent, but there’s lots of interest being driven by Web Assembly. Swift is obviously a little further behind in the adoption curve.
At last years AltConf, I presented a Server-Side Swift State of the Union which discussed the current level of adoption of server-side Swift. One of the things that I showed was a comparison of the size of the package ecosystem for Swift against Node.js at the same age — whilst Swift is behind where Node.js was at the same age, its nowhere near as far behind as you might expect.
Fundamentally, Swift on the server has a lot of potential, and it would be fantastic to see that potential convert into success and wide-scale adoption.
You can follow the evolution of Server-side Swift on its official forum. InfoQ will continue to bring its audience any significant story concerning it.
MMS • Luke Hoban
Article originally posted on InfoQ. Visit InfoQ
Transcript
Hoban: My name is Luke Hoban, and today I’m going to be talking about programming the cloud. When I talk about programming the cloud, what I really mean is taking advantage of all these amazing building block services that we have in the cloud providers today. Things from AWS, from Azure, from GCP, from Kubernetes, from every other cloud provider that we work with on a daily basis have amazing building block capabilities that we’re now building on top of with all of the applications we’re delivering. What we really want to do is turn all those capabilities into something that we have at our fingertips that we can really take advantage of in a really natural way, not hand over to some operations team to do something for us, but how can we, as developers, actually take advantage of all these capabilities directly?
My interest in this topic comes from my background and the things I’ve worked on over the last 15 years or so. I spent most of the early part of my career actually building tools for application developers, so building programming languages, and IDEs, and frameworks at Microsoft. I helped start the TypeScript project at Microsoft. I did some of the early incubation work on what has now become Visual Studio Code. I worked on the ECMAScript standards body, a variety of these sorts of things. Worked on some of the tools that have helped application developers to scale up the complexity of the applications that they build.
I then went over and worked at AWS on EC2 and worked on some of the raw cloud infrastructure that we have now available to us. Got a front-row seat to the rate of growth that’s going on inside the cloud, and also, a front-row seat into how different the tools and practices are around how we’re taking advantage of the cloud today. We do have these amazing building blocks, the tools and practices are quite a bit more immature in a sense than what we have in the application development world.
Then, most recently, as Joe [Duffy] mentioned, I joined him and a number of others to start a company called Pulumi, which is really focused on bringing these two together, and I’ll show some demos throughout here that used Pulumi. We’re really going to talk more about the general problem and opportunity that I see here.
An Analogy
To give a background and analogy for why I think there’s a problem and analogize into something which folks may have some understanding of, I want to start with where application development was, say, 40 years ago. I don’t actually know exactly how long ago it was that this was a state of the art, but some time ago, the state of the art was “I’m going to write assembly. This is how I’m going to build applications. This is the best thing I have.” One thing that’s really important to understand about this being the best thing is that there was really a period in time where this felt like the best thing. By writing this code here, I got access to computers. I got access to use computers to do computations for me that either would have been hard or potentially impossible for me to do myself. I got access to the modern microprocessor, all of these capabilities. If I had the skills to go and learn how to use this thing, I had amazing capabilities at my fingertips.
The problem was, looking from today’s lens, this was an incredibly low-level way of working with this. That would not have, by itself, scaled up. We can look at some of the things that are clearly missing from this from a modern perspective. There’s things like, there’s no variables, there’s no self-documenting code, where my variables have names that I can understand. I have to look at these very complex registry names and offsets. There’s no loops. I have to manually decode loops into branching constructs. I don’t have any of this basic control flow capabilities.
I don’t have functions, and this is where it gets more interesting. It’s the ability to take a piece of code, write it once, give it a name, reuse that in multiple places. This concept wasn’t in this low-level description of things. More importantly, I don’t even have the ability to create abstractions, so these combinations of functions which then share a common data type that they operate on and I can turn into a reusable library. All of this capability wasn’t really available here. An abstraction becomes really useful then when you build standard libraries out of it. You build libraries of these abstractions that solve for common use cases so that if people are going to rebuild applications for a variety of different purposes, they’re going to reuse standard libraries that are available and shared amongst multiple people. I don’t have that here. Here, I have to copy-paste the assembly code from one application into another to reuse it. Finally, once I have standard libraries, I want types to describe what the APIs these things are and to give me checking and validation over the top of that ahead of time.
Assembly didn’t have any of these things, and you probably all know we solved this problem by introducing C, introducing a higher-level language that’s a bit more attuned to what developers were actually doing. They were actually trying to create reusable libraries, create abstractions, have a standard library, have types that they could use. Over the intervening 20, 30 years, we’ve gone up the stack even further, of course. C, these days, is considered incredibly low level, and so, we had Basic, and then Java, and then .NET, JavaScript, Python – much higher-level languages that take care of more and more of the heavy lifting that we might have to do.
One of my basic views is that where we are with the cloud today is still very much in this assembly world. This is very low-level world of having to work with very low-level building blocks that are incredibly powerful. Do give us access to these things that have a lot of capability, but there’s so much opportunity still to move up the stack. I’ll talk a little bit about that throughout the talk today.
Software Engineering Desiderata
When I think about is what I do as a software engineer, what are the things I value when I’m looking at tools at a software engineering perspective, what are some of the things I like. I won’t talk through all of these, but, if you’re doing application development today, you probably see some of these things like, “Yes, those are important things to me.” If I hit some application development environment where I didn’t have access to high-level languages and I had to write an assembly, that would be bad. If I didn’t have access to package management, that would be bad. These are things which generally are considered useful.
The interesting thing is that many of these really are not things that are available in the typical workflows around infrastructure today. In fact, there was a whole talk. For those who went to Yevgeniy’s [Brikman] talk before this, in this track, there was an entire talk just about how to do unit testing and integration testing for infrastructure. These are not solved problems. These are problems that still need a lot of work, and they’re not the norm for folks to be doing this. I’ll talk about a little bit more about a few of these as we go.
Infrastructure as Text
One of the things that folks may think, if they’re especially coming from the DevOps side of things, is that the solution to a lot of these problems that we talked about on the last slide, all of these things we want from software engineering, the solution is infrastructure as code. It’s taking my infrastructure and turning it into code, and using software engineering practices around that code. This is actually really true. I think infrastructure as code is one of the foundational tools that we have available to us to make infrastructure more programmable, more amenable to software engineering.
There’s a lot of tools for this, so many folks here are probably using one or more of these tools. There’s CloudFormation and Azure Resource Manager for the major cloud providers. Terraform is very commonly used for multi-cloud and cross-cloud things. Then, of course, I’m throwing Pulumi here just because that’s where I work on, but there are lots of tools around infrastructure as code that we can use.
The problem is that most of these tools actually aren’t infrastructure as code. They’re infrastructure as text. This is actually an important distinction. Infrastructure as text is still useful. It means I can source control my files, it means I can still run CI/CD processes of my files, but it doesn’t mean that I have all the same richness of software engineering capabilities as I have with code. What we really want to look at is what does it mean to bring some of these capabilities of code of application development into my infrastructure. To do that, let me start with a quick demo and take a look at infrastructure as code with a focus on the developer experience.
Demo
I’m going to start with an empty beginning application here. I’m going to just write some infrastructure, but I’m going to do this in code, I’m going to do this, in this case, in TypeScript, but Pulumi supports a variety of different languages. What I’m going to do is I’m going to start by just writing that I want to have a bucket, so I’m going to say, new aws.s3. There’s a couple of things we notice right away. First off, I’m in Visual Studio Code here, so I’m in an IDE. I’m getting that IDE environment that I expect from a rich development language. I’m getting things like, when I hit .s3, when I hit . here, I get access to all the different APIs that are available in my cloud platform in the same way I get all the access to all the different APIs available in .NET or in Java or what have you. I’m getting all of that directly within my environment. Then I get access to all the different things in the s3 namespace. I can create a bucket, and I get all the help text, and all these things, full IDE experience here. I just want to say bucket. Now I want to just export bucketName.
What Pulumi does is it lets me take this code written in my language and just say, “pulumi up,” to go and deploy it. When I do pulumi up, first, it’s going to preview my application. It’s going to say what will this do to my cloud environment. We’re about to modify an actual running cloud environment, want to give you a sense of what’s going to change. In this case, it’s telling me it’s going to create that bucket. I can see the details of what it’s going to create, like here. I can go ahead and say yes. This is standard infrastructure as code. The only difference is that I’m using an existing programming language here, like TypeScript, to define that infrastructure as code.
Because I’ve got this, I can then go and create more resources. I can say, const obj = new aws.s3.BucketObject. In this case, I want to set a few different properties on here. I can say I want this bucket object to live inside that bucket. I want its key to be “obj” and I want its content to be “Hello, world!” Now when I run pulumi up, I’ll see a preview again of what changes are going to be made. This time, instead of creating both of these resources, like I would if I was running a typical imperative program, we’ll see we’re only going to create the new object, only the change that I made, only the things different from what’s already deployed. You can tell this program is really describing the desired state of my infrastructure, and every time I deploy it, I’m updating my infrastructure to match this new desired state. In this case, I’m going to create that bucket object. You see it has the “Hello, world!” content and the key “obj.” I’ll go ahead and deploy that.
So far, this is just standard. If you use Terraform, if you use CloudFormation, something like that, this is looking fairly familiar to that experience. This is just infrastructure as code The only difference is I get a little bit of IDE experience, get a little bit of type checking, so if I mess up the names, I get feedback on that right away, a lot of these simple things, but really, it’s fundamentally the same.
Where things start to change is when I can use all the capabilities of the underlying platform. I can use a for-loop and I want to create one of these objects for each filename in this directory. I’ll use the filename as the name of this thing. I’ll use the filename as the key. Instead of hardcoding the content, I’ll read that off of disk. I’ll just say readFileSync and just do a little bit of Node.js stuff to combine the root folder with the filename. There we go. We’ve written a little loop that creates my infrastructure. This is using some files on disk, going to find out what they are, going to put each one of them up into this s3 bucket. This is still infrastructure as code, but here, I’m actually describing that desired state by doing some computation using some libraries from Node. It’s starting to feel a little bit more like a code, like something that’s programmable.
One thing you’ll notice, I get a little squiggle here. I’m actually getting some of this feedback that’s telling me I can’t assign a buffer to a string, and in fact, that’s because I have a subtle mistake, which is that I need to describe what encoding this file is in before I upload it. It’s feedback I can get from my IDE here. I’ll just go ahead and update. You should see we’ll actually delete the old object we had and create two new objects. We’re going to change the infrastructure here. Scroll up, we’ll see we’re creating these two new ones, index.html and README, and I’m going to delete this object. I can see the details of what’s inside those. This one has some markdown in it. This one has some HTML in it. I can go ahead and deploy that. We can use things like for-loops.
I’ve been doing this iteration of going back and editing some code and then running pulumi up. One of the things that we’ve just added recently as an experimental capability, something that I really think is interesting, is the ability to do this interactively. I can say, PULUMI_EXPERIMENTAL=true and then pulumi watch. Now, when I make changes to my code, it’s just going to automatically deploy them, and so it feels a lot more quick. If I want to make this a public website, for example, I can say, indexDocument: “index.html.” I hit Save and you’ll notice it starts updating immediately. I can continue working on my application as it’s updating in the background, and all of this is deploying in the AWS as I make these changes. I can make a few other changes along the way. To make this something that’s accessible publicly, I’m going to make it “public-read” acl, and I’m also going to make the content type be “text/html.” Finally, I’m going to export the URL, and I’m going to export that bucket endpoint.
We’re doing updates as we go, so we’re seeing this application. All these cloud resources are just magically appearing as I’m editing my code and hitting Save. We’re creating resources, we’re updating resources, the cloud environment is changing right as I type this code. I can come over into a new output here, a new window here and say, pulumi stack output bucketURL. Get the URL that I just exported there of the running application, come over into a new window and open it, and there we go. I’ve got a little static website being hosted out of a few files and I just wrote that using some code, using that interactive development style, all just in a few lines of code. It feels quite different, I think, for those of you who’ve worked with CloudFormation or something like that. The experience here is very different, even those what we’re ultimately doing is working with a lot of the same primitives.
One last thing I’ll talk about just from the perspective of software engineering is I can take this function here which syncs these files into a folder. I can even just give that a name; I can say, syncDir. I can take two things. I’ll take the bucket I want to sync it into, so I can say s3.bucket, and I want to say dir, which is a string. I can just say, “I want to make this into a function that I can call.” I’ll call syncDir. Now, instead of hardcoding these files here, I can just set the dir and set the dir here. I’ve given that function a name, I’ve abstracted away that capability to sync a bunch of files into a directory. You actually see that update didn’t change anything when I made that change. I refactored my code, but it was observationally exactly the same. It’s creating the same resources.
I could go further here. I could document this, I could put it into an NMP package. I could put that NPM package, publish that to NPM and reuse it across multiple projects. A lot of these core software engineering capabilities I have because I’ve turned this thing into a reusable function and a reusable piece of code. That’s a quick overview of using Pulumi to do infrastructure as code for developers.
One of the things that I think is most interesting about that last example was that watch mode that I showed where I was being able to interactively develop code and develop infrastructure as I edited. One of the things that reminds me of is this demo that many of you may have seen vectored to this talk back 10 years ago or something, where you showed up a whole bunch of things with developing in environments where you are able to interactively modify the code and immediately see the results of it inside the application and how, by doing this, by closing the gap between when you are writing the code and seeing the impacts of that code. Every time you could meaningfully decrease that gap, it enabled people to be so much more creative, because they could see the results and feed them back into the thought process immediately. This idea of being able to have this really tight feedback loop is one of these things which I think is really critical for application development. The tighter you can make that loop, every order of magnitude faster you make that, the more that people can take advantage of these building blocks and use them in really interesting ways.
This is one of the things with cloud development today. I think in a lot of places, cloud development feels very slow. In many organizations, you have to throw it over the wall to some other person who has to go and do the work for you, either Ops team to provision some hardware or DevOps team to tell you what you’re allowed to do inside the Dev environment. Even when you do have access to it yourself, a lot of the cloud provider primitives are themselves fairly slow to use, but there’s an increasing set of these cloud primitives that are actually very fast, things like what I showed with s3 buckets, things like serverless functions, things like containers in Kubernetes. We can actually do this iteration very effectively.
There’s lots of tools in practice that are doing this today in other parts of application development, things like Chrome DevTools. The ability to just immediately understand what’s happening inside your website and be able to modify it live inside the DevTools, created this really different way of thinking about web development that has really made web development substantially easier than it was in prior eras of web development.
Even in the cloud space, there’s other folks working on this problem. One that I am a fan of is something called Tilt. This is a project in the Kubernetes space that’s actually trying to take the same approach to really tightening this feedback loop for the way that we develop and deploy Kubernetes applications. We don’t have to go and run those things and test those things on our local machine independently. We can actually do that inner-loop development cycle directly inside our Kubernetes clusters. That’s a really interesting project.
Then Dark, which has a talk in this track later this afternoon, is taking all this even further and saying, “By rethinking the whole stack for deployments, rethinking the programming language and the platform that we’re going to run on, can we take this from a couple of seconds to do this deployment to tens of milliseconds to do this deployment, make it so that every time I change my code, I’m immediately seeing that deployed into runtime?” I’m really excited about this general direction of enabling that.
Process Models
One of the things that I think happens around a number of these things, when we’re thinking about this idea of every time I change my code, I’m deploying a delta into my running environment, it makes you wonder a little bit about what is the process model, what is the execution model that these programs are using. I want to talk a little bit about process models, just a background for how I think about why this environment is different and what it means as a developer trying to target this environment.
Imagine one of the environments that we have, and I’ll talk about this from a JavaScript perspective and how JavaScript itself has evolved. JavaScript started in the web and that was the execution environment, was the page. Every time I navigate from page to page, in some sense, my entire world gets torn down and restarted up again with some different set of JavaScript. Everything is very transient in this execution environment. I have this page as very short-lived things. I load my code in via script tags, and everything is very stateless. Everything that I want to be stateful, I have to send off to some API server or something like that to manage the state. My application environment itself is this very short-lived thing that has no long-term state associated with it.
Further along in JavaScript’s lifetime, Node.js happened, but certainly, the thing that probably folks here are most familiar with as a process model is the server process the idea that I have some operating system process. Folks often think about these things as living for a long time. I run my process on my server, and it lasts for days, months, years, potentially. One of the key things about process is that they do fundamentally have this idea that they have a finite lifetime. Either they crash, because I did something bad in my process, and so it died, or the machine they’re running on crashes, and so they’re no longer there, or I want to update them. I want to run a new piece of code, and so the only way for me to run a new piece of code is to actually deploy the new piece of code into a new process, tear down the old process, and make sure that anyone who is using it is pointed at the new thing. Processes fundamentally have this notion of a finite lifetime that they’re going to run for. You can deliver these through ELF binaries or Windows EXEs or what have you. Again, still processes are largely stateless. Because they can die, their state is managed somewhere else, either on disk or in some operating system or other concept that’s going to maintain the statefulness.
In the cloud, I think there’s this other process, and this thing doesn’t really have a name. I’ve never seen some standardized name in the industry for this. In Pulumi, we call it a stack, but it’s the idea that I’m going to deploy some infrastructure into the cloud. I’m going to deploy a serverless function, for instance, into the cloud, and it’s going to be there forever. When I deploy a serverless function, it doesn’t matter if any given process dies, if any given EC2 instance underneath the hood dies. That serverless function logically exists forever. It has an endpoint that’s accessible that’s going to access it. This notion of an execution model where the thing I’ve deployed is a process that’s going to run forever, and every time I want to make a change, I don’t make a change by deploying a new EXE or deploying a new JavaScript bundle. What I do is I make a change by describing a new desired state and telling some orchestration tool to drive my existing environment, which is still running, into that new state.
This is more for folks who have used things like editing continue. This was a big thing, I remember, when I started my career. DB6 had had editing continue, and in .NET, we didn’t have editing continue, and it was this big deal to bring editing continue to .NET for the first five years I was working at Microsoft. This idea of being able to take a running application, make changes to it while it’s running, but keep it running and keep it state all consistent, really changes the way you think about developing applications. I think this is one of the things with cloud infrastructure. One of the reasons they feel so different is that they’re not just a process. It’s not just, I go on to a VM, and I restart the process, and I’m all good. It really is that this application I’m developing is one that’s going to run effectively forever. I need to edit it as it’s running, and so I think that’s a key new idea that changes a lot of these things.
Application vs Infrastructure
One other concept I wanted to touch on really quickly is the applications and infrastructure piece. One of the interesting things that I’ve noticed is, in a lot of environments, applications infrastructure is not an unified thing. You’re actually treating it very differently. In many organizations, these things are owned by entirely different teams. Even in organizations where they’re owned by the same team, they’re often managed in separate repositories, and so managed as totally separate code bases. Even when they’re in the same code base, like in this architecture example here, they’re driven off of different deployment pipelines. Along the top route, we deliver our application code, and in this case, a Docker image, and we push it into some container registry. Then in the bottom route, we deploy some infrastructure as code, in this case, using CloudFormation. That maybe deploys our cluster and our services into the cluster that take advantage of the application that is built above.
This idea of separating these things and having them be run very independently, it can be good for a lot of reasons, but it really often decouples things which are meant or which there’s reason to think they should actually be more coupled. By coupling them together and deploying them and versioning them together, things would be a lot simpler, and pipelines like this wouldn’t actually be necessary anymore.
Application + Infrastructure
One example of this that I’ll show in a live demo in a second, is this piece of code here. This is some Pulumi code, again. It looks, at first blush, just like a normal piece of infrastructure. I’m saying I want to have this cloud.Task thing, which represents a containerized task that I can run in the cloud, and I want it to have its desired state, I want this Fargate task. It has 512 megabytes of memory reservation.
Then there’s this line that’s interesting, it says, build and then this local folder. What does that line do? That line says, “In my desired state, I want to be running the Docker image that was built from that folder.” You think about, “What does that mean?” It means I have to actually, “I need to have a registry in the cloud where I can run, where I can put that Docker image.” When I do this line of code, Pulumi underneath the hood is actually going to allocate a Docker registry for me in AWS.
It means I need to build that Docker image locally on my machine, because whenever I’m doing this deployment, that’s the code I want, whatever code in that folder is ready to deploy. I’m going to run a Docker build, and then we need to actually push that Docker built image up into the registry. All of those steps we should have taken care of automatically here, but it means we actually version these things together. Every time I deploy my infrastructure, I get whatever the latest application code is. These things version identically together. This is a very different way of thinking about these things than we often do when we separate out the notions of how our infrastructure and how our applications evolve.
Pulumi is, by no means, the only place where this happens. I think one of the places you see this a lot is actually in something like Docker Compose. One of the reasons why developers really like using things like Docker Compose is they let them couple these things a little bit. They let them create a little infrastructure environment locally on their machine that describes how their application service or their piece of code they’re writing can run inside the environment that includes the database, includes the network, includes whatever other pieces of infrastructure they want to run, but can actually pick up whatever the latest code they have is and run it inside that environment. Docker Compose, I think, is one example of this.
Another one is serverless. Both serverless the general technique and the serverless framework really encourage this idea that we couple our deployment of our code and the infrastructure. Inside serverless, we often don’t have a distinction that the code makes much sense outside of the infrastructure. The entire way that we can invoke that function depends on how we’ve hooked up the infrastructure around it. The logging of that thing depends on how I’ve hooked it up to my logs. The access control is all based on IM and things like that. When we do serverless, we often are really naturally driven to a world where we version these things together, but I think there’s actually reasons why this stuff can get integrated more and more.
Demo
Let me show one example of this that goes a little bit beyond even those examples back in Pulumi. I’ll just show it right here. In this case, I’ve got the same application I just deployed which had the bucket and some objects inside the bucket. One of the things we can do inside Pulumi is we can look at this bucket object, and we have a bunch of properties on it that give me access to all these different things. You’ll notice, there’s also these two functions. There’s onObjectCreated and onObjectRemoved. These are functions which actually allow me to hook up callbacks onto my infrastructure. I can say newobject. I can actually just hook up a callback right here. I can say, when this is called, I want to just print out this “ev” object. I’d say even, this is actually going to go ahead and start deploying this infrastructure.
The interesting thing about this is that this is actually two things. This is some infrastructure, you’re going to see a bunch of things down here that are getting deployed, a BucketEventSubscription, a lambda function, an iam role, all the things I need to deploy this capability, but it’s actually also some code. This code inside here is code that’s going to actually run it runtime When my bucket gets a new object added to it, we’re going to run this piece of code here. We’ve taken this idea of coupling this infrastructure in the application code to quite a bit of an extreme here by actually incorporating them into the same source file. These things are really versioning very closely together.
Now this update is completed. If I make some change, like I come in here and say Hi QCON SF, I can hit Save, this will do an update which should actually deploy that bucket object. Because I changed an object inside my bucket, it should invoke this function. In a couple of seconds, we should see that this logging actually gets run and I get the logs back into my IDE here. The roundtrip time for CloudWatch is sometimes a couple of seconds, so I’ll just wait for it to finish here. There we go.
We see that now we’re actually getting the logs from that runtime capability as well. Whenever an object gets added, we’re getting that log sent, and that’s going to be in CloudWatch somewhere, so I can access it from AWS, but it’s also here within my development environment. I’m now actually combining into my development environment both these infrastructure changes that are happening and some of these runtime changes that are happening, so really getting this inner-loop development quite tight here.
Transition to Cloud Native
One of the things that I think happens related to this is, when you look at the world of – I call it pre-cloud here, but really, this is also what, for a lot of people, is the cloud but, it’s this transitionary period of cloud where it’s doing lift and shift. Everything is still very VM-based. I’m running my own processes inside my own VMs, and my provisioning is saying what I want to run inside these VMs. When I move to cloud native, I move to something like what’s on the right. When I say cloud native here, by the way, I don’t mean Kubernetes. I think, for a lot of people, cloud native means Kubernetes. For me, I mean, native to the cloud, so I mean using the native capabilities of the cloud. I may have some infrastructure or architecture like what’s on the right. I have some API Gateway and Lambda, I have EKS and S3, a variety of these high-level managed services that I’m using.
You may look at this and say, “That right-hand side looks way more complicated. Why would I want to move to this world? That looks terrible.” I think, in some ways it is. There’s more stuff here There are moving pieces in this thing. There’s more that you have to understand. The thing that’s really key, though, about the right-hand side is that the operationally complex parts of this are these gray boxes The pieces that I own the operational behavior of and don’t get to outsource that to a cloud provider are the application code I’m going to run inside these little boxes. Whereas on the left, I own the operational context of that whole VM. I owned everything about what’s running inside that VM. In this cloud native world, I offload a lot more of that complexity onto some cloud provider, and I now own these boxes here.
The thing I trade off for that operational complexity benefit is I now own all these arrows and all these edges between these components. I own describing how all these things are hooked up. My application’s logic is now embedded in how API Gateway is hooked up to Lambda. This is no longer something which is just the infrastructure. This is essential to the correct behavior of my application, is how are all these things wired up together. I think, in these architectures, it’s no longer the case that your application code and your infrastructure are separate things. They’re all very tied up together and they’re all something that’s going to have to version together in much more interesting ways.
Programming Architecture Diagrams
To give a concrete example of that, let me talk about this idea of programming architecture diagrams. I’ll show this one simple architecture diagram here. This is the kind of thing if you go to re:Invent and you go to Werner’s talk or something, and he’ll show up all these diagrams of all these AWS services and how they’re all hooked up together. You look at them all and you say, “I get what that means. I get what they’re doing. I’ll go and take that idea, and I’ll use it in my job when I get back to it.” It’s always like you see this thing and you totally get it. In this example here, I’m going to take a video, drop it in a bucket. Whenever a new file gets dropped in the bucket, I’m going to fire this Lambda. That Lambda is going to spin off some long-running ECS task that’s going to run some container that runs, in this case, Ffmpeg. Then that FFmpeg thing is going to write do a keyframe extraction and drop a JPEG into a bucket and fire off another Lambda. I can look at this and in a couple of sentences, I can describe and understand what it’s doing.
If you want to interpret this and said, “I’m going to implement it,” it suddenly gets scary. This is not easy to implement. In fact, you look at implementation of this, and it’s 500 lines of CloudFormation or so to build just the infrastructure around this. It’s a whole bunch of application delivery pipelines that I’ve got to do to make sure that those two Lambdas and that ECS task are all getting deployed and synced with my infrastructure. It’s surprisingly complicated to actually build the kinds of things that are in these architecture diagrams.
Demo
Let me show you what this thing looks like, or can look like in something like Pulumi. I’ll just show this part. I’ve collapsed a few pieces of it just so I can talk through it very briefly. This example here encodes that entire architecture diagram in a real running piece of code in just about 40 lines of code or so. You can see the various pieces of this. We’ve got a bucket that was in the architecture diagram. This is where I’m going to store my video files and my images. I’ve got this long-running Fargate task, this long-running compute piece, which is going to run FFmpeg. If I look at this, it’s actually exactly that code I had on the slide earlier. I’ve got my memoryReservation, but then I want to build whatever is here. If I go and look at that, I can see, that’s just the folder here with a Dockerfile in it. This could be my Java app, my .NET app, my GO app, whatever it is I have. In this case, it’s actually just effectively some bash that runs FFmpeg inside a container, but it can run whatever I want. It’ll actually build that image from whatever source code I have here and deploy it directly.
I can then say I have two event handlers. I have one that says, “When a new MP4 file gets placed inside this bucket, run some code.” Here, I’ve got, “When a new JPEG gets placed inside this bucket, run some code.” Probably the most complicated part of this, as is normally the case, is just the parsing and passing data back and forth between things. Here, I’ve got to parse some of the inputs that come with the image that gets uploaded, and I’ve got to pass those into the Docker container as environment variables. Effectively, all I do here is I just take that task that I had defined up here, and I run an instance of it whenever a new video gets uploaded. As soon as I’m running that, I write out a log entry, and then whenever it’s finished, when a JPEG gets uploaded by the task, I would just going to print out that it finished.
You could imagine extending this. If I wanted to have some data store that kept track of what’s running and what’s finished, I could add a new table in here and write that information in, very easy to extend this to more complicated infrastructures. The key thing here is really, just in 40 lines of code or so at the level of that architecture diagram, and we would actually develop something which represents the task at hand.
Architecture as Code
Again, Pulumi is definitely not the only tool looking at this, and in fact, the AWS CDK, which just GAed early this year, and I think there’s a talk on it next, is doing a lot of really interesting stuff here specific to AWS. We’re taking some of these patterns and making it really easy in higher-level ways to work with them at the level of the architecture, not just at the level of the individual building block services that AWS provides and really so some of this stuff that CDK is doing. In fact, the notion architecture as code, I really love this. Clare Liguori at AWS wrote a blog post recently, a really great blog post about this topic, and used this word architecture as code. I’m stealing it from her, because it’s such a good phrase to talk about turning these architecture diagrams into code.
There is one last demo I wanted to quickly show, and that’s focused on this tweet that I saw a couple of weeks ago. Someone wrote out this tweet, “I want a website that does one thing. It displays the number of times it’s been viewed. What is the shortest number of steps you can think of to get it running in the cloud?” It feels like a trick question. It’s like, “This shouldn’t be that hard. I know how to build a website that has a counter on it. Why is this a hard thing?” Actually, a lot of folks jumped on to this thread and responded with for various different tools, the steps you can go through to accomplish this. It is actually a surprisingly hard thing to do. I wanted to bring together a few of the ideas I’ve touched on here to show one of the ways with Pulumi where you can do this today. I’m going to claim I can do it 90 seconds. We’ll see if that really is true.
Demo
I just have an empty slide here, and I have that same watch thing running. I’ll just write out what I would do to build this website that has a counter. The first thing I’ll do is create a table, so I can say, new cloud.Table, and I’ll just call this counter. I hit Save and it’s going to start deploying this. Then, while it’s deploying that, I’m going to create a new API, and so this will serve my website. I want to say, api.get, so I want to route on this thing. Whenever I get the slash route, I want to run some code. For those who’ve used Express.js or something like that, this is using a similar style to that. I’ll just, res.end, and I’ll say, “Hello world!” Finally, I want to export the URL that this thing is going to be at, so, export const url = api.publish().url.
When I hit Save now, it’s actually going to go and deploy that API as well. While that’s going, I’ll actually implement the logic of this application. I can say something like const counter = await table.get, and I’ll just get the entry that’s called counter. This entry may not exist because the first time I hit this page, there’s nothing there, and so let me just seed it with n: 0. Now I’ll say await table.update, same entry, and I’ll write out n is counter.n+1. Just as a final thing, I’ll just say, Seen $(counter.n+1). Now we’re going to deploy and see that. I can say, pulumi stack output, get the URL, go visit that. Assuming that Lambda spins up quickly. It’s seen one times, two times, three times. There we go. We have a counter.
We’re just a few lines of code in Pulumi. We used that fact that we can use that watch mode to iteratively deploy this thing, and we very simply built that application. This is that experience, that developer-centric experience. If I want to be able to express my ideas very quickly in a programming environment, but deploy those into a real cloud application, I can take advantage of all the capabilities of AWS here.
The Future?
That example I just showed, I think it’s really exciting that you can do that thing. For a somewhat scenario we offer that capability with something like Pulumi. I think there’s still a ton of opportunity to take a lot of these ideas and move them further forward. I think a lot of folks are working on piecing this. There’s a few things that I have no doubt are going to be part of the future of how we work with the cloud platforms.
A few of the things that I really think about a lot, one is these frameworks on top of the raw building blocks of the cloud. You saw me using those throughout some of these demos, these higher-level things, like this cloud framework that I was using in the last demo, that are just easier to use than the raw building blocks. That doesn’t mean I won’t sometimes want to reach for the raw building blocks, just like I sometimes reach for my file system access APIs on Windows or whatever. A lot of the time, I want to use that high-level Java file system API. I don’t want to be stuck with those low-level building blocks all the time.
Another one is unifying application infrastructure code. Continually, this is going to be a trend to move these things closer together, especially as we move to more cloud-native architectures. I think we’re seeing this with serverless, we’re seeing this with Kubernetes, and I think this is going to continue to be a thing which we see more integration of these two things. That’s actually going to drive the teams integrating more, so more of this responsibility moving into development teams and development teams being able to take ownership of more of this.
This idea, I talked about these process models and this idea of this long-running cloud process. I think it’s an important way to think about this stuff and really starts to raise questions like, “What about if I need to do database migrations? I’ve got this long-running thing, how do I script those database migrations into these kinds of deployment processes?” I think there’s still a lot to be discovered around that and a lot of innovation that’s going to happen there.
Then, finally I’ve spent a bit of time talking about how important this rapid iteration is, and I really do believe that that’s one of the things, the idea that the cloud platforms feel like they’re at your fingertips. This isn’t something I have to throw over the wall to somebody else so that I can immediately see the results of what I’m doing. I think this is going to really change the way folks think about being able to work with the cloud productively.
In summary, I’d say I believe that, over the next few years, every developers end up going to be a cloud developer to some extent. Everyone is going to be touching the cloud as a part of the way that they develop and deploy their applications. I see a huge opportunity across all of these for the industry and for all of us as developers to take advantage of this.
Questions and Answers
Participant 1: Is Pulumi production ready?
Hoban: Yes. Pulumi hit 1.0 a couple of months ago, I think. I think we’ve been working on it for about two and a half years. It’s been out publicly for a little over a year and a half now. We have a lot of folks using Pulumi in production today and the core of it. A lot of these things I demoed here are things that are higher level, as we had some experimental features here. Some of what I demoed here today is definitely more on the edges of what we’re doing. The core platform, the core infrastructure’s code offering is definitely being used in production today.
Participant 2: If I want to learn more about Pulumi, where would I go?
Hoban: Pulumi.com has a ton of resources, getting started information, and a whole bunch of guides, and things like that.
Participant 3: Is Pulumi mostly integrated with AWS? All your examples were in AWS.
Hoban: It’s always a tough thing, because I want to show some continuity of what we’re doing, and so I did focus on AWS here. Pulumi is equally accessible across AWS, Azure, GCP, Kubernetes, a variety of other cloud providers. To some extent, everything I showed here is something you could do on those other platforms as well. AWS is probably where the single-largest user base of Pulumi is, but there’s large user bases across the rest of those as well.
Participant 4: How do you account for in large teams of the state management and the infrastructure drift?
Hoban: Infrastructure drift thing often is, somebody else on the team is going behind the scenes of the infrastructure’s code and changing something in the console or deploying something from their laptop that wasn’t actually checked into the main codebase or something. Pulumi has a bunch of features to deal with that. It has a Pulumi refresh which goes and make sure the state matches what’s actually in the cloud provider. You got tools like to go to import existing resources from the cloud if you’ve got things that are out there that you want to bring into your environment but you don’t want to have to recreate. There’s a whole bunch of tools, there are some operational tools around dealing with this thing.
You can also do things like catch; in your preview, you can see whether the changes are something you’re going to actually expect to happen. I focused a lot onto that inner-loop experience, which is a bit different. When folks think about infrastructure’s code, I think they more think about this thing. They think about the operations for running this stuff in their production environment. Pulumi definitely has the full toolset for that use case as well. Today, I really wanted to focus on the other side, which I don’t think gets as much attention, which is how do we make this stuff more accessible to developers, but it’s certainly for this production environment. There are a bunch of these tools to make sure you can robustly manage a production environment.
Participant 5: Which programming languages are supported? Second part of the question is, where is the state being stored?
Hoban: Today, we support JavaScript and TypeScript. We support Python. Actually, just today, we launched and previewed .NET support, so C#, F#, and Bb. GO and Java are on our near-term roadmap. That’s the core languages we have today. We’re going to continue to expand our language coverage. On the state question, there’s a free tier of a Pulumi service backend which you can use, so you don’t have to worry about state at all out of the box. It just gets managed by the Pulumi service itself. If you want to manage it locally on your machine or in S3 or Azure Blob Storage or whatever, those options are available as well. You can just log into whatever backend you’d want to use to store the state. We try and make that something that most users of Pulumi don’t even have to think about, but if you don’t want to trust those files to go up to Pulumi, you can take it yourself.
Participant 6: What does it look like when you’re deploying to multiple environments with something like Pulumi? I’m developing locally, I have the fast feedback loop, but then, when I’m ready to commit it and push it to my test environment or production, what does that look like? What’s the model for that?
Hoban: I focused a lot on some of that very inner-loop phase and during that development cycle. In that phase, you don’t care so much about the infrastructure. If you break everything, it’s ok; you throw it all away, you start a new one, just like you would if you’re developing your application locally and something goes wrong. You just kill the process, deploy again. When you’re moving it into a robust test environment or ultimately into a production environment, that phase, you’re typically going to put that into some CI/CD system. Pulumi can be added into a variety of different CI/CD systems. Then you’ll deploy. Every time you push or every time you go through some gated deployment process, you’ll actually go and do that Pulumi deployment. Potentially, when you open a PR, you’ll do a preview of what change would happen if you merge that PR. Then, when you merge it, we’ll actually push that into the environment it’s being mapped.
There’s a lot of different techniques you can use there, but one that we’ve seen is just mapping branches in your source control into environments to have branch as your testing environment, a branch as your production environment. As you merge bits through those different branches, it’ll actually merge them into that environment in your production infrastructure. That’s something largely you can just script yourself using your existing CI/CD tools, in the same way that you might script CloudFormation or Terraform. Pulumi, itself, does offer some features in that service that help with that.
Participant 7: With respect to AWS, how rich is the library support? Does it support all the resources, are you guys working through it? Or does it support most commonly used?
Hoban: Pulumi, itself, has a support. We project the libraries for AWS, Azure, GCP, Kubernetes, everything. We project the full API surface area of those into the Pulumi programming model. Everything is available there in the raw form. Some of the higher-level libraries I used here, like these cloud things, those are much more limited today, and we have some higher-level libraries in some limited domains, in the serverless domain, in the ECS domain, and a few others. That’s something that we continue to expand those higher-level libraries. We’re looking at doing things around RDS. There’s a lot of interesting things we can do to simplify the way that you work with databases in AWS. That’s something that, as we work with folks in the community and customers and things, we’ll continue to expand those higher-level libraries to cover more cases.
See more presentations with transcripts
MMS • Rafiq Gemmail
Article originally posted on InfoQ. Visit InfoQ
InfoQ recently published the video of a talk given at AgileAus 2019, titled “The Evolution of the Agile Coach” by Spotify’s Erin McManus, and Fiona Siseman. McManus, an engineering manager, and her colleague Siseman, a coaching manager, discussed how the role, needs and competencies of an Agile coach differ between established Agile cultures such as Spotify’s, and those organisations still undergoing a transformation. They shared how Spotify produces “full-stack coaches” who are as comfortable coaching continuous improvement at the enterprise level as with teams and individuals. Similarly, Shane Hastie, InfoQ editor and ICAgile’s director of learning, has also recently written about the competencies and the learning path of a coach working towards the prestigious and peer validated ICAgile Certified Expert in Agile Coaching. The learning journey of a coach is ongoing and requires a breadth of skills to serve those being coached.
A 2019 academic study by Gisela Bäcklander titled “Doing complexity leadership theory: How agile coaches at Spotify practise enabling leadership” describes six principles which Spotify coaches adhere to in order to achieve their goal of “building high performing teams and a high performing organisation.” McManus and Siseman explained these six principles.
- Establishing and reinforcing simple principles: This the “why are we doing” rather than “what we’re doing,” explained Siseman. This activity also includes coaching an action bias and encouraging high-bandwidth communication, like jumping on hangouts, for more effective communication.
- Increasing Context Sensitivity: McManus shared how they help teams become aware of their context. She gave the example of coaching teams to help them to think about how the things they are doing can affect other teams, as well as the tribe and mission goals.
- Observing and Influencing Group Dynamics: Siseman said that Spotify coaches use their “experience to judge whether action is needed or not.” She pointed out that “just a coach inserting themselves into a conversation can change the team dynamic and change the conversation.” Siseman shared that she will “prioritise the best learning for the team in that moment.”
- Making the Unseen Visible: McManus described coaching to help teams become aware of actions not aligned with their goals. She described this further, saying that “coaches make those situations more apparent and therefore easier to address, by choosing questions and playing back situations.”
- Boosting and Supporting other leaders: Siseman shared how they help grow existing leaders. Examples included book clubs for product owners and teaching “engineering managers individual coaching skills to use with their direct reports.”
- Facilitating and encouraging positive dialogue: McManus shared that as a coach, they do this by “being present and engaged and listening to the dialogue in the moment.” She asks questions such as, “Is everyone contributing in this moment? Is everyone being heard? Are they interacting in a respectful way?” McManus said that “if any of these things aren’t in place, then we gently redirect the conversation back to where those things are happening.”
McManus and Siseman shared how Spotify coaches have managers who support them by investing in understanding the role of a coach. They explained as full-stack coaches that they wear multiple hats which range from facilitation and team coaching, to being agents for organisational change themselves.
Hastie, who himself is an ICAgile Certified Expert in Agile Coaching, described the start of the coaching journey as one where a coach’s core skills align with the ACI Coaching Framework.
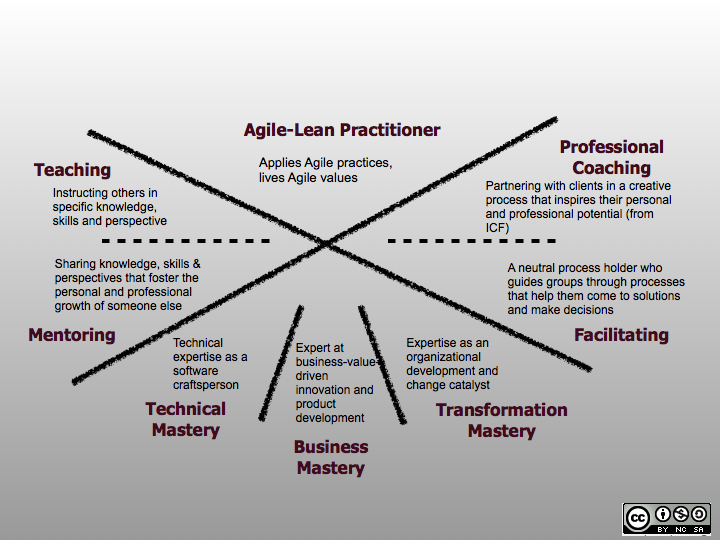
This ACI Agile Coach Competency Framework specifies several areas in which a coach should build their competencies:
- Being an agile practitioner, Hastie explains that the Agile coach must have a deep understanding of the “why?” He wrote that “they need to be able to lead by example and show the teams under their guidance what it means to be agile in their way of thinking and working.”
- Teaching is a competency which enables the coach to “teach people new skills, and they must be able to do so effectively.” Hastie writes that there are multiple styles of teaching in which to acquire improvement, “formal or informal, in a classroom with a large group or in a conversation with a single individual.”
- Professional coaching is a discipline in its own right, for which the coach requires competence. Hastie writes “coaches honour the client as the expert in his or her life and work and believe every client is creative, resourceful and whole.”
- Technical, Business, and Transformation Mastery are examples of domains where the coach should have the deep mastery to support and mentor within their organisations and coachees. Hastie wrote that coaches “must be able to demonstrate deep knowledge and real mastery in a domain and have a working knowledge of the other two.”
Sharing his own personal journey during a talk for London’s Adventures with Agile community in 2019, Hastie provided more depth on the relationship between coach and coachee:
Establishing trust is a vitally important skill set of a coach. Because you’re asking people to expose their uncertainties, their questions. The things they are struggling with. You are guiding them on a journey. Being present. Being fully engaged with the coachee at all times.
Hastie talked about how “you will have different coaches for different aspects of your practice.” Using himself as an example, he talked about the accountability which comes with knowing your own limitations:
I am an Agile coach. I might have a specific skillset I’m bringing and I’m good at coaching you in that area. One of the things I have to know as a coach is where I’m not good. And when to suggest there is someone else who can help there. That’s about accountability. It’s not an all care, no responsibility position.
McManus spoke about how coaches provide incremental value which is not always visible at first sight:
Coaching in an agile organisation delivers incremental value. That incremental value is harder to see. So it is really important to be clear about what it is and why it’s valued.
MMS • Christie Wilson
Article originally posted on InfoQ. Visit InfoQ
Transcript
Wilson: I’m Christie Wilson, I am a software engineer and I lead the Tekton project at Google. Throughout my career, I’ve worked on a lot of different stuff. I’ve worked on AAA games for a really long time, I worked on mobile, I’ve worked on foreign currency exchange, but somehow no matter what I work on, I always end up gravitating towards working on CI/CD. I think it’s because it’s everywhere, everybody needs it, but there’s also always so much opportunity to make it better and I think that’s particularly true with cloud native technologies today.
What I want to talk to you about is how cloud native CI/CD can make it easier for all of us to make mistakes. Sometimes, as engineers, it feels like we’re not supposed to make any mistakes. We even have special terms for the engineers who don’t make mistakes, we call them rock stars, we call them ninjas, we call them heroes. I remember once discussing a hiring decision with my manager and he said, “We were looking for a golden unicorn.” I still don’t know how to interview for a golden unicorn. Who invented Flaming Hot Cheetos? It was a janitor. You never know who’s going to have the really good ideas or who’s going to make the biggest changes or who has the potential to but can’t because we’ve told them that they can’t make any mistakes.
It turns out that you can’t succeed without failing. Every success is built on all of the mistakes and failures that came before it. If you think about how science works, every successful scientific theory was built on the top of a whole bunch of disproven theories that came before it. If you want to succeed, you have to be able to fail.
What I want to convince you of today is that in 2019, we really need to raise the bar on how our CI/CD systems help make it cheap and easy for us to make mistakes and fail and how they can make it easier for us to deal with all of growing complexity that comes with cloud native.
This is an overview of where we’re going today. We’re going to start by laying the groundwork so we’re all on the same page about cloud native. Then, we’re going to talk about what cloud native CI/CD should be. From there, we’ll talk a little bit about shifting left and what that means in this context. Then, I’m going to talk about the open source project that I work on, Tekton, and give you a little demo and finish up with what’s next for Tekton.
What Is Cloud Native?
I’m going to start with some broad definitions. I’m not going to go into a lot of detail, but first, what is cloud native? If you ask five different people to define it, I think they’re all going to say something slightly different. This is an attempt to break down the CNCF, Cloud Native Computing Foundations, definition of cloud native. It’s microservices that running containers, the containers are dynamically orchestrated to optimize resource utilization. For a lot of us, what this ends up meaning is that we are running containers on Kubernetes. That is not the only way to be cloud native, it’s just how a lot of us are doing it and it’s the context that I’m going to be assuming for this talk.
You package your software and images and then you use Kubernetes to manage the execution of the images. Even if you’re not familiar with those terms, just hang on, because I’m going to give you some very broad definitions that can help you at least maybe not use them tomorrow, but at least understand what I’m talking about in the rest of this.
What is an image? What’s the container? An image is a binary with all of the dependencies that it needs to run. When you run the image, you call it a container. Containers all run using the same operating system but they run as isolated processes. That means you can do something like docker run your image and it just runs, where the equivalent without images and containers is that you have to install all the dependencies first and then maybe you have to use something like Python to actually invoke the thing you’re trying to run.
Then, what do you do when you have a lot of images? That’s where Kubernetes comes in. Kubernetes lets you orchestrate running a whole bunch of different containers and then even better than that, it also lets you not worry about the hardware that they’re running on. You can say something like, “This image needs this much memory,” and Kubernetes will just run it and you don’t have to really know where it ends up. The non-cloud native equivalent of this is actually like a lot of different things. It could be an entire team of people who know how your data center works, they know where the configuration lives, they know how to configure your pod, there’s maybe a bunch of Wikis that explain how everything works, all of that bundled together is what Kubernetes gives you.
Now, I’m going to go over a few Kubernetes things that you might hear me mention. Two of the most common Kubernetes abstractions you’ll encounter are node and pod. A node is the machine that you actually run stuff on; it could be a physical machine or it could be a VM. Then, a pod is something that doesn’t really exist outside of Kubernetes. It doesn’t directly map to anything, it’s just logically a bunch of stuff you want to run together or a bunch of containers. They all run on the same node, though, so they all have access to the same disk, so pods run on nodes.
Lastly, I want to give you a heads up, but I’m going to mention YAML a lot. You may know what YAML is already, but if you haven’t worked with it, you might wonder why I’m going to mention it so many times. If you have used cloud native, you’ll know that YAML is the configuration language for cloud native software, I don’t know why. Everybody loves to hate it but anyways, there’s a lot of it.
Something you might get a sense of already is that there is a lot going on here and it’s fairly complicated. It’s more complicated than what we were doing before. To try to prove that to you, I want to tell you about the first software system that I ever worked on professionally. Everything was written in Perl, it use the model view controller framework, which I remember being intimidated by at first, and it connected to two servers. There was a user server that held data about users and there was a MySQL database that I could actually run on my own machine.
I don’t even know how releasing that software worked, that was not part of my life at all. What was part of my life was connecting to live production servers to try to debug problems, which was scary. I remember once somebody sitting next to me had a cold and he dropped a Kleenex box on his keyboard and he dropped a table in production. That’s what he said happened, I think he just made a mistake. It was a time when things were scary, they were risky, but they weren’t really that complicated.
Now, what the cloud native applications look like? One application could be made of a whole bunch of different microservices, all those microservices might be written in different languages. To deploy them to a system like Kubernetes, you have to understand how things like pods work and how to configure them. Then, when you start growing all this configuration, you start applying templating to it to try to make it simpler, then you need the services to actually be able to find and discover and connect to each other and it just keeps going. This means that you could start off trying to make a web server and suddenly before you know it, you’re deploying and managing Kubernetes, Knative, Istio, Helm, Spinnaker. It just keeps going and it is a lot to keep up with and it’s constantly changing.
What Is Cloud Native CI/CD?
That might be a little bit of a downer but what I want to do is look at why that complexity is all worth it and I think one reason is because it can give us cloud native CI/CD. First, when we say CI/CD, what do we mean? I was thinking for a long time about what it actually means, Continuous Integration and Continuous Delivery. I think it’s fairly easy to intuitively guess what continuous delivery is because you’re delivering something, it’s like how you publish your images or your binaries or you deploy to production.
What does it mean to actually integrate continuously? It’s literally about taking code changes and putting them together frequently so you make sure that they work. It’s the opposite of the time in university when I was working with another student on a project and we both had one half of the project and then we waited until 8:00 p.m. the night before it was due to put the two halves together. They did not work, that was a bad night.
These days, the term continuous integration has grown beyond that to also include the fact that we are applying automated testing along the way to make sure things actually work.
It’s a critical part of your software supply chain. You could even view it as maybe the conveyor belt that moves all of your artifacts through the supply chain, building them, testing them, deploying them, and then ultimately getting them safely into production.
Is that what cloud native CI/CD looks like? Yes, but we just talked about how complicated cloud native is, so does that mean that it’s more complicated? Maybe, but it is worth it because of what it can give us. This is what cloud native CI/CD should look like. It should be serverless, it should be built on open specifications and standards, the stuff that we build with those standards should be reusable, we should be able to run it wherever we want to, and we should treat it with the same software best practices that we treat the rest of our code.
Let’s break that down a little bit, starting with what it means for it to be serverless. This is another term that has a lot of interpretations. When I’m saying serverless in this context, I’m talking about the fact that you can run your workloads and scale them up and down without having to be too involved in the process.
If you’re running on prem, then when you want to run something, you have to know that there’s an actual physical machine behind it that you’re going to run it on. When you use the cloud, you don’t have to worry about that and you can request resources when you need them. You shouldn’t have to worry about what operating system is running on that machine, what version of the kernel is installed. Serverless here means that all of that is taken care of for you, which has some pretty dramatic implications for CI because if you have been using any of the CI systems that have existed up until this point, you know that a lot of them have two main ways that they’re designed.
Either they have the extra complexity of having some like master and a whole bunch of worker nodes that that master has to manage and distribute work to and communicate with. Or, more likely, there’s just one master and that’s where everything is executed, which means that if you have a bunch of teams all executing stuff on that master, they can actually interfere with each other, jobs can cause other jobs to fail, they can starve each other. With cloud native CI, if it’s serverless, then we can avoid all of that and we can just scale things up and down as we need them and run them in isolation.
Why open specifications and standards? In my opinion, Kubernetes is pretty cool on its own but what I really like about it is all of the standards that it defines. If I’m deploying to a Kubernetes-based system, then I know that a pod is a pod. I know that if a container is going to run, it’s going to be inside a pod. I know what a pod looks like, I know what attributes it has and all the Kubernetes configuration is declarable and extensible. This means that if you build a system on top of Kubernetes, then you don’t actually have to give me an explicit plugin mechanism because Kubernetes itself does. Kubernetes provides ways for me to hook into the lifecycle of a pod and actually make changes to it before it runs, so it’s this platform of infinite extensibility without you as the platform developer having to worry about it. This is how systems like Istio work and even better, if you’re building on Kubernetes, then I can use all of my favorite Kubernetes tools to interact with it.
That brings us to the next thing that cloud native CI/CD should give us, which is reusable components. If we do the same thing as Kubernetes and we build on standards, then we can start sharing and reusing what we’re building. This means that we shouldn’t have to keep writing the same Slack notification plugin over and over again, we should be able to just write it once and then everybody can use it. Then, everybody can focus on this stuff that actually gives their company business value. If we build our CI systems like this, this means we should be able to mix and match pieces of them and we should never have to get locked into any particular CI vendor.
Now, let’s finally settle the question of how to have parity between our development and our test systems and production. If you’re using Kubernetes, a pod is a pod is a pod. If you can deploy to production Kubernetes, then there should be some way that you can get a hold of the configuration that was used for that and with a few tweaks, you can run it yourself on your own cluster. For the first couple years of one of my jobs, everybody on my team developed against the same instance of one of our key services. It ran on my manager’s VM because he was the only person who ever managed to get it running a couple of years before that, because no matter how much time the rest of us spent going through the Wiki page that was supposed to describe how to set it up, it just never worked.
This is a different problem now. It’s a matter of, “How do I get a copy of the YAML configuration and which values can I change safely without losing anything?” Compared to what it used to be, which was, “What version of what operating system should be installed? Did I install the right version of this package?” All of that. This is one of the things that makes all the extra complexity of Kubernetes really worth it. Sure, it is really painful to actually have to write all this configuration but once you do, it will work and then you can use it again and again. Suddenly, in the images and the config, you have everything you need to make the same production cluster every time.
Speaking of writing everything down, let’s treat our CI/CD configuration the same way that we treat the rest of our code. Maybe we don’t like YAML, but when I work with systems that are configured using it and I want to know how they work, I can actually look at the configuration. I don’t like it, but it’s there. I don’t have to attach myself to a running process and inspect the system calls to see what’s actually going on, I can just look at the configuration.
As our systems grow more complicated, it’s really important that everybody who’s interacting with them be able to understand what they’re doing and look at how they’re configured. To bring this back to the idea that we started with, that we should make failure as easy as possible, when things do go wrong, it’s really important that all the people involved be able to actually look at what’s happening and debug it.
It turns out, the debugging is all about learning. If you already knew how something worked, you wouldn’t have to debug it, you would just know what the problem was. Debugging is an act of gaining new knowledge, it’s a kind of learning. The better you are at learning, the more effective you can be and the faster you can deliver value as an engineer.
I really liked this tweet, “The most important skill to have as a programmer is the ability to teach yourself new things effectively and efficiently. You’re going to be constantly growing and picking up new technologies. The ability to do that is more important than any individual tool or technology.” I think what Ali Spittel is saying there is that the ability to teach yourself new stuff is maybe the best skill that you can have, especially as movements like cloud native make engineering more and more complicated. Chances are it’s only going to get worse from here but if you can learn, if you can debug, then you can keep up.
How do we debug? We debug by looking at something, by reading it, by trying to understand it, by making little changes and tweaking it and seeing what happens. I once went to a lightning talk where the speaker advocated for being a trash panda, which if you’re not familiar, is another name for a raccoon. The idea was that you can learn a lot by just digging through all of the data that’s available to you. This is the main way that I learned when I started on a new project. Once I need to go beyond the documentation that’s there, I start looking for the CI configuration, for the Docker files, for the scripts that actually run the thing because I want to see how it works.
What Is Shifting Left?
Those were the attributes of cloud native CI/CD. Why I’m so excited about this is because it makes it so that even though we have all this extra complexity, we can shift left. How many people feel familiar with what shift left means? Ok, not too many people. Who feels like they’re actually doing it? A couple. If you’re already sold on this, which is actually maybe not too many people, you can just feel really good during this next part. If this is new for you, then I am so excited to introduce you to it because this will save you actual money.
This is what software development used to look like and still looks like. You start with some requirements. Hopefully, a lot of the time, you don’t even have the requirements. You design something, you implement it, then you test it. This could be the person who wrote the software testing it or a QA person or a QA department or some mix and then you deploy it to production.
You even see this a lot when you see how people are breaking down work for themselves into issues. You’ll see an issue that’s like, “Implement the thing,” and then they write another issue, “Test it.” There’s some big problems with this and one of them is about how expensive it is to fix a problem depending on where you find it. It turns out it’s way cheaper to fix problems if you find them before they get into production. This isn’t even accounting for money you might lose because of the bug itself, this is just because you have to redo all the previous work. You have to get the thing out of production. Obviously, you didn’t test something right so you have to fix that. You have to fix the implementation, maybe there’s something wrong in the design and the requirements that you have to revisit, it’s really expensive. If you find the problem while you’re working on it, then it’s cheap and fast to fix.
This is where shift left comes in. It’s moving left in that whole workflow and testing earlier in the cycle. Ideally, you’re even doing some form of testing before you write the code but definitely way before anything gets to production. Part of shifting left is changing the shape of what our software development workflow looks like. Suddenly, design, development, and testing are not quite as distinctive phases, they’re all happening at once constantly. Shift left assumes that there will be problems, but the sooner you find them, the cheaper and easier you can fix them. If CI/CD helps us find failures and shift left says we should find them earlier, then I think that CI/CD should help you find failures earlier.
We started looking at cloud native and how it can be more complicated. What does this mean for shifting left? It means that if we don’t have cloud native CI/CD, if you can’t have CI/CD that serverless, infrastructure agnostic, config as code, then people are just going to give up and test in production. Or, they’re going to create giant staging environments that everybody has to deploy to and test against before it gets to production. This would be a huge step back for shifting left, so that’s why we need cloud native CI/CD.
What is Tekton?
Now let’s talk about a project that’s all about making cloud native CI/CD happen. It’s Tekton. This is the project that I work on. I’ve working on it for the past year and I just get more and more excited about it all the time, not just because it has an awesome cat logo, but because it is cloud native CI/CD. All this stuff I was talking about up until this point, this is all at the heart of how he designed Tekton. Even better, it’s not just open source. Earlier this year, we actually donated it to a new foundation called The Continuous Delivery Foundation, or CDF. The CDF is all about working in the open to take continuous delivery and the continuous integration that comes before that into the future. Tekton itself is being created with a bunch of different companies. We work with CloudBees, Red Hat, Salesforce, IBM, Puppet, and more. Ok, so what is CI/CD?
Who is familiar with the term, “The porcelain versus the plumbing?” The idea is, if you were looking for a toilet and you just found the plumbing that was underneath it, then you’d be really sad because you actually need the porcelain of the bowl and all of that user interface on top of it to use it. You need the plumbing to make it work, so you need both but you can’t have just one of them.
In this case, Tekton is the plumbing, it is not the porcelain. If it’s the plumbing, then what users is it good for? It’s perfect for people who are building their own CI/CD systems. This could be people who are making CI/CD products like Jenkins X, or it could be teams that exist in companies where you have to deal with whatever your company’s particular CI/CD needs are and make that work. It’s also great if you just want to have a really custom setup. In the future, we want to provide a catalogue of really high quality, well-tested tasks or components that you can use in your own CI/CD systems, but that’s something that we’re working on early next year so I would say that we’re not quite there yet.
How does Tekton work? Let’s do a quick overview. First, I need to introduce you to one more Kubernetes concept. This is something called the CRD, or a Custom Resource. Out of the box, Kubernetes comes with resources like the pods that we were discussing before but it also lets you define your own. You define the specification for these resources and then you create a binary called the controller that makes them actually happen. Let’s look at the CRDs that Tekton has. The most basic building block is called a Step. A Step is an image or a container, it’s the image and the arguments and the environment variables and all this stuff that you need to make it run.
For our first new type, we created something called a Task. A Task puts together Containers or Steps and lets you execute them in order. So, a Task execute Steps in the order you declare them in and they all run on the same node, so they all have access to the same disk. You can combine Tasks into another new type called the Pipeline. A Pipeline lets you put the tests in any order you want so they can run sequentially, they can run concurrently, you can create really complicated graphs. They all run on different nodes but you can have outputs from one Task that are passed as inputs to another task.
Those two are the basic two pieces, the Tasks and the Pipeline. You define those once and then you use them again and again. To actually invoke them, you create something we call Runs, so there are TaskRuns and PipelineRuns, which run tasks and pipelines. Then, at runtime, we provide them with data, which is our last new type of PipelineResource. Ok, so there are five types. There are Tasks that are made steps, there are Pipelines that are made of Tasks, and then you actually run those with TaskRuns and PipelineRuns, and you provide them with data with PipelineResources.
As a quick aside, I’m really skimming over this but one of the cool things about using PipelineResources to represent your data is that it gives you typing throughout your CI/CD system because, like an example of a PipelineResource, might be an image that you’ve built, or it might be the Git source code at some particular commit. This gives us increased visibility because we can start looking at these artifacts as they move through the software supply chain.
The next thing you might ask is, “Ok, I get that, I see that if I want to run a Pipeline, I have to make a PipelineRun, but how do I do that? What if I want to, say, every time you open a pull request against this Git repo, I want to run a pipeline?” That is where our newest project comes in. It’s called Tekton Triggers and we just had our first release. I won’t go into too much detail, but Tekton Triggers has a bunch of CRDs that let you express how to create a PipelineRun from an event so you could do something like, take a particular Git commit and then you can run a Pipeline against it.
This is why that is all worth it, though. This is how Tekton provides cloud native CI/CD. Everything is serverless. Besides those controller binaries, nothing is actually running until you need it to run. The Tekton API is a set of specifications that any CI/CD system can conform to. Because we’re building this all from containers, wherever you run a container, you can run Tekton. Lastly, with all those types that we looked at, these are components that can be reusable that you can define and commit right alongside your code.
Demo!
Speaking of config as code, I’m going to give you a quick demo of how that can work with Tekton and how we can use it to debug. This is pretty exciting. I think I spend most of the time preparing for this talk trying to get this demo to work, so fingers crossed. What we’re going to do is we are going to take my beautiful catservice, this is my catservice. It has information about my cat. She’s really old and she is grouchy. Let’s say that I was a new contributor to the catservice. The code lives here in GitHub and let’s say, as a new contributor, I don’t know how the whole process works but I just have some changes that I want to make, so I’m just going to go for it. What I am going to do is, this is the source code that I checked out, I’m going to make some changes. When I’m changing it, I change the image.
I realized that there’s calculation that’s happening. You’re going to learn a lot about cats right now because I like cats quite a lot. It’s converting a cat’s age in human years to cat years and there’s a really complicated equation that I’m using here and I feel like it’s not right. This cat is 17 years old, that’s got to be way older than 55 cat years. I don’t really care, I’m going to delete all of this. I’m going to return something that I think is more reasonable, so every year is seven years.
I’m going to commit this and pick a branch. These are all my changes. I’m going to push my branch and I’m, “You definitely want my changes.” I’m not really being the best contributor since I didn’t really have a very descriptive commit message and also, I just wiped out some stuff. New branch, make_it_better. Open my pull request, there we go. I create my pull request and then, as soon as I create this, Tekton is going to kick off and start doing something but I don’t know what because I’m just a new contributor. What I can do is I can actually start poking around and I know that this Tekton folder here has all the configuration for all the CI in it.
Let’s say I’m looking at this and I can actually take a look at exactly the Tasks that are running and the Pipelines and I can even run them myself if I want to. I can take exactly these commands and I can run them against my own cluster, so I can apply these to my Tekton instance that’s running in my Kubernetes cluster. Let’s see, how is this going? Still running. “Configured, configured,” ok, so I applied all that in my cluster. Ok, so the test failed, I’m not really sure why. One way that I can investigate that, though, is I can actually run that whole same Pipeline myself in my own cluster.
I applied all the configuration for it and I’m going to use the Tekton command line tool to start the Pipeline and is going to run against this particular commit that I made here. Time for some magic, copying and pasting. I need one of those PipelineResources that I mentioned, so I’m going to make new ones, it’s going to be “my-branch.” Then this is where my code lives, a little bit of that there, and what revision am I going to run it against. I’m going to run it against this revision.
Now, at once, this “pullRequest resource,” but it doesn’t matter because we’re not going to update the pull request. Ok, now it’s running. What I mentioned earlier was that you should be able to use all the same tools that you use for your regular Kubernetes stuff against something that’s built on Kubernetes, so let’s take a look at how that could look. I’m falling the logs up above but meanwhile, I can still investigate this with Kubernetes, I can get pipelinerun, get this pipeline run. There it is, I can start looking into the nitty-gritty of it and there is a pod underneath that’s being run.
If you’ve used Kubernetes before to get logs, you have to get the logs from the pod, so I can do something like “logs” and that’s the pod, but I need to know exactly what container I ran so I can grab the container and there’s going to be some logs from that. Anyways, this shows that you can use the Kubernetes tool against it but meanwhile, we’ve got these other tools that are built at a higher level that make it easier to interact with. Actually, look at that, there’s a test that’s failing right here and I’m able to reproduce that and I can actually see exactly the command that’s being run.
I’m thinking that maybe if I actually run this locally, I’ve got the same failure. It turns out in cat_test.go, there is some tests that I didn’t realize existed, so I can open that up, I can fix it. Let’s see, human years got 61 expected. Yes, these are totally inaccurate, that’s way older in human years. I can fix all of those and then I can fix that. Then we’re going to get that over here and the checks are going to get kicked off again. Meanwhile, I could start investigating what was actually happening. I started this pipeline, I can go and look at the configuration for that pipeline, I can start seeing exactly what’s happening.
There’s a unit-test task, I could go look at the unit-test task. If I can stall longer, I could actually merge this as well. Then it’ll kick off another pipeline, which will actually do a canary deployment with Istio. What’s cool about that is that I don’t need to know anything about Istio to make that happen, but if I did want to know about Istio, then I could actually start investigating the deployment pipeline and I could start seeing what it’s doing and I can even use that as a way to learn about how Istio does canary deployments.
Now that other pipeline is kicked off and maybe if we come back later, what we would see is that this year will be different and the image will be different, but that’ll probably take too long so I’m just going to go back to the presentation now.
What did we see? We saw the configuration for the CI/CD system living right alongside the code. I was able to take that same configuration and run it on my cluster. I could use Kubernetes tools to interact with it, which means that somebody who wanted to could build something else on top of this if they didn’t like that CLI – which is awesome, though, it’s an awesome CLI – they could build their own. It was reproducible and everything was executed in the serverless manner.
What’s Next for Tekton?
Last, what’s next for Tekton? We are really excited that we just had our first release of Tekton Triggers and one of the reasons we were excited is because we were able to start using it immediately, so now we are actually dogfooding it and testing Tekton with Tekton, which is pretty cool. Early next year, we are hoping to have our beta release and as mentioned before, we’re going to be focusing a lot on the catalog so you should be able to go to our Tekton catalog and see a whole bunch of tasks that you can use for common stuff that you want to do in your CI/CD and we’re going to add other features like manual approvals and notifications.
If you like that, please join us. We have a Slack you can join, we have weekly community meetings, a whole bunch of the maintainers are going to be at Kubecon next week, we’ll be at the actual event itself, and there is a CDF Summit happening the day before Kubecon, and you can follow tectoncd on Twitter.
Questions and Answers
Participant 1: I’ve looked at some of these, like Drone and other ones, and one of the fallbacks that we really liked about Jenkins was seeing all my latest test results, test result trends, build artifacts all in one place. How does that work in Tekton?
Wilson: I think what I showed you would probably be not the optimal user experience. My integration with the GitHub status check was extremely fast. There should have been like a link there I should have able to click and then go to some log somewhere. I think that one of the easy short answers is there is a dashboard project in Tekton, so you could be running this dashboard alongside your Tekton installation and that should give you visibility into logs and what’s actually executed.
The other explanation, though, is as it is more of a plumbing piece, it would be up to whoever was creating their own CI system to take those logs and do what they want with them. If I was running this on GKE, for example, all the logs automatically go to Stackdriver. So you could use something that integrates with Stackdriver, or you can run something like Fluentd or something that collects logs. Basically, because it’s Kubernetes, you can attach anything that collect logs onto it and then put the logs wherever you want.
We’re not opinionated about how you get those logs but you can get the logs and put them somewhere that you want. Then, you can probably look at other systems that are built on top of Tekton that have more out of the box solutions. Jenkins X is an example of a system that’s built on Tekton, so they’re getting all the logs somewhere.
Participant 2: You mentioned this shift in left things, but the last few years three years on Kubecon, there was this team testing in production. What your opinion on that? Do you think they’re crazy or…?
Wilson: I think it depends on how you define testing in production. I think the idea is you want to find everything you can possibly find before you get to production if you can, because once it’s in production, you’re going to expose some user to it. Then there’s a certain amount that you can’t ever get to and that’s where things like monitoring and having canary rollouts and A/B testing – the testing can also take all kinds of different forms because it could be like, “I’m testing the requirements because I want to see if the users actually like this thing.” There is a certain amount you have to do in production and that’s fine, but I do think you want to do as much as you can earlier if at all possible.
Participant 2: There’s another thing I didn’t see. Every time I build this CI/CD system, I always make sure there is this “Oh, crap” button because if something bad got in production, you can just go and press one button and go back to how it was before.
Wilson: Like a rollback thing?
Participant 2: Like a rollback. If you deployed the whole pipeline, you have to go back to dependencies and put everything back to how it was before the pipeline.
Wilson: I would say that Tekton is very focused on the CI side of things and less on the CD. That’s another thing that we would hope to tackle but we don’t have any clear roadmap there. I think other tools that have more awareness of what is the thing that you deployed and “How do I undo that?” would be better.
Participant 2: There’s a tool called GoCD from ThoughtWorks that’s very good at tracking this and putting things back.
Participant 3: Another question is, you showed a folder with a bunch of configuration and it’s easy for you to find a particular project. What if I have a lot of Git repos, is there a way that I can share those things across all that repos? Is there a complicated code?
Wilson: The question is, is there a way that if I have a lot of configuration and I want to share it across a lot of Git repos, is there a way that I can share that? At the moment, you would have to copy and paste them which is not fantastic, which is what we’re doing inside of Tekton, but there’s a proposal right now to add a new CRD type, it’s like a catalog, so you could point at a catalog of tasks and they all get imported into your cluster.
Then another idea that we’ve had is, instead of saying the name of a task, you would say the URL where it’s located, so then every time you tried to run something, it would grab it from that URL. I think the reason we don’t have that right away is we’re trying to be very careful about making sure that when you do look at the configuration, you can see exactly what ran and making sure it’s reproducible but you will see something cool around that, actually.
Participant 3: Then also, what about security concerns like developers that insert malicious things into your pipeline?
Wilson: Because it is committed as code there, it would have to actually get committed and reviewed before it would actually execute.
Participant 3: Also, you kick off the pull request, which mean it kicks off the pipeline. Would it kickoff [inaudible 00:39:47] in that pipeline?
Wilson: You’re asking, what if some random person came along and just put something into your pipeline and then open the pull request and it kicks off the pipeline? The answer that most systems end up having is usually have some way of being aware of who opened the pull request and if you’re in the organization. This all comes comes into the triggering portion where you would want to have some decision that’s like, “If this person who opened the pull request is a member of my organization, then kick off the pull request.” If not, you wait for somebody who is in the organization to indicate that it’s ok to run the tests, which is like the testing for Kubernetes itself does. There’s like an ok to test command, you add it as a comment into a pull request and that kicks the whole thing off, so you probably want something like that.
Participant 4: Are there any capabilities related to test impact analysis so you can figure out that you don’t have to withdraw certain stages of the build?
Wilson: I would say there’s nothing like that right now but you could build that in if you want it, you could have a task that does that.
Participant 5: Are you only going to be pushing like other cloud native people? What I think of cloud native is more like Lambda, so serverless stuff where you don’t even have containers so you can just, “Deploy to this.” Any support for that type of deployment? Amazon have Lambdas, Google, I think they have Function.
Wilson: Cloud Run in Knative, yes.
Participant 5: Yes, everybody has those. There are containers somewhere underneath but you’re not aware of that.
Wilson: I think that a lot of those are about going from some particular source code to just running it?
Participant 5: Yes, but there is the cloud infrastructure that just makes the containers and boots them and handles it but as a developer, you never just give them the YAML file.
Wilson: There’s nothing like that in Tekton itself. One thing that you might find interesting is Tekton started off as Knative Build, which was part of the KNative Project. Knative is an open source serverless platform built on top of Kubernetes and in order for it to be able to go from source to deployment, it was using this thing called Knative Build which would take your source code and then build it into an image which would then be what ran. Then these days, they’ve deprecated KNative Build in favor of Tekton, which you use to build the image instead. It seems like the unit is still an image, though.
Participant 5: In Amazon you don’t even see the image, you have this very, super thin layer that you’re deploying.
Wilson: You can still connect to those systems with Tekton, you don’t have to be building images but Tekton is using images to run.
Participant 6: [inaudible 00:42:51] how are you building containers in Tekton? Do you have a whole Docker-in-Docker?
Wilson: The question is, how are we building containers inside of Tekton? If you want to use Tekton to build an image, do you have to use Docker-in-Docker, like mounting a Docker socket or something like that? Tekton is opinionated about that, you can build the image however you wanted so you could mount the Docker socket if you wanted. In most of our examples, we use a project called Kaniko, which is one of the several projects that lets you build images without having to mount the Docker socket, so it’s a bit safer.
See more presentations with transcripts
MMS • Monica Beckwith Anil Kumar
Article originally posted on InfoQ. Visit InfoQ
Transcript
Kumar: Let me start the discussion. Monica [Beckwith] will talk about the customer. There were definitely three issues, one was related to what are the licensing terms. I think there is a talk later in which I’m not that involved; in licensing there are other experts. Second one was the monitoring and observability, that have not been great in 7 or 8 and there have been significant improvement. I’ve seen there are other talks about the monitoring part, so this track also does not cover the monitoring. My expertise comes more from the benchmarking area, performance and responsiveness.
I got this email from Dev one and a half month ago or so, “We are evaluating this Intel latest platform and I’m doing this runs and I’m getting a variability of almost 40%, 50%, 60% from run to run,” and I’m, “No, I have not seen such things.” You can see the two metrics he was talking about. One is full capacity metric, when system is fully utilized, only in case everything else fail and only fuse system are carrying the load, then performance is very repeatable. Where my production ranges with regard to 30% to 40% operational, then I see this 60% to 70% variability from run to run and that start to gave me some idea, “What is going on here? Because we don’t see such things.”
What Test Is Running?
That lead me to ask the very first question to that person: “What are you running?” This is a pretty large company. They said, “I have around 3,000 to 4,000 applications, some of them are very small footprint.” These are microservices that talk to each other and some of them are very small, like two gig. We run them usually in two or three gig heap. Very few of them are very large, we go up to 100 gig heap. The problem is, he said, “I cannot take anything from my production environment and have the confidence of repeatability running on the systems.” Then, what I go run for traditional benchmark, etc., that we find. He was using a benchmark which he said, “We run our system in productions, so we know the behavior and we have done the benchmark part and they pretty matched with regard to whether it is GC or CPU utilization or network I/O in most of the situations. We have created this proxy where that’s what we are running.” Ok, that helps us because we can run a similar proxy.
Deployment Environment
These are some of the components we ended up running on our environment. The traditional environment could be your app and the JVM, it could be running in a container and from that container, when you launch a process, you could have number one case. You launch the process, it goes to the one of the socket – there is the two-socket system. The process will start on, let’s say, the other end of the socket and it will get the local memory, so number one, you are running on a socket that’s getting the local memory. In number two, you start your process, it starts on other socket and then it does not get its own local memory, it gets the memory from the other socket. These are the traditional two-socket system. In third case, what happens is that you launch the process again in the second socket and it gets the local memory.
Now let me ask this question: between one and two, which one is going to be better performance? One, because the local memory, and that part could cause significant variation in certain cases. It will not get a result based on the application on the total throughput because we are talking memory latency of 100 nanosecond to 140 nanoseconds, but it can make a big difference on your response time, the latency. Anytime you are sensitive to latency, that path can make a big difference. That is one variation for the responsiveness, why that responsiveness could be different, but not the total throughput.
Second part is not covered on that picture. Many of you may be using the containers or the virtual machines and when you are setting the thread pool within your application, it depends on how many CPU threads that API call gets. The answer to this, if you’re running on a large system, it would be all the core – for example, this system is running 112 threads, it could be 112 threads – or, if you’re running within a VM and that VM only gives you 16 threads or so, the answer would be 16. In one case, you would be setting your thread pool based on 112, another just on 8 or 16.
As the app writer, you don’t have the control, but in the deployment scenario, you have to see. We have seen on the thread pool that if you based on fork/join or now the parallel stream – I will talk a little bit later – how do you do the settings? It could have a effect on the context switch, etc., and result in variability. Another part is, your guest also has policies. Some of them, like Docker, allow pinning, other VMs don’t allow pinning, and your performance thread moving from one socket to other, could have significant impact.
Last part is in the heap memory, the surprising one from the experiment working with that person. What is happening is that there was around 256 gig of memory on that system but traditionally, a system will keep using for almost two days, three days, four days not rebooted, so, over time, the memory fragmentation happens. Even though you’re requesting a 20 gig of heap, you may not get 20 gig of heap. What we noticed is that sometime you were getting 18 gig, another time you were getting only 8 gig. I’ll show some data later.
Even though you give the parameter, “Give me this much heap,” based on how much fragmentation have been and particularly the transparent large pages, which by default nowadays are enabled, that requires a chunk contiguous. If it is not the large pages, then it could actually give you much more easily that memory. There is a performance benefit of large pages of 10% to 15% and that can make a difference on the responsiveness also, as well as throughput. Earlier, you had to request the large pages. Now, the large pages, in these cases, are all by default and they’re transparent, you don’t know.
I did not mean the talk today to go over these details of how the process launched, etc. The interest was, can the JDK 8 to 11 help with reducing the variability? Because these parts are out of your control. As a developer, you’re not thinking where it is deploying, what are the policies, because the policy could change, the deployment might be source here, tomorrow Docker, or some other things. What we wanted to see is, is the JDK doing anything and could we do certain changes to help?
Agenda
Here are a couple of things we want to talk about. First, we want to give you some informations about one of the big changes from 8 to 11. This talk is not about those changes. I think you are very well aware that there are other talks about those feature of the API changes or some thread pool changes and some data coming on them. What we wanted to show is how the different parameters by default are changing if you really run certain benchmarks and workload. That’s one of the sharing parts.
We talked about throughput, we talked about the responsiveness, we talked about the variability, and some startup – that data we want to share. There are a lot of variations in those parts, so Monica [Beckwith] looked at some of the explanations – why it is going that way – so it will help you to understand.
JDK 8 LTS
Let’s start with the new use cases. There have been changes in monitoring and code obscurity, but we are not covering those parts. There are new users of the containers, microservices, or Function as a Service or Polyglot programming. We will cover the Function as a Service slightly, and impacts of the JDK 11. Then, for the concurrency part, we are not covering the Project Loom on the Value Type, as we’re not there. We’ll talk about one of the benchmark that has the fork/join and about the impact on the thread pool. The networking part is the benchmark using NIO, using Grizzly but not the Netty. The impact is very similar but we are not going in detail of that part. Most of the data you would see from the benchmark are throughput or responsiveness or variability or the startup time.
Let’s start with why did we pick the JDK 8, not 7, not 6. This is a survey showing that a significant amount of deployments currently are at 8, that’s what they’re evaluating, and they are thinking to move to 11. Another part is, which workload do we avoid? Because we did pick certain workloads and what we found is that the JMH, particularly, which comes with the JDK kit, has a lot of variability, almost 50% and some of them even bigger, so we are not using the JMH component even though they come with OpenJDK and many times you might just look at the data coming from OpenJDK. That has a lot of variability and we had to remove that part out.
The next one is heap. I talked about it a bit. In that process, even if you give it a certain amount of heap, you’re don’t have any guaranty, so you should always put your GC print output into checking environment when deploying to find out how much heap you are really getting. The data shown here is for SPECjvm 2008, which is compute and memory-bound different components and what we wanted to show is, just look at the 20 gig to 60 gig part. Some of them, of course, won’t be different if they are not allocating heavily and not getting impacted by that, but there are many components in your environment also which can have a significant impact on how much heap you get from run to run. That data was just to show that even on your cases, when you have wide variety of them, you would have big differences.
JDK 8 LTS vs 11 LTS vs 12 vs 13
Now, let’s look at the throughput and performance. In SPECjvm 2008, it has almost 13 or 14 components. For JDK 8 to 11 and even up to 13, there are almost no cases where a performance goes down, there’s only improvement. By default, if you just moved from 8 to 11 to 12 or 13, then other than very rare cases, you should see improvement just by default.
Now let’s talk a little bit more about performance, response, and variability because you can find many benchmarks to measure the throughput. For performance and variability – Monica [Beckwith] was also part of it as she and I work in the same committee – we created this benchmark for being able to have all three components. The very first one here when the benchmark runs is SPECjbb 2015. In the beginning phase, it is actually doing a binary search, that means that it is loading the system crazily: low value, high value, low value, high value. This is very similar to production environment where you might see the surges in throughput or the load coming in.
At that time, it determines what is your settled load values, so it tries to give you a rough approximation of what kind of load you handle when the request comes in variable or bursts. The second part is called the response throughput curve, where it slowly increases the throughput and it keeps increasing and it keeps measuring your response time, which is a 99 percentile response time. From that, it keep loading the system and you get two metrics, one is the max-jOPS which is the full system capacity, what will happen if your system in the failover mode and need to handle. The second one is the critical-jOPS which has an SLA, that is a geometric mean of 5 SLAs, 10 millisecond, 25 millisecond, 50 millisecond, 75 millisecond, and 100 milliseconds. It tries to check what is your throughput when you have those SLAs and that is called critical-jOPS, that is more responsiveness. We have seen for different scenarios that it is in the range of 30% to 50% of the system utilization and that is where most of the production environments systems also operate. These are the three metrics that we get from this benchmark.
Now let’s look at some of the data we got. This data is for the JDK 8 to 11 and it is full system capacity and responsiveness. What you will see between 8 and 11 is that full system capacity makes almost no difference and you may be surprised by the reason. I talked to the person in the team who works, on several of the JIT-related changes, even for 11 and 12, and they have been backported to JDK 8. If you pick the latest JDK 8, several of the JIT-related changes are backported, so throughput-wise, you would see a very similar performance for many situation, that’s the reason.
The responsiveness, the critical-jOPS that we were talking about, that get impacted by your response time for each transaction because that is what four SLAs mean. That is where we see almost a 35% improvement from JDK 11. The reason is that, in 11, when we look into detail, it’s mostly the G1 GC. Because your JDK 8 by default has the parallel stop-the-world GC, anytime you are doing a GC, it’ll ended up anywhere from 15 milliseconds to almost 300-400 millisecond based on what kind of GC happened.
On the other hand, G1 GC takes a hit on the full system capacity, that is where both are matching, but it gives you much better critical-jOPS where the response time is never more than 20-30 millisecond. Monica [Beckwith] will cover later in more detail why and how that happens, but that is part of the reason why the responsiveness is much better on JDK 11, not due to any other component but on the G1 GC by default.
Let’s look at the variability part. How are we defining variability? We are doing 10 runs or more and then we look at the total maximum throughput and all the critical-jOPS we were running under SLA changing, that is run to run variation. That is very similar to you take your test case and launch it 10, 20, or 30 time on the same system. That’s what we do here also – we do some other work in between and then launch the system, do other work, and launch the system. What we are finding from the variability perspective is that JDK 8’s standard variation on the throughput is around 2%, but the standard deviation for the critical-jOPS which is the responsiveness, is almost 10%, so very high and really bad. On the other hand, due to G1 GC, JDK 11 has a predictable response time.
On the other hand, the Parallel GC stops are not predictable. They can be from very small to very large and that’s what causes the variability part. Again, the variability is also related to G1 GC improvements. That is the main component we are finding in addition to, of course, the APL, that thing you get. By default, the variability and responsiveness are mostly coming from the G1 GC part.
Now, let’s talk about a bit more about startup type thing that I was talking about. When we are going Function as Service, we are all talking about something coming out in few milliseconds to, say, one or two minutes. So far, for any workload we were talking, we were talking at least 10 minutes; 6 to 8 minutes to almost 2 hours running. SPECjbb 2015 runs 2 hours, SPECjvm 2008, each iteration runs for 6 minutes, so overall it runs for 2 to 3 hours. DaCapo benchmark have improved their repeatability. I really don’t like their repeatability so we are doing several runs. What you can see on the top graph is that several components are barely 500 millisecond each iteration, so it’s small.
Similary, if tomorrow you start writing Function as Service, a service needs to make a call, get the work done, and be out. In that case, between 8 and 11, I was surprised that so far, we were seeing that JDK 11 is better in everything compared to 8: similar throughput or better, and much better variability and much better responsiveness. Here I was surprised to see that in several of the component, JDK 11, higher is not better. It’s lower because I’m dividing JDK 11 execution time by the JDK 8 execution time, so lower is better.
For this one I discussed with Monica [Beckwith] and then she looked into the logs. This time G1 GC is not doing good and she will explain why, in particular for this kind of instances. There are situations where, for G1 GC for this short startup or Function as Service type scenario, we plan to investigate more and give feedback to OpenJDK, that’s what we plan to do. I think that’s the part I want to do – share the data. I work with Monica [Beckwith] and she has explanations for several of these things we worked on.
GC Groundwork
Beckwith: All the good fun stuff was covered by Anil [Kumar], so what I’m going to do here is provide a little bit of groundwork on Garbage Collections. In certain observations that Anil [Kumar] had, I’m going to provide explanations for those as well. Here are som very basic stuff with respect to a heap layout. Usually we talk about heap as contiguous chunk like that. With the newer Garbage Collectors, you would also see something called regions, so that’s a regionalized heap basically, and these are all virtual space.
Then there’s also the concept of generations, so you have the young generation and old generation. For example, in G1 GC’s case, you will have the generations as well as the regions and that’s typical configuration of the heap when we are trying to explain the basic heap layout. For now, Z GC and Shenandoah are not generational and G1 GC is generational, as well as it’s got regionalized heap. Also, because we are comparing JDK 8 and JDK 11 or 13, I’ve also provide the numbers for Parallel GC. Parallel GC used to be the default for JDK 8 and starting 9, the new default GC is G1, so that’s why I wanted to provide comparative numbers.
Parallel GC is not regionalized. I will go into details of this later when we talk about DaCapo but something to realize is that when we talk about generational heap , Eden and Survivor regions will form the young generation and Old regions as well as Humongous will be from the old generation. This is very important to know and I’ll go into details why. For a user or for even a GC person, it all boils down to occupied and free regions. Basically, if you are generational, your young generation gets filled and then you either promote or you try to age them in the Survivors, and eventually you will have just a bunch of occupied, so basically long-lived objects or whatever.
Again, all the free regions are maintained in a list and any of those occupied regions could be young or old or humongous, which is allocated out of the old region.
GC Commonalities
I want to quickly compare different Garbage Collectors and the reason I wanted to talk about the other two, Shenandoah and Z GC, is because that’s the future, that’s where we’re headed, so you’ll see this trend, which I’ll cover here soon. The entire thing boils down to copying. I’m going to emphasize that here. We also know that as Compacting Collector or we call it Evacuation as well, is kind of similar; everything is similar.
Your heap has a From space and a To space and as you start filling up the From space and it gets filled, now is the time for you to do marking. To do marking, you go find out the GC roots, which could be a static variables, stack, any JNI general references. Then you identify them in your From space area and then you start doing the live object graph and eventually, you move the live objects to the To space and then you reclaim the From space. Eventually, the To space turns into From space and you start allocating into the From space, so it just goes back and forth.
GC Differences
This is a simple concept, but it gets a little more complicated when you have generational GC, it gets complicated when you are doing concurrent compaction or concurrent marking and stuff like that. I will not have time to go into details but I wanted to quickly highlight the differences. As I mentioned, Parallel GC is not regionalized but it is generational, just like G1 GC. Compaction does happen in Parallel and G1 and they just use the forwarding address in the header.
Because Parallel GC is throughput-driven, the goal is to have higher throughput, and there’s no pause time target per se as long as we keep on putting the throughput to the max so everything is stop-the-world in Parallel GC. G1 GC does have target pause time goal. I’m not going to go into details but basically it’s like, “I hope I can achieve this goal,” and then the collection set in the regions will be what will be changed as well as you’ll find out how much expensive a particular region gets during a collection.
Parallel GC does not have any concurrent marking at all, everything is stop-the-world, like I mentioned, but G1 GC does and both G1 and Shenandoah are Snapshot-at-the-Beginning algorithm and Z GC does striping, which I’m not going to go into details here. There’s also the concept of colored pointers in Z GC and their target pause times are slightly smaller actually than G1 GC because both Shenandoah and Z GC are targeting the low pause time market.
Performance
I quickly ran jbb with about 28 gigs. This was explained by Anil [Kumar] earlier; max throughput is basically the entire system when you just fully loaded, that’s the system capacity. There’s the response and throughput curve that Anil [Kumar] was talking about, that’s the max-jOPS metric and then the responsiveness as what he mentioned as critical-jOPS metric. Everything is normalized through Shenandoah’s max throughput. The things I want you to take away from here are that Parallel GC is everything is stop-the-world, so, of course, it gives you the maximum throughput. That’s the way GC is designed, generational, stop-the-world, so it gives you the maximum throughput.
As you go down to G1 GC and basically what I’ve done is I made some adjustments to the pause time goal, I kind of relaxed it a bit, so that’s why you see that your throughput gets better but your critical-jOPS is pretty consistent, so the last three are basically your G1 GC. That’s where the repeatability metric that you were talking about, Anil [Kumar], comes into play. The third and the fourth are Parallel GC, a slight change in nursery produces a lot of variation in Parallel GC’s output with respect to throughput or responsiveness as well.
Shenandoah and Z GC have an issue here because they are not generational yet. They achieve copying compaction while concurrently moving objects from the From space to the To space. Those are trying to achieve higher critical response time, which is what you see with Z GC, so it’s at 56, whereas anything and everything that G1 GC could achieve was about 49 to 50. That’s the target, that’s the goal, that’s the design of these GCs, they’re headed towards providing you much better responsiveness.
It’s a lot of information there but the trend that I’m trying to show here is that there is more effort put into getting better responsiveness going from JDK 8 to 11 to 13.
G1 GC and Humongous Objects
Going back to the DaCapo case, I want to quickly talk about G1 GC and Humongous objects. G1 GC is regionalized and it has the concept of region, each region gets allocated a size, JVM start. In DaCapo’s case, it was four megs. As and when you have objects getting allocated, they would end up in Eden if they meet certain criteria and if it’s an humongous object, they will go and get allocated out of the old generation.
The threshold is basically the size of the object. If the object is greater than or equal to 50% of the region size, so in DaCapo’s case, if the object is two megs or larger, then it will be considered a humongous object. Less than 50%, it will be allocated out of Eden, greater than or equal to 50%, then it would be out of the old generation, and anything that’s greater than region size would have humongous regions, so that will be a contiguous space right there.
It’s same information but expressed differently here. Anything less than half the region size is not humongous, everything else is humongous. If you need more than one region, then it’s called a contiguous region and it’s also humongous. With DaCapo, one of the things that it does, I guess it’s different benchmarks at start, but it’s setting up the object. The objects are long lived and because of the four megs space, anything that’s two megs or above becomes a humongous object. When DaCapo is allocating these objects, which it’s hoping were regular sized because of the lower region size that we have, these are all humongous objects.
When you’re doing system GC, what’s happening is you’re trying to move these humongous regions. Remember that we’re trying to have contiguous regions? You’re trying to move it from the From space because they are live into the To space and, if you keep on doing it over time, trying to find contiguous regions gets difficult because of fragmentation issues. That’s why G1 GC showed you reduced performance.
AOT Groundwork
I wanted to talk about AOT because that’s the direction where we are headed: more responsiveness. We’re going to have a talk later today about more compilation directions in future by Mark [Stoodley], but this is something that is available since JDK 9 and 10 and it’s gotten better over time. One of my colleagues has a very good article, so I’m going to reference the article here. Prior to tiered compilations, before JDK 7-ish, you would have the first execution, it would end up in the interpreter, and then eventually you will have adaptive JIT-ing based on the profiles of critical hotspots. You have thresholds, thresholds are crossed, some things get JITed, and there was a concept of server and client compiler, which is also known as C2 and C1, and then tiered compilation happened.
Tiered compilation was fully supported in JDK 8, I think, and before that, it was experimental. With tiered compilation, the C1 and C2 concepts are still there but the profiling concept is different, so you have limited profiling as opposed to full profiling. There’s a good explanation in that link over there. All you have to think about is basically from interpreter to C1 or C2 based on the profiling and the different thresholds and then, of course, there’s a deoptimization path as well.
With AOT, what happens is, after the first execution, we do not go to integrator, we actually go to a AOT code and we can do C1 and C2 based on full profile, so when you have C1 with full profile, you could go to C2 and any deoptimization goes back to interpreter. To go into details, please go ahead and read that article; there are many great articles out there on AOT as well.
Performance
What I did is I took the JVM 2008 startup component and I tried to run it without AOT, then with AOT, and with AOT with tiered. The difference between AOT and AOT with tiered is that when you create the dynamic library, you could say, “I would like it to be able to use the tiered compilation path,” or you could say, “No, I don’t need the tiered compilation path.” As you can see, higher is better, so most of the time, you’ll see AOT just giving you a straight up win for most of the startup workloads that I have covered here and apologize again for the label getting cut out like that. What was interesting is, if you look at the last three here, the blue one is without AOT and after that, the performance drops.
I was using the same workload as the previous one there. You saw AOT and AOT with tiered actually giving you a benefit, so these two workloads are the same, but the runtime is different, so that is just measured at startup and this one is measured after it’s warmed up and now it’s trying to achieve steady state. The reason why AOT with tiered gives you the worst performance is that it hasn’t crossed the threshold, so when you think about these different compilation improvements, the thresholds change as well.
For example, tier three invocation threshold for AOT with tiered is more than 10X or 100X different than without tiered and stuff like that, so the threshold is totally changed. For the last one here, to achieve similar runs, it will actually have to run more times, so basically, if I run it more times, it would have crossed the threshold and you would have seen a better optimized code, so it would have gone to tier four. That’s one of the reasons why we have that reduced performance there.
Summary
Kumar: I think the main key take away from the JDK 8 to 11 or even up to 13 is, if you are running long and steady state, mostly throughput bound, you may not see a big difference between 8, 11, 12, 13. There could be some cases where you are better but usually, we did not find a big difference across these benchmarks. If you are talking about workload with responsiveness where you have the SLAs, you are looking at those low pause time, etc., you would see significant improvement in your responsiveness and you will also see a significant improvement in your variability.
The thing we found to relate to it is mostly the changes from the Parallel GC to G1 GC, because those pause times are giving you more consistency and better end to end response time. If that is your goal on the front application, then it is worth moving or evaluating up to 11 or even higher for latest GCs coming in.
The last one is, when you have the short running workloads, as we saw with the DaCapo also, you may want to check there because there could be some issue with G1 GC and we do plan to give this feedback to OpenJDK to see if they can be addressed, as Monica [Beckwith] just pointed with the humongous object sizes causing the issue, and you’re seeing worst performance in that case.
We know that containers are being used very heavily, almost 40%-50%, and the next one on the growth is Function as Service in many areas. I think that scenario will happen, so it would be good, I think, to have that part but definitely right now, you need to watch for G1 GC with regard to short startup timings related workload and situations.
As for AOT that Monica [Beckwith] just talking about, you have to be there also, just watch. If it is long term, then you might be better off without, but if it is short Function as Service type thing, then AOT definitely giving you a faster response times.
I think that we definitely want to know more because we are also in the SPEC committee working on making changes, as you saw. Earlier, the workloads were all like SPECjvm 2008, more just throughput, you do something, compute memory, and throughput. Then we changed to SPECjbb 2015, we change it into more response time where you can see the difference on response time and repeatability. Similar changes we are planning next and we are looking into parallel streams and other changes coming in but if you have the use case from your area, “These are my problem point and these are the use cases,” we definitely want to reflect them into the benchmarks, that is one of our goals. They can be used through evaluation, as you saw that at least three or four large customer I’ve talked to, they have 4,000 applications but they can’t use them for testing or evaluating.
Questions and Answers
Participant 1: We use G1 GC with JDK 8 itself as it’s recommended. Why should we move to JDK 13?
Beckwith: I think you should go to Gil’s [Tene] talk and that would be helpful. In this track today, we did not have an exhaustive list but there are lots of improvements that moving to 11 LTS would bring and even after that, probably the MTS, as Gil [Tene] will talk about. Right now at Microsoft we have a lot of internal customers who are still at JDK 8. We’re trying to help them to move to 11 update and we made a list of pros and cons and how it can affect them, like multi-release JARs and other things that may be helpful to them.
It’s a very case-specific analysis that we have to do. I can just mention all the features all the benefits that you can get, but do they apply to your use case? Probably not, not all of them. You have to do evaluation or cost benefit analysis for moving to 11. Remember, any of these kind of low latency Garbage Collection or even AOT for that matter, those benefits you will only get when you move to this side of 9.
Participant 2: You’re talking about how a lot of the newer Garbage Collectors divide the memory into regions. I was just wondering, is that something that’s configurable, that we should be thinking about, like what size region should we use, or is that something that’s just handled by the GC itself?
Beckwith: It should be handled by the GC. Z GC is adaptive and so it should not be a problem. Unfortunately, right now it is, and that’s what I was showing you with respect to DaCapo. We definitely want to change that, so it shouldn’t be something that you should worry about. That was just a bad choice when we started doing G. We’ll work on changing that, so you shouldn’t worry about those things.
Participant 3: [inaudible 00:44:10]
Beckwith: JDK 8?
Participant 3: Yes.
Beckwith: You do get Shenandoah with JDK 8. I’m not sure which is the status of that right now.
Participant 4: Only the Red Hat.
Beckwith: There’s a page maintained by Aleksey, you could probably go check it out but you’ll have to use their bits for JDK 8.
Participant 5: Thanks for the excellent metrics, it was very useful. I do have two questions out of this talk. One is, I was also in the talk with GraalVM when they were talking about the JIT and AOT with GraalVM and I do see an AOT function with Java that starts with JDK 9 and GraalVM, they also talked about beng using Oracle with Oracle Cloud. Can you help us to decide on when do you really use the GraalVM AOT with this AOT or do we even start to look into GraalVM or not?
Beckwith: I’m not the best person to talk about that. If anybody else here would like to chime in, I would appreciate that. Did you say when you want to evaluate Graal?
Participant 5: Yes, is there a difference between the AOT that comes with Java towards what GraalVM is offering?
Beckwith: The jaotc tool that I use to generate the dynamic library, is from the Graal JIT. You’re talking about VM level differences, but this is more of a JIT level thing. Graal JIT is supposedly the future, which means that eventually C2 will be replaced by Graal Jit, not the VM. I think this is a very big question for me to be able to answer. I’m not the right person to talk about Graal because I don’t want to provide any knowledge that may not be helpful.
JIT is different, though, I just want to clarify that. When people talk about GraalVM, unfortunately, it’s similarly named, but VM has a lot of different benefits. With JDK 9, I think there was a JVMCI, which is the compiler interface that was introduced and took advantage of the Graal JIT and that’s how we get AOT. It’s from the same source, I would say, but I have not done any performance analysis on Graal JIT AOT with that.
Mark Stoodley: I’ll be talking a little bit about that point in my talk later today. That talk isn’t specifically about Graal, I’m not from the Graal team, I don’t represent them, but my talk is about some of the trade-offs in how do you choose whether to use JIT or to use AOT or to use any of the other technology. I’ll touch on it a little bit, so I encourage you to attend.
Beckwith: I was going to talk about that. Mark [Stoodley] will talk about the future, the JIT directions, so that would be a good talk for you to attend to understand AOT is just the start so there’s more. The lady asked us, “Why should I move?” Another reason to move is because of all the improvements that will happen and it will be on the JDK 9 code base mostly.
Kumar: Another answer for “Why to move?” is we have seen in SPECjbb 2015, the fork/join is not easy to use because of the different thing we had to do, but parallel stream have done much better improvement. One of the thinga you may want to find is, anytime you have the thread pool within microservices or other situations you want to do the auto balancing, it really requires some very well-thought, which is with parallel stream in 9 or higher, you might have better jOPS if you do need the load balancing through thread pool.
It is a tricky issue now because if you are within a VM, you might have only 8 core or in your whole system, you might have 256 core and you don’t know how your application will behave on those two extremes. There may be some consideration but there’s no perfect answer to this, you have to try how it is behaving.
See more presentations with transcripts