Month: September 2021

MMS • RSS
Article originally posted on Data Science Central. Visit Data Science Central

What is flutter?
Flutter is a cross-platform technology developed by Google, that allows creating application programs for mobile, desktop, and web use. It uses the Dart programming language, which is based on the notorious Java. If you know Java/C#, assume you can program with Dart. The technology keeps up with the latest developments and is used by developers around the world. Most importantly, it is open-source and completely free.
Reasons to choose Flutter
Low-cost app development
An ideal cross-platform should meet two requirements: provide a high-quality user experience (smooth animations, native UI elements without slowing down), and be cost-friendly from the development perspective.
The advantage of Flutter is not only in making one application instead of two. With this framework, you will also have fewer problems when adapting your app to each of the platforms. Most frameworks can cope, but that’s only if to consider them in the context of simple applications. The real problems begin when an application becomes “overgrown” with functions and inevitably gets complicated (it is about most products during the development stage).
Similar to native app performance
While a Flutter app is built directly into the machine code, that will exclude any performance bugs during interpretation. A Flutter application will be ultimately indistinguishable from the native app, since it doesn’t rely on any intermediate code representations or interpretation, in contrast to most other cross-platform frameworks
Own rendering engine
Flutter promises absolute freedom in creating a user interface regardless of the platform. This is achieved by the fact that the framework uses its own rendering engine to draw widgets.
Simple logic implementation
Flutter provides advanced OS features like GPS coordinates, sensor data collection, permission handling, Bluetooth, credentials, and other features in ready-to-use plugins that are supported by Google.
If your app is reliant on an OS-level feature not available as a plugin, Flutter can establish communication between its Dart programming language and the native code using platform channels.
Amazing design
Two powerful things were originally laid in the foundation of Flutter: an excellent programming language (Dart) and a fast, high-performance rendering engine (Skia). Such a choice was a well-thought-out solution that saves users from further long searches.
Customizable kit of widgets
Widgets are the basic blocks used to build a user interface of a Flutter application. Its layering makes it easy to create applications of any complexity. You can use ready-made widgets from Material-UI or implement specific components based on basic widgets. With Flutter, it is also possible to flexibly work with animation and gesture processing. Thus, you can combine rapid work with high-level widgets and still have the ability to add/redefine deeper layers.
Apps made using Flutter?
1. Google Ads
This is a mobile application that allows you to manage Google ad campaigns directly from your smartphone. It’s a condensed version of a desktop platform for you to track ad output from any location – you’re not restricted to your workplace.
The app includes campaign statistics, the ability to update bids and budgets in real-time, live alerts, keyword editing, and the ability to contact a Google expert. It’s both intuitive and aesthetically pleasing.
2. Lunching
Launching is a smartphone app that makes it easy to order delivery food. It is one of the successful food delivery apps made with flutter that experiments with the new architecture. One person inside the organization can create an order using the app. Bulk payments can be made or paid users can also make payments in smaller instalments.
3. Watermaniac
Watermaniac is a lightweight water monitoring application made possible by Flutter framework. It assists consumers in keeping an eye on their frequent water use. Users may create recurring targets, track their usage history, and get necessary reminders for their next consumption.
4. Cryptograph
This Flutter app provides top-notch results in monitoring and tracking the latest updates on over 1600 global cryptocurrencies such as Bitcoin, Ripple, Dogecoin, and Ethereum. The Cryptograph smartphone app, operated by Flutter, provides real-time information in the form of exchange rate maps, enabling users to monitor the market movement history of their desired cryptocurrency.
Conclusion
Flutter app development company enables companies to get versatile solutions while resolving many common issues. Start-ups and SMEs can also tap into opportunities with customized and feature-rich apps that can easily run-on iPhone and Android devices.
On one hand, small companies count on Flutter development for saving big on development time and cost, and on the other hand, large companies prefer Flutter because it can enable them to get rid of a decentralized team of developers. There is no exaggeration in mentioning that Flutter can be considered as a future of mobile app development.
.
Real-Time Analytics Market – increasing demand with Industry Professionals: Microsoft, SAP …
MMS • RSS
Posted on mongodb google news. Visit mongodb google news
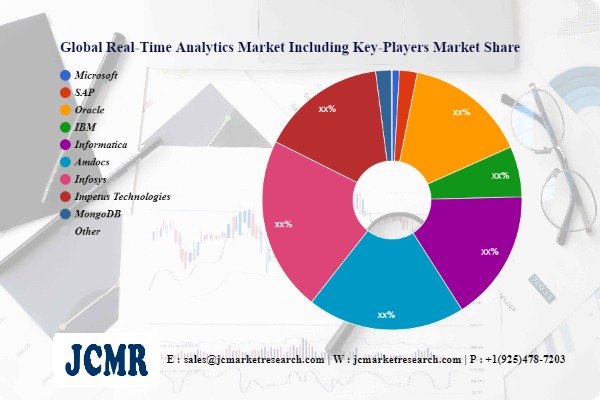
Global Real-Time Analytics Market (Pre-Post Covid-19) Size & Forecast Analysis till 2029: Global Real-Time Analytics research report on the Real-Time Analytics market is a product of a brief review and an extensive analysis of the realistic data collected from the Global Real-Time Analytics Market 2021. The data was gathered based on Real-Time Analytics manufacturing drifts and services & goods linked demands.
Download Free Sample Real-Time Analytics Report PDF @ jcmarketresearch.com/report-details/1450652/sample
Due to the rising partnership activities of Real-Time Analytics industry key players over the projected period, North America accounted for the xxx million $ share on the Real-Time Analytics market in 2021
Top Real-Time Analytics Key players included in this Research: Microsoft, SAP, Oracle, IBM, Informatica, Amdocs, Infosys, Google, Impetus Technologies, MongoDB
Major Types & Applications Present in Real-Time Analytics Market as followed:
Segment by Type{linebreak}- Processing in Memory{linebreak}- In-Database Analytics{linebreak}- Data Warehouse Appliances{linebreak}- In-Memory Analytics{linebreak}- Massively Parallel Programming{linebreak}{linebreak}Segment by Application{linebreak}- BFSI{linebreak}- Manufacturing{linebreak}- Media and Entertainment{linebreak}- Government{linebreak}- Retail and Wholesale{linebreak}- Military{linebreak}- Warehouses{linebreak}- Scientific Analysis
A flawless example of the latest developments and groundbreaking strategic changes allows our clients the opportunity to improve their decision-making skills. Ultimately this helps to work with perfect business solutions and execute innovative implementations. The Global Real-Time Analytics Market 2020-2029 Report highlights the latest trends, growth, new opportunities and latent tricks.
[We are currently offering Special Discount on Real-Time Analytics report because of Covid-19 please share you budget so we can help you to deliver our service]
In addition to the Real-Time Analytics related statistics, the larger part of the data obtained is presented in graphical form. The global Market Study Real-Time Analytics shows in detail the working of key market players, manufacturers, and distributors. The study also outlines the restrictions and factors influencing the global demand for Global Real-Time Analytics Market.
Special Discount on Real-Time Analytics Report Immediate Purchase @ jcmarketresearch.com/report-details/1450652/discount
Commonly Asked Questions:
- At what rate is the Real-Time Analytics market projected to grow?
The year-over-year growth for 2021 is estimated at XX% and the incremental growth of the market is anticipated to be $xxx million.
- Who are the top players in the Real-Time Analytics market?
Microsoft, SAP, Oracle, IBM, Informatica, Amdocs, Infosys, Google, Impetus Technologies, MongoDB
- What are the key market drivers and challenges?
The demand for strengthening ASW capabilities is one of the major factors driving the Real-Time Analytics market.
- How big is the North America Real-Time Analytics market?
The North America region will contribute XX% of the Real-Time Analytics market share
Check feasibility and Get Customized for Real-Time Analytics Report @: jcmarketresearch.com/report-details/1450652/enquiry
This helps to understand the overall market and to recognize the growth opportunities in the global Real-Time Analytics Market. The report also includes a detailed profile and information of all the major Real-Time Analytics market players currently active in the global Real-Time Analytics Market. The companies covered in the report can be evaluated on the basis of their latest developments, financial and business overview, product portfolio, key trends in the Real-Time Analytics market, long-term and short-term business strategies by the companies in order to stay competitive in the Real-Time Analytics market.
Regions & Countries Mentioned in The Real-Time Analytics Market Report:
• Real-Time Analytics industry North America: United States, Canada, and Mexico.
• Real-Time Analytics industry South & Central America: Argentina, Chile, and Brazil.
• Real-Time Analytics industry Middle East & Africa: Saudi Arabia, UAE, Turkey, Egypt and South Africa.
• Real-Time Analytics industry Europe: UK, France, Italy, Germany, Spain, and Russia.
• Real-Time Analytics industry Asia-Pacific: India, China, Japan, South Korea, Indonesia, Singapore, and Australia.
The Real-Time Analytics report analyses various critical constraints, such as item price, production capacity, profit & loss statistics, and global market-influencing transportation & delivery channels. It also includes examining such important elements such as Real-Time Analytics market demands, trends, and product developments, various organizations, and global market effect processes.
Buy Full Copy Global Real-Time Analytics Report @ jcmarketresearch.com/checkout/1450652
A methodically organized Market Analysis study Real-Time Analytics is based on the primary and secondary tools. It illustrates the data gathered in a more communicative and descriptive manner encouraging the consumer to develop a well-structured strategy to grow and improve their companies in the expected time.
Find more research reports on Real-Time Analytics Industry. By JC Market Research.
About Author:
JCMR global research and market intelligence consulting organization is uniquely positioned to not only identify growth opportunities but to also empower and inspire you to create visionary growth strategies for futures, enabled by our extraordinary depth and breadth of thought leadership, research, tools, events and experience that assist you for making goals into a reality. Our understanding of the interplay between industry convergence, Mega Trends, technologies and market trends provides our clients with new business models and expansion opportunities. We are focused on identifying the “Accurate Forecast” in every industry we cover so our clients can reap the benefits of being early market entrants and can accomplish their “Goals & Objectives”.
Contact Us: https://jcmarketresearch.com/contact-us
Mark Baxter (Head of Business Development)
Phone: +1 (925) 478-7203
Email: sales@jcmarketresearch.com
Connect with us at – LinkedIn
Article originally posted on mongodb google news. Visit mongodb google news
MMS • Andrea Messetti
Article originally posted on InfoQ. Visit InfoQ

JobRunr, a relatively new JVM job scheduling tool, allows developers to schedule a job using just a one-line Java lambda that can manage delayed and recurring jobs.
JobRunr stores the job details for each job using a StorageProvider interface and supports all major SQL databases and NoSQL databases. In this way, it is fault-tolerant since, by default, it will reschedule the background job with an exponential back-off policy if it encounters an exception. Since JobRunr does not keep any locks on other jobs, it is possible to distribute and process the jobs on different machines.
This past week, JobRunr has released version 4.0 which brings updated Spring Boot Starter support, new integrations with Quarkus and Micronaut and a new jobs analysis performance mode that checks if a job can be cached to speed up the subsequent calls.
JubRunr also includes a built-in dashboard that allows monitoring of jobs.
Ronald Dehuysser, founder and main developer of JobRunr, spoke to InfoQ about this latest release
InfoQ: What was the inspiration for the development of JobRunr?
Dehuysser: On a couple of occasions in my professional life, I needed to make some really difficult calculations on several gigabytes of data that take some time to finish. And for these types of calculations, I never found the right Java framework to assist me in getting the job done reliably and in a clean code manner.
Another use case example is data import from legacy systems that do not support push notifications. But if you work in a load-balanced environment, this becomes a lot more difficult as all nodes will check for new data whereas this should only happen on one node.
There is Spring Batch or Quartz, but these frameworks all make you implement custom interfaces and they add a lot of overhead whereas I just want to run some long-running tasks in the background.
JobRunr solves all of this by just accepting any Java 8 lambda, analyzing it and storing the job information in a SQL or NoSQL database. You can schedule these jobs to be executed as soon as possible, somewhere in the future or in a recurring manner using Cron expressions.
As soon as these jobs are saved in the database, they can then be processed in parallel on different servers. This decreases the total amount of time needed to process all these jobs. As it internally uses optimistic locking, each job will only be processed once.
In any software architecture, things can sometimes go wrong and will go wrong. Also, in this case, JobRunr helps and retries the failed jobs automatically with a smart backoff policy.
Last but not least, I wanted visibility in how these jobs were executed. That’s why I added the dashboard. It really helps to monitor job progress and you can easily find the root cause of why a job failed.
InfoQ: What’s on the horizon for JobRunr?
Dehuysser: JobRunr 4.0.0 was just released which adds better integration with Spring, Quarkus, and Micronaut. It also adds a new cache for the job analysis which makes things even faster.
As JobRunr is an open-source project. I’m open to ideas from the community on how to improve it. Some ideas that I have include a better algorithm (perhaps based on multivariate machine learning) to fasten the processing time of all these jobs.
InfoQ: What else would you like our readers to know about JobRunr?
Dehuysser: I would like to highlight three things:
- JobRunr does some magic with ASM (which is also used by Spring, Hibernate and a lot of other frameworks) to analyze the job lambda. By using ASM, I really learned a lot about the JVM bytecode, which is not as difficult as I imagined.
- As JobRunr performs bytecode analysis, it also participates in the Oracle Quality Outreach program. This means JobRunr is tested against upcoming releases of the JVM. This helps me to make sure that it will continue working on newer Java releases and also helps the Java community as bugs in the JVM itself are caught earlier.
- For users that need support or extra features, there is also JobRunr Pro. It builds on top of JobRunr and adds extra features like queues with different priorities (high priority jobs get processed before low priority jobs), job chaining, atomic batches and a better dashboard which adds search capabilities.
And, for any license sold, some new trees are planned as 5% of the revenue goes to teamtrees.
JobRunr may be compared with alternative tools like Quartz and Spring (Scheduling support). It is open-source and free for commercial use under the LGPLv3 license. A PRO version is also available that adds features such as priority queues and job chaining.
NoSQL Market 2021 Detailed Analysis of top Ventures with Regional Outlook – Wrestledelphia
MMS • RSS
Posted on nosqlgooglealerts. Visit nosqlgooglealerts

Reports Globe offers research-based global study and analysis of the Global NoSQL Market. This report provides an in-depth overview of the drivers and limitations available in the market. NoSQL market report also provide prehistoric and five-year forecasts for the industry and contain data on socio-economic data from around the world. Key stakeholders can review the statistics, tables, and figures mentioned in this strategic planning report that lead to the success of the organization. Illuminates strategic production, revenue and consumption trends for players to increase sales and growth in the global NoSQL market. Here it focuses on the latest developments, sales, market value, production, gross margin and other important business factors of major players operating in the global NoSQL market. Players can use the exact market facts, figures and statistical studies provided in the report to understand the current and future growth of the global NoSQL market.
This report provides an assessment of various drivers, government policies, technological innovations, emerging technologies, opportunities, market risks, constraints, market barriers, challenges, trends, competitive landscapes and segments that provide a true picture of growth in the global market through NoSQL market.
Get FREE Sample copy of this Report with Graphs and Charts at: https://reportsglobe.com/download-sample/?rid=302034
The segmentation chapters enable readers to understand aspects of the market such as its products, available technology and applications. These chapters are written to describe their development over the years and the course they are likely to take in the coming years. The research report also provides detailed information on new trends that may define the development of these segments in the coming years.
NoSQL Market Segmentation:
NoSQL Market, By Application (2016-2027)
- Data Storage
- Metadata Store
- Cache Memory
- Distributed Data Depository
- e-Commerce
- Mobile Apps
- Web Applications
- Data Analytics
- Social Networking
NoSQL Market, By Product (2016-2027)
- Key-Value Store
- Document Databases
- Column Based Stores
- Graph Database
Major Players Operating in the NoSQL Market:
- Microsoft SQL Server
- MySQL
- MongoDB
- PostgreSQL
- Oracle Database
- MongoLab
- MarkLogic
- Couchbase
- CloudDB
- DynamoDB
- Basho Technologies
- Aerospike
- IBM
- Neo
- Hypertable
- Cisco
- Objectivity
Company Profiles – This is a very important section of the report that contains accurate and detailed profiles for the major players in the global NoSQL market. It provides information on the main business, markets, gross margin, revenue, price, production and other factors that define the market development of the players studied in the NoSQL market report.
Global NoSQL Market: Regional Segments
The different section on regional segmentation gives the regional aspects of the worldwide NoSQL market. This chapter describes the regulatory structure that is likely to impact the complete market. It highlights the political landscape in the market and predicts its influence on the NoSQL market globally.
- North America (US, Canada)
- Europe (Germany, UK, France, Rest of Europe)
- Asia Pacific (China, Japan, India, Rest of Asia Pacific)
- Latin America (Brazil, Mexico)
- Middle East and Africa
Get up to 50% discount on this report at: https://reportsglobe.com/ask-for-discount/?rid=302034
The Study Objectives are:
- To analyze global NoSQL status, future forecast, growth opportunity, key market and key players.
- To present the NoSQL development in North America, Europe, Asia Pacific, Latin America & Middle East and Africa.
- To strategically profile the key players and comprehensively analyze their development plan and strategies.
- To define, describe and forecast the market by product type, market applications and key regions.
This report includes the estimation of market size for value (million USD) and volume (K Units). Both top-down and bottom-up approaches have been used to estimate and validate the market size of NoSQL market, to estimate the size of various other dependent submarkets in the overall market. Key players in the market have been identified through secondary research, and their market shares have been determined through primary and secondary research. All percentage shares, splits, and breakdowns have been determined using secondary sources and verified primary sources.
Some Major Points from Table of Contents:
Chapter 1. Research Methodology & Data Sources
Chapter 2. Executive Summary
Chapter 3. NoSQL Market: Industry Analysis
Chapter 4. NoSQL Market: Product Insights
Chapter 5. NoSQL Market: Application Insights
Chapter 6. NoSQL Market: Regional Insights
Chapter 7. NoSQL Market: Competitive Landscape
Ask your queries regarding customization at: https://reportsglobe.com/need-customization/?rid=302034
How Reports Globe is different than other Market Research Providers:
The inception of Reports Globe has been backed by providing clients with a holistic view of market conditions and future possibilities/opportunities to reap maximum profits out of their businesses and assist in decision making. Our team of in-house analysts and consultants works tirelessly to understand your needs and suggest the best possible solutions to fulfill your research requirements.
Our team at Reports Globe follows a rigorous process of data validation, which allows us to publish reports from publishers with minimum or no deviations. Reports Globe collects, segregates, and publishes more than 500 reports annually that cater to products and services across numerous domains.
Contact us:
Mr. Mark Willams
Account Manager
US: +1-970-672-0390
Email: [email protected]
Website: Reportsglobe.com
NoSQL Market 2021 Size, Share and Trends Analysis , Growth Factors and Industry Forecast to 2023
MMS • RSS
Posted on nosqlgooglealerts. Visit nosqlgooglealerts

Global “NoSQL Market” 2020 research report provides Business Perspective In-Depth analysis on the latest market trends, development patterns, and research methodologies. Some of the factors that are directly influencing the market include the production strategies and methodologies, development platforms, and the product model itself. The NoSQL Market report also focuses on growth of the key players functioning in the market, both in terms of regional and global scale.
Request a sample copy of the report –https://www.marketreportsworld.com/enquiry/request-sample/13758538
NoSQL Market report also focuses on some of the key growth prospect, including new product launches, M&A, R&D, joint ventures, collaborations, agreements, partnerships, and growth of the key players functioning in the market, both in terms of regional and global scale. Analysts forecast the Global NoSQL market to grow at the Highest CAGR during the forecast period 2020-2023.With the slowdown in world economic growth, the NoSQL industry has also suffered a certain impact, but still maintained a relatively optimistic growth, the past four years, NoSQL market size to maintain the average annual growth rate of XXX from XXX million $ in 2014 to XXX million $ in 2018, analysts believe that in the next few years, NoSQL market size will be further expanded, we expect that by 2023, The market size of the NoSQL will reach XXX million $.
List of TOP Manufactures in NoSQL Market are: –
- Microsoft SQL Server
- MySQL
- MongoDB
- PostgreSQL
- Oracle Database
- MongoLab
- MarkLogic
- Couchbase
- CloudDB
- DynamoDB
- Basho Technologies
- Aerospike
- IBM
- Neo
- Hypertable
- Cisco
- Objectivity
This Report covers the manufacturers’ data, including: shipment, price, revenue, gross profit, interview record, business distribution etc., these data help the consumer know about the competitors better. This report also covers all the regions and countries of the world, which shows a regional development status, including market size, volume and value, as well as price data. Besides, the report also covers segment data, including: type segment, industry segment, channel segment etc. cover different segment market size, both volume and value. Also cover different industries client’s information, which is very important for the manufacturers.
Enquire before purchasing this report – https://www.marketreportsworld.com/enquiry/pre-order-enquiry/13758538
Product Type Segmentation
- Key-Value Store
- Document Databases
- Column Based Stores
- Graph Database
Industry Segmentation
- Data Storage
- Metadata Store
- Cache Memory
- Distributed Data Depository
- e-Commerce
The report provides noteworthy insights to readers, service providers, suppliers, distributors, manufacturers, stakeholders, and individuals who are interested in evaluating and self-studying this market.
The NoSQL market is divided into the following segments based on geography:
- North America Country (United States, Canada)
- South America
- Asia Country (China, Japan, India, Korea)
- Europe Country (Germany, UK, France, Italy)
- Other Country (Middle East, Africa, GCC)
Major highlights of the global NoSQL Market research report:
- In-depth analysis of the competition across the globe.
- Estimation of global market values and volumes.
- Global market analysis through industry analysis tools such as SWOT and Porter’s five analysis.
- Business profiling of prominent companies across the global regions like North America, Latin America, Middle East, Asia-Pacific, Africa, and Europe.
- Global market growth projections.
Purchase this report (Price 2350 USD for a single-user license) – https://www.marketreportsworld.com/purchase/13758538
Section Wise Segmentation of NoSQL Market
- Section 1: Definition
- Section (2 3): Manufacturer Detail
- Section 4: Region Segmentation
- Section (5 6 7): Product Type
- Channel (Direct Sales, Distributor) Segmentation
- Section 8: Trend (2018-2023)
- Section 9: Product Type Detail
- Section 10: Downstream Consumer
- Section 11: Cost Structure
- Section 12: Conclusion
Some Major Points from Toc :-
Section 1 NoSQL Product Definition
Section 2 Global NoSQL Market Manufacturer Share and Market Overview
2.1 Global Manufacturer Shipments
2.2 Global Manufacturer Business Revenue
2.3 Global NoSQL Market Overview
Section 3 Manufacturer NoSQL Business Introduction
3.1 NoSQL Business Introduction
3.1.1 NoSQL Shipments, Price, Revenue and Gross profit 2014-2018
3.1.2 NoSQL Business Distribution by Region
3.1.3 Interview Record
3.1.4 NoSQL Business Profile
3.1.5 NoSQL Product Specification
Section 4 Global NoSQL Market Segmentation (Region Level)
4.1 North America Country
4.1.1 United States NoSQL Market Size and Price Analysis 2014-2018
4.1.2 Canada NoSQL Market Size and Price Analysis 2014-2018
4.2 South America Country
4.2.1 South America NoSQL Market Size and Price Analysis 2014-2018
4.3 Asia Country
4.3.1 China NoSQL Market Size and Price Analysis 2014-2018
4.3.2 Japan NoSQL Market Size and Price Analysis 2014-2018
4.3.3 India NoSQL Market Size and Price Analysis 2014-2018
4.3.4 Korea NoSQL Market Size and Price Analysis 2014-2018
4.4 Europe Country
4.4.1 Germany NoSQL Market Size and Price Analysis 2014-2018
4.4.2 UK NoSQL Market Size and Price Analysis 2014-2018
4.4.3 France NoSQL Market Size and Price Analysis 2014-2018
4.4.4 Italy NoSQL Market Size and Price Analysis 2014-2018
4.4.5 Europe NoSQL Market Size and Price Analysis 2014-2018
4.5 Other Country and Region
4.5.1 Middle East NoSQL Market Size and Price Analysis 2014-2018
4.5.2 Africa NoSQL Market Size and Price Analysis 2014-2018
4.5.3 GCC NoSQL Market Size and Price Analysis 2014-2018
4.6 Global NoSQL Market Segmentation (Region Level) Analysis 2014-2018
4.7 Global NoSQL Market Segmentation (Region Level) Analysis
Section 5 Global NoSQL Market Segmentation (Product Type Level)
5.1 Global NoSQL Market Segmentation (Product Type Level) Market Size 2014-2018
5.2 Different NoSQL Product Type Price 2014-2018
5.3 Global NoSQL Market Segmentation (Product Type Level) Analysis
Section 6 Global NoSQL Market Segmentation (Industry Level)
6.1 Global NoSQL Market Segmentation (Industry Level) Market Size 2014-2018
6.2 Different Industry Price 2014-2018
6.3 Global NoSQL Market Segmentation (Industry Level) Analysis
Section 7 Global NoSQL Market Segmentation (Channel Level)
7.1 Global Market Segmentation (Channel Level) Sales Volume and Share 2014-2018
7.2 Global Market Segmentation (Channel Level) Analysis
Section 8 NoSQL Market Forecast 2018-2023
8.1 Segmentation Market Forecast (Region Level)
8.2 Segmentation Market Forecast (Product Type Level)
8.3 Segmentation Market Forecast (Industry Level)
8.4 Segmentation Market Forecast (Channel Level)
Continued…
About Us: –
Market Reports World is the Credible Source for Gaining the Market Reports that will Provide you with the Lead Your Business Needs. Market is changing rapidly with the ongoing expansion of the industry. Advancement in the technology has provided today’s businesses with multifaceted advantages resulting in daily economic shifts. Thus, it is very important for a company to comprehend the patterns of the market movements in order to strategize better. An efficient strategy offers the companies with a head start in planning and an edge over the competitors.
CONTACT US
Name: Ajay More
Email: [email protected]
Phone: US +1 424 253 0807 /UK +44 203 239 8187
Other Reports Here:
MMS • RSS
Article originally posted on Data Science Central. Visit Data Science Central

What are Non-parametric tests?
Most the statistical tests are optimal under various assumptions like independence, homoscedasticity or normality. However, it might not always be possible to guarantee that the data follows all these assumptions. Non-parametric tests are statistical methods which don’t need the normality assumption and the normality assumption can be replaced by a more general assumption concerning the distribution function.
Non-parametric and Distribution-free
Often the terms non-parametric and distribution-free are used interchangeably. However, these two terms are not exactly synonymous. A problem becomes parametric or non-parametric depending on whether we allow the parent distribution of the data to depend on a finite number of parameters or keep it more general (e.g. just continuous). Thus, it depends more on how we formulate the problem. Whereas, if the problem does not depend either on the parent distribution or its parameter, then it becomes distribution-free. Hence, both parametric and non-parametric methods may or may not be distribution-free. However, distribution-free procedures were primarily made for non-parametric methods and hence, both the terms are used interchangeably.
When to use Non-parametric tests:
1. When the data does not follow the necessary assumptions like normality.
2. When the sample size is too small. Since, in that case, it becomes difficult for the data to follow the assumptions
3. Data is nominal or ordinal. For example, customer feedback in the form “Strongly disagree, Disagree, Neutral, Agree, Strongly agree”
4. The data is ranked. For example, customers ranks a list of products
5. The data contains outlier
6. There is a lower bound and upper bound in the measurement process beyond which it just says “Not measured” or “Not detected”
Advantages and disadvantages of Non-parametric tests:
Advantages:
1. It needs fewer assumptions and hence, can be used in a broader range of situations
2. A wide range of data types and even small sample size can analyzed
3. It has more statistical power when the assumptions are violated in the data
Disadvantages:
1. If the assumptions are not violated, statistical power of the test is significantly less than the analogous parametric tests. In a way, if assumptions are not violated, using non-parametric test will be a wastage of data
2. For large sample, it is computationally expensive.
Note that, if the data follows the assumptions (mainly the normality assumption), it is always wise to apply parametric tests. Even in some situations when the normality assumption is not met, if the sample size is large enough, parametric tests can be applied.
Below, we introduce some of the most useful non-parametric tests along with a brief python code.
|
Nature of hypothesis |
Non-parametric test |
Parametric counterpart |
When to use |
Simple Python code* |
|
One sample’s location (median) |
Simple sign ; Wilcoxon signed rank |
Student’s t |
Whether the median of the sample is equal to an assumed value in population |
#Code for simple sign test from statsmodels.stats import descriptivestats stat, p = descriptivestats.sign_test(data1) print(“single sample sign test p-value”, p) |
|
Paired sample’s location (median) |
Simple sign ; Wilcoxon signed rank |
Paired t |
Whether the median of the paired sample is equal with each other or not |
#Paired sample Wilcoxon signed rank test from scipy.stats import wilcoxon stat, p = wilcoxon(data1,data2) print(“Paired sample wilcoxon signed rank test p-value”, p) |
|
Two independent samples’ location (median) |
Wilcoxon signed rank ; Mann-Whitney U |
Fisher’s t |
Whether the medians of two independent samples are equal |
#Two independent sample Mann-Whitney U test from scipy.stats import mannwhitneyu stat, p = mannwhitneyu(data1,data2) print(“two sample mann whitney test p-value”, p) |
|
General two independent samples |
Wald-Wolfowitz run |
– |
Whether two independent samples have been drawn from the same distribution |
#Wald-Wolfowitz run test from statsmodels.sandbox.stats.runs import runstest_2samp stat, p = runstest_2samp(data1,data2) print(“two sample Wald Wolfowitz run test p-value”, p) |
|
Multiple sample’s location |
Kruskal-Wallis H |
ANOVA |
Whether more than two samples have been drawn from same distribution |
#Kruskal Wallis H test for multiple sample from scipy.stats import kruskal stat, p = kruskal(data1, data2, data3) print(“multiple sample Kruskal Wallis H test p-value”, p) |
*In most of the cases, it is a two tailed test, by default, in the python code
Conclusion:
Statistical tests are powerful tool to learn and compare samples. In this article, the concept of non-parametric tests, when to use it, various advantages, and different non-parametric tests along with their python codes are introduced. Wise utilization of these concepts will help in analyzing a wide range of sample with minimal assumptions.
MMS • RSS
Article originally posted on Data Science Central. Visit Data Science Central

The global radio frequency identification (RFID) market is estimated to be valued at $21,361.9 million by 2027, surging from $9,966.4 million in 2019 at a noteworthy CAGR of 9.9%.
Impact Analysis of COVID-19 on the RFID Market
The global market for RFID market is estimated to experience significant market growth in the COVID-19 pandemic. The pandemic has weakened most of the sectors and impacted many markets. Government bodies across the world have taken numerous steps to monitor the contaminated areas and curb the spread of the virus. At this time, RFID played an important role as it was used in healthcare sector for various purposes like tracking and identification of samples. Many key companies along with collaboration of the government took multiple steps with the help of RFID technology to digitally verify and authenticate the COVID-19 test and PPE kits with the help of RFID tags.
Global RFID Market Analysis
Increasing demand of the RFID in the commercial sector by multiple end-use industries is predicted to be the major driving factor for the global RFID market in the estimated period. These are also used for tracking of any product or understand production line of different operations and this factor is predicted to drive the global market in the estimated period. For instance, the use of RFID technology in end-use industry will help the manufacturer to achieve the production goal by closely monitoring the product line.
High cost of RFIDs along with installation and maintenance cost is predicted to hinder the global RFID market in the estimated period. The implementation of RFID by the end-use industries requires higher investment that includes purchasing of RFID tags, adopting the tags and reader, and maintain the RFID cost. The RFID tags can be attached to physical money, clothes, or can be implanted in animals and humans for reading personally linked information without consent which give rise to privacy concerns. Moreover, the high cost of RFIDs results in an expensive installation process causing difficulties for small and medium enterprises and start up organizations to adopt the technology. This factor is expected to hamper the growth of the market during the forecast period.
RFID Market, Segmentation
The global RFID market is segmented based on product, type, material, frequency, end-user and region.
Product:
The product segment is further classified into tag and reader. Among these, the reader sub-segment is anticipated to have the fastest growth rate in the estimated period. It has been estimated that the sub-segment is predicted to grow with a CAGR of 9.2% by generating a revenue of $8,335.0 million by 2027. The active or passive reader are used in most of the end use industries as the reader tag is used to understand the complete details of the product in a most effective manner and this is predicted to boost the sub-segment market in the estimated period.
Type:
The type segment is further divided into passive and active. The active sub-segment is anticipated to have the highest growth rate in the global market. The market is predicted to grow with a CAGR of 10.9% by generating a revenue of $11,089.8 million by 2027. Active tags and readers are powered by battery and thus can be embedded in tracking objects and are used by most of the end-use industries which is predicted to boost the market in the estimated period.
Material:
The material segment is further divided into plastic, paper, glass, metal, and others. The plastic sub-segment is predicted to grow with a CAGR of 10.6% by generating a revenue of $4,457.5 million by 2027. Plastic can be considered as one of the best materials for the use of RFIDs because it is the most cost-effective option which is predicted to boost the sub-segment market in the estimated period.
Frequency:
The frequency segment is classified into low frequency, high frequency, and ultra-high frequency. Ultra-high frequency sub-segment is predicted to grow with a CAGR of 10.3% by generating a revenue of $10,548.9 million by 2027. Ultra-high frequency helps in faster data transfer, increases the inventory visibility, and automates workflow due to which various end-use industries use RFID tags, which is predicted to boost the sub-segment market in the forecast period.
End-User:
The end-user segment is further categorized into retail, BFSI, government, industrial, transport and logistics, healthcare, and others. The retail sub-segment is predicted to generate a revenue of $4,275.9 million by 2027 with a CAGR of 8.9% in the estimated period. Retail helps to trace the items against individual shipments and provides smoother operational flow which is predicted to boost the sub-segment market in the estimated period.
Region:
The RFID market for the Asia-Pacific region is projected to witness rapid growth. This market generated a revenue of $2,495.6 million in 2019 and is further projected to reach up to $5,648.1 million by 2027. The companies present in the market are investing more for research and development for developing product, which is predicted to boost the driving factor for the region market in the estimated period. Moreover, presence of skilled labor along with less pay scale is a favorable factor for RFID manufacturers to set up units in the region, and this is predicted to boost the market in the estimated period.
Key Players in the Global RFID Market
- Honeywell
- NXP Semiconductors
- Avery Dennison
- Zebra Technologies
- Impinj
- HID Global
- GAO RFID
- Identiv
- Nedap
- Invengo
Along with the company profiles of the key players in the market, the report includes the Porter’s five forces model that gives deep insights into the competitive environment of the market.
Do Analysts Expect Mongodb Inc (MDB) Stock to Rise After It Has Gained 17.02% in a Month?
MMS • RSS
Posted on mongodb google news. Visit mongodb google news
Analysts who follow Mongodb Inc (MDB) on average expect it to gain 5.15% over the next twelve months. Those same analysts give the stock an average rating of Strong Buy.
That average rating earns the stock an Analyst Ranking of 60, which means it ranks higher than 60 of stocks, based on data compiled by InvestorsObserver.

Wall Street analysts are rating MDB a Strong Buy today. Find out what this means to you and get the rest of the rankings on MDB!
Why are Analyst Ratings Important?
Though analyst projections should not be your only resource when determining your position on a stock, it can be a very useful tool. Analysts follow sectors/industries in-depth and tend to know how local and global conditions tend to affect demand and prices. Many analysts even participate in conference calls where they can get information to better make sense of the numbers.
InvestorsObserver averages the ratings provided by analysts and then ranks their score as a percent against the market. This allows you to compare stocks in a more comprehensive fashion than with the typical buy/sell/hold ranking.
What’s Happening With Mongodb Inc Stock Today?
Mongodb Inc (MDB) stock is trading at $463.62 as of 10:31 AM on Wednesday, Sep 29, a gain of $0.05, or 0.01% from the previous closing price of $463.57. Volume today is light. So far 99,654 shares have traded compared to average volume of 998,355 shares. The stock has traded between $463.00 and $476.29 so far today.
Click Here to get the full Stock Report for Mongodb Inc stock.
Article originally posted on mongodb google news. Visit mongodb google news
MMS • RSS
Posted on mongodb google news. Visit mongodb google news
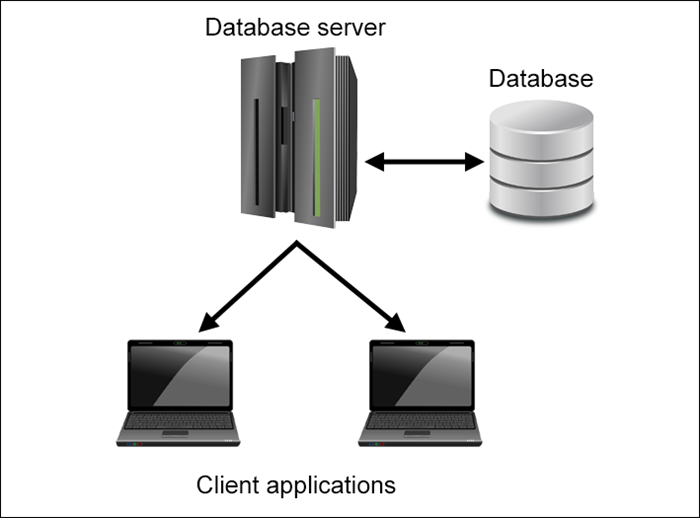
Global Database Servers Market 2021 by Company, Regions, Type and Application, Forecast to 2026 added by MarketsandResearch.biz aims to provide a focused analysis of the data and facts with the underlying opportunity for clients to understand this and grow in the market through every detailed analysis in the report. Besides, this research helps product owners to understand the changes in the target market. The report then includes an elaborative summary of the global Database Servers market that provides in-depth knowledge of various segments of the market and future prospects for the 2021 to 2026 time period. The report focuses on the emerging trends in the global and regional spaces on all the significant components, such as market capacity, demand and supply, production, profit, and competitive landscape.
The research evaluates the market size, growth scenario, potential opportunities, trend analysis, and competitive analysis of the global Database Servers market. The report sorts the worldwide market to gauge the income and investigate the patterns in every one of the accompanying sub-markets: bases on the kind, by application, by end-clients, side-effect classification, and methodology, in view of geology and so on. It provides important information such as market growth, including the drivers, restraints, lucrative opportunities, industry-specific challenges, and recent.
NOTE: Our report highlights the major issues and hazards that companies might come across due to the unprecedented outbreak of COVID-19.
DOWNLOAD FREE SAMPLE REPORT: https://www.marketsandresearch.biz/sample-request/186334
Moreover, the report provides additional information such as interesting insights, key industry developments, detailed segmentation of the market, a list of prominent players operating in the market, and other global Database Servers market trends. The study then discusses the alternative paths to business market customers, the critical role of industrial distributors and manufacturers’ representatives in marketing channels, the central components of channel design, and the requirement of successful channel strategy. The market report also provides the list of leading competitors along with the strategic insights and analysis of the key factors influencing the global Database Servers industry.
The report also presents the market competition landscape and a corresponding detailed analysis of the major vendor/manufacturers in the global Database Servers market:
IBM, Oracle, Microsoft, MongoDB, Amazon, Dell, Redis Labs, SAP, SAS Institute, Pimcore GmbH, The PostgreSQL Global Development Group, TIBCO Software, Information Builders, NetApp, Profisee Group, ASG Technologies, Tealium, FUJITSU,
What is the product type covered in the market?
Relational Database Server, Time Series Database Server, Object Oriented Database Server, Navigational Database Server,
What are the end users/application covered in the market?
Education, Financial Services, Healthcare, Government, Life Sciences, Manufacturing, Retail, Utilities, Others,
Which regions are covered and what are the market trends in these regions?
North America (United States, Canada and Mexico), Europe (Germany, France, United Kingdom, Russia, Italy, and Rest of Europe), Asia-Pacific (China, Japan, Korea, India, Southeast Asia, and Australia), South America (Brazil, Argentina, Colombia, and Rest of South America), Middle East & Africa (Saudi Arabia, UAE, Egypt, South Africa, and Rest of Middle East & Africa)
ACCESS FULL REPORT: https://www.marketsandresearch.biz/report/186334/global-database-servers-market-2021-by-company-regions-type-and-application-forecast-to-2026
Customer Analysis:
The global Database Servers market report includes customer expectation of new product and service, customer perception of new product and service, understanding customer requirement, building customer relationship for new players, product and service recovery, product and service innovation and design, customer define product and service standards, delivering and performing product and service, customer role in product and service. It analyzes consumer perception and positioning, persuading consumers’ behavior and cross-cultural consumer behavior.
Customization of the Report:
This report can be customized to meet the client’s requirements. Please connect with our sales team ([email protected]), who will ensure that you get a report that suits your needs. You can also get in touch with our executives on +1-201-465-4211 to share your research requirements.
Contact Us
Mark Stone
Head of Business Development
Phone: +1-201-465-4211
Email: [email protected]
Web: www.marketsandresearch.biz
View Related Report:
Global Telehandler Market 2021 Product Introduction, Top Industry Players, Regional Study, and Future Growth 2027
Article originally posted on mongodb google news. Visit mongodb google news
Data-Labeling Instructions: Gateway to Success in Crowdsourcing and Enduring Impact on AI
MMS • RSS
Article originally posted on Data Science Central. Visit Data Science Central

Photo by Clayton Robbins on Unsplash
AI development today rests on the shoulders of Machine Learning algorithms that require huge amounts of data to be fed into training models. This data needs to be of consistently high quality to correctly represent the real world, and to achieve that, the data needs to be labeled accurately throughout. A number of data labeling methods exist today, from in-house to synthetic labeling. Crowdsourcing finds itself among the most cost- and time-effective of the labeling approaches (Wang and Zhou, 2016).
Crowdsourcing is human-handled, manual data labeling that uses the principle of aggregation to complete assignments. In this scenario, a large number of performers complete various tasks—from transcribing audio files and classifying images to visiting on-site locations and measuring walking distance—and their best efforts are subsequently combined to achieve the desired outcome.
Research shows that crowdsourcing has become one of the most sought-after data labeling approaches to date with companies like MTurk, Hive, Clickworker, and Toloka attracting millions of performers the world over (Guittard et al., 2015). In some cases, such as with Toloka App Services, the process has been refined to become almost automatic, requiring only clear guidelines and examples from requesters to receive the labeled data shortly after.
Importance of instructions
This brings us to the main point – instructions. As our lives are becoming more AI-dependent, the evolution of AI is in turn becoming increasingly more reliant on ML algorithms for training. These algorithms cannot survive without accurate data labeling. And, therefore, instructions on how to label data correctly are the gateway to success in both crowdsourcing and AI development. Ultimately, poor instructions lead to a poor AI product, nevermind the other factors.
Whereas many crowdsourcing platforms work to hone their delivery pipelines, simplifying the procedure as much as possible, instructions often remain a sore point. No matter how well-oiled the whole data-labeling mechanism is, there’s no way around having clear instructions for crowd workers that can be easily understood and followed accordingly.
Since 95% of all ML labels are supervised, i.e. done by hand (Fredriksson et al., 2020), the instructions aspect of crowdsourcing should never be overlooked or underplayed. However, research also indicates that when it comes to having a systematic approach to labeling data and prepping crowd workers, most requesters often don’t know what to do beyond general notions (Fredriksson et al., 2020).
Disagreements between requesters, as well as expert annotators, and crowd workers continue to pop up and can only be resolved by refining instructions (Chang et al, 2017). For instance, Konstantin Kashkarov, a crowd worker with Toloka, admits that he has disagreed with the instructions from various requesters more than a few times in his career as a labeler (VLDB Discussion, 2021) that—according to him—contained errors and inconsistencies. Kairam and Heer (2016) stipulate that these inconsistencies indeed translate into labeling troubles unless they’re swiftly addressed by the majority voting of crowd workers.
However, how to do this efficiently still remains an open question: practice shows that greater numbers (as opposed to fewer experts) are not necessarily reflective of facticity, especially in narrow, domain-specific tasks – and the narrower, the more so. In other words, just because there are many crowd performers involved in a given project doesn’t mean these performers won’t make labeling mistakes; in fact, most of them might make the same or similar mistakes if instructions don’t resolve ambiguity. And since instructions are the stepping stone to the whole ML ecosystem, even the tiniest misinterpretation and subsequent labeling irregularity can lead to noisy data sets and imprecise AI. In some cases, this can even potentially endanger our lives, such as when AI is used to help diagnose illnesses or administer drugs.
So, how do we make instructions accurate and make sure data labeling is error-free? To answer this question, we must first look at the types of problems many labelers face.
Frequent issues and grey areas
When it comes to crowdsourcing instructions, research indicates that things are not at all cut and dried. On the one hand, it’s been shown that crowd performers will only go as far as they have to, and hence all responsibility to do with the comprehension of tasks ultimately falls on the requester. Both confusing interfaces and unclear instructions tend to result in improperly completed assignments. Any ambiguity is bound to lead to labeling mistakes, while the crowd workers cannot be expected to ask clarifying questions, and as a general rule, they won’t (Rao and Michel, 2016).
At the same time, crowdsourcing practitioners, among them Toloka, experimented with this notion, and it turned out that crowd workers were savvier than previously expected. Ivan Stelmakh, a PhD student at Carnegie Mellon University and a panelist at the recent VLDB conference, explains that his team tried giving confusing instructions to performers on Toloka on purpose expecting a poor performance. They were surprised to discover that the results were still very robust, which implies that somehow the performers were able to understand—whether instinctively or, more likely, through experience—what to do and how. This implies that (a) it’s not just up to the instructions but those who read those instructions, and (b) the more experienced the readers are, the higher the probability of satisfactory results.
Another conclusion that follows has to do with how simple or complex the task in question is. According to Zack Lipton, who conducts ML research at Carnegie Mellon, the outcome very much depends on whether it is a standard or non-standard task. A simple task with confusing instructions can be completed by experienced performers without major problems. This isn’t the case with unusual or rare tasks: even experienced crowd workers may struggle to come up with acceptable answers if the instructions aren’t clear, because they have no domain-specific experience to fall back on.
Importantly, Lipton’s experiments demonstrated that with such tasks different versions of instructions play a direct role in the ultimate outcome. Therefore, it appears that Rao and Michel’s argument about the role of initial guidelines tends to outweigh Ivan Stelmakh’s observation of the performers’ self-guiding ability as the task’s difficulty rises.
Furthermore, according to Mohamed Amgad, a Fellow at Northwestern University who also made an appearance at VLDB, this rule applies to unusual tasks even when the instructions are completely clear. In other words, there’s something inherent about erring during manual task completion, and this problem becomes more pronounced as the tasks become less common and more advanced. In the end, it comes down to variability that can only be eliminated with experience (not just clear instructions), so the underlying issue—according to him—is sometimes embedded in the task itself, not its explanation. To put it bluntly, even if there are very clear instructions on how to build a rocket, most of us will probably struggle with this task unless we have some background in engineering and physics.
Confusion and the bias problem
As we’ve seen, ambiguity in instructions seems to become more of a worry as the task becomes more sophisticated, finally reaching a stage when even clear instructions may lead to substandard results. And sometimes, it turns out, this prevailing inherence goes beyond the crowd workers’ experience right into the realm of personal interpretation. According to Olga Megorskaya, CEO of Toloka, imminent biases exist in datasets that are related to the actual data, guidelines, and also personality and background of the labelers.
This is known as subjective data and biased labeling in the scientific community, a ubiquitous problem that’s qualitatively different from individual errors, because it reflects a common, sometimes hidden group tendency (Zhang and Sheng, 2016 via Wauthier & Jordan 2011 and Faltings et al. 2014). In the best case scenario, this tendency can reflect a particular view that another group might not share, making the labeling results only partially accurate. In the worst case scenario, the outcome can be prejudicial and offensive, such as when in a widely publicized Google case the dark-skinned individuals were mislabeled to be holding a gun, while the light-skinned individuals with the very same device were judged to be holding a harmless thermometer.
Importantly, biased labeling arises not merely from expert vs. non-expert differences or individual preferences, but rather from varying metrics and scales used in decision-making. Often this is the result of one’s socio-cultural background and points of reference. What’s more, this phenomenon may not be apparent to requesters, and so the detection of these biases and their modeling can be very challenging, resulting in a “negative effect on inference algorithms and training” (Zhang and Sheng, 2016).
From the standpoint of statistics, such biases are essentially systematic errors that can be potentially overcome by enlarging sample sizes or collecting different datasets. This means that what’s often more important is not clear instructions, but clear examples – and enough of them for the crowd workers to see a particular pattern in order to steer clear of erring. At the same time, these biases can be so pronounced that they’re often entirely culture-based. A question like “who has the prettiest face in this picture?” or “identify the most dangerous animal” can result in different answers from different individuals within different socio-cultural groups where standards of beauty and local fauna can vary significantly. Often, these differences come down to geography.
A question like “identify a blue object in this image” can, too, yield very different results from individuals from Russia vs. Japan vs. India, where the colors green, blue, and yellow are not classified in the same way.

ANTTI T. NISSINEN, FLICKR // CC BY 2.0
Yet another example comes from a recent survey that was meant to detect hateful speech and abusive language. It turns out that most English speakers may not have the same standards and acceptance levels compared to those of other linguistic backgrounds; for this reason, to get at the bigger picture, members from other, smaller groups should be consulted.
According to Jie Yang, Assistant Professor at Delft University in the Netherlands, the bias problem should be subject to the top-down approach to labeling. This means that all potential biases have to be considered in advance, i.e. when deciding on the kinds of results that are required and thus who exactly should be completing the tasks to obtain these results.
Moreover, according to Krivosheev et al (2020), this overlaps with the issue of confusion of observations, when crowd workers—including those who try their best to do everything by the book—confuse items of similar classes. This happens because the items’ interpretability is embedded within the task, but the description fails to provide enough examples and explanations to point to the desired interpretation. An instance of this phenomenon would be having to identify Freddie Mercury in an image – but does actor Rami Malek playing Freddie count or not?

If this confusion issue is present, then the effect observed by Rao and Michel and corroborated by Lipton’s experiments can be multiplied manifold.
Suggested solutions
Despite some inherent issues related to the type of tasks and performers involved, instructions still remain a pivotal factor in the success of data-labeling projects. According to Megorskaya, even one small change in the guidelines can affect the whole data set; ergo, the question that needs to be addressed is to what extent exactly do changes in instructions have a say in the AI end-product and how to minimize any negative effect?
Jie Yang stipulates that while bias poses a serious obstacle to accurate labeling, crucially, there’s no panacea available: any attempt to resolve bias would be entirely domain-dependent. At the same time, as we’ve seen, this is a multi-faceted problem – accurate results rely on clear instructions and, beyond that, on the tasks themselves (how rare/difficult) and also performers (their experience and socio-cultural background). Consequently, and somewhat expectedly, no universal solution encompassing all of these aspects currently exists.
Nonetheless, Zhang et al (2013) proposes a strategy that attempts to control quality by having periodical checkpoints meant to discard both low quality labels and labelers amid completion. Vaughan (2018) further suggests that before proceeding with any task, projects should be piloted by creating micro pools and testing both UI and crowd workers. It’s been shown that there’s a negative correlation between confusion in instructions and labeling accuracy, as well as acceptance of tasks (Vaughan, 2018 via Jain et al., 2017). In other words, the more examples there are and the clearer the task, the more workers will be willing to participate and the better/quicker will be the result. Be that as it may, while this strategy can help resolve confusion, research indicates that these steps may still be insufficient in combating bias in subjective data.
Zhang and Sheng (2016) suggest a different track – historical information on labelers should be evaluated to consider assigning different “weight” or impact factor to different workers. This weight should depend on their levels of domain expertise and other relevant socio-cultural, as well as educational background. To put it in simpler terms, for better or worse, not all crowd workers should always be treated equally in the context of their labeling output.
Among other suggestions that follow the same logic is Active Multi-label Crowd Consensus (AMCC) put forth by Tu et al. (2019). This model attempts to assess crowd workers to account for their commonality and differences and subsequently group them according to this rubric. Each group shares a particular trait in this scenario that’s reflected in the labeling results that can be followed and dissected much more easily. This model is supposed to reduce the influence of any unreliable workers and those lacking the right background or expertise for successful task completion.
The bottom line
Clear instructions are instrumental in realizing data-labeling projects. Concurrently, other factors emerge to share responsibility as tasks become rarer and more challenging. At some point, problems can be expected to arise even when instructions are clear, because the crowd workers tackling the task have little experience to fall back onto.
Accordingly, inherent biases and, to a lesser extent, confusion of observations will persist, which stem not only from the clarity of instructions and examples, but also from choosing the right performers. In certain situations, the crowd workers’ socio-cultural background may play as much of a role as their domain expertise.
While some of these problematic factors can be addressed using widely accepted quality assurance tools, no universal solution exists apart from (a) selecting those workers that have the right experience and expertise, and (b) those who are able to address the tasks based on their specific background that has been judged to be pertinent to the assignment.
Since instructions remain at the epicenter of the accuracy problem all the same, it is recommended that the following points be considered when preparing instructions:
- Instructions must always be written, so that they’re easy to understand!
- Crowdsourcing platforms may help with preparing instructions, they can enforce these instructions, facilitate the labeling process, check for consistency, and verify results; however, it is the requester who ultimately needs to explain beyond any doubt what is being asked, and how exactly they want the data to be labeled.
- Plentiful and clear/unambiguous examples must always be supplied.
- You need to keep in mind that as a rule of thumb, there’s a positive correlation between task difficulty and clarity of instructions: less clarity means less accuracy.
- Understanding instructions shouldn’t require any extraordinary skills; if such skills are implicit, you need to acknowledge that only experienced workers will know what to do.
- If you have an uncommon task, instructions must be crystal clear and with contrasting examples (i.e. what is wrong) for even the most experienced workers to be able to follow.
- Confusion can be resolved with clear examples, but in some cases, even experienced crowd workers might provide noisy data sets if the bias problem is not addressed prior.
- The best countermeasure to bias is that the crowd workers ought to be selected not merely based on their expertise, but also their socio-cultural background that must always match the task’s demands.
- Managerial responsibility has to be maintained throughout the planning process: micro decisions will lead to macro results, with even the tiniest detail potentially having far-reaching implications.