
MMS • RSS
Article originally posted on Data Science Central. Visit Data Science Central
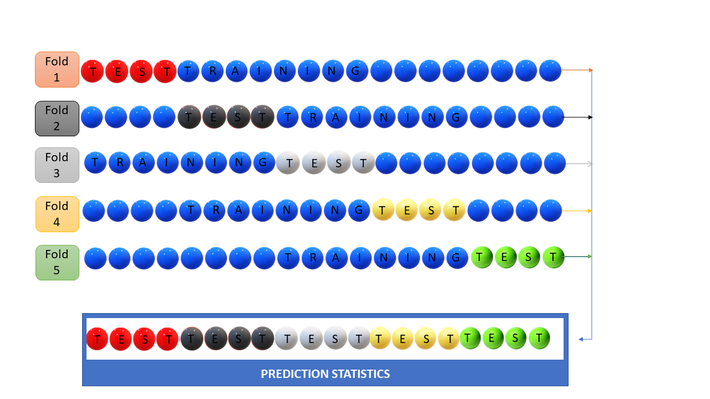
Cross Validation explained in one simple picture. The method shown here is k-fold cross validation, where data is split into k folds (in this example, 5 folds). Blue balls represent training data; 1/k (i.e. 1/5) balls are held back for model testing.
Monte Carlo cross validation works the same way, except that the balls would be chosen with replacement. In other words, it would be possible for a ball to appear in more than one sample.
For more statistical concepts explained in one picture, follow this link. More about cross-validation here and here (includes other re-sampling techniques and how to determine K in K-fold cross-validation.) See also this article.