
MMS • RSS
Article originally posted on Database Journal – Daily Database Management & Administration News and Tutorials. Visit Database Journal – Daily Database Management & Administration News and Tutorials
Configuring Navicat Monitor on Windows 10
One of the hottest trends in database administration is agentless monitoring. Tools that employ an agentless architecture collect performance metrics from your database server(s) without requiring the installation of any agent software on the server(s). From the perspective of database administrators (DBAs), the agentless approach is a lot easier to manage than agent-based monitoring because you don’t need to deploy agent software on every server and can monitor your server(s) remotely. The latest player to enter the database monitoring arena is Navicat, whose line of database administration tools for MySQL, MariaDB, SQL Server, SQLite, Oracle and PostgreSQL are widely regarded as industry leaders. Today’s article will provide one of the first looks at this promising new tool by exploring some of its many features as well as how to configure it, with an emphasis on Windows 10.
Requirements
Navicat Monitor monitors your MySQL, MariaDB and Percona servers, and collects metrics at regular intervals using an agentless architecture. It’s also compatible with a variety of cloud databases like Amazon RDS, Amazon Aurora, Oracle Cloud, Google Cloud, Microsoft Azure and Alibaba Cloud. The Monitoring software is installed on a local computer, server, or virtual machine and then collects a number of process metrics such as CPU load, RAM usage, and a variety of other resources over SSH/SNMP.
Navicat Monitor employs a dedicated database to store alerts and metrics for historical analyses. The repository database can be any existing MySQL, MariaDB, PostgreSQL, or Amazon RDS instance.
Supported Operating Systems (OSes)
Navicat Monitor will run on much the same OSes as their other products. As such, there are installation packages available for Windows, macOS, and Linux. Here are all of the specific supported OS editions:
- Microsoft Windows:
- Windows 8
- Windows 8.1
- Windows 10
- Server 2008
- Server 2012
- Server 2016
- macOS:
- Mac OS X 10.10 Yosemite
- Mac OS X 10.11 El Capitan
- macOS 10.12 Sierra
- macOS 10.13 High Sierra
- Linux:
- Red Hat Enterprise Linux 6.6 or later
- CentOS 6.6 or later
- Oracle Linux 6.6 or later
- Fedora 20 or later
- Debian 8.0 or later
- SuSE Linux Enterprise 12 or later
- openSUSE 42.3
- Ubuntu 14.04 LTS
- 16.04 LTS or 17.10
- Amazon Linux 2
Supported Browsers
Navicat Monitor is a server-based software, which can be accessed from anywhere via a web browser. With Web access, you can easily and seamlessly keep track of your servers from anywhere in the world, around the clock.
You should consider using one of the following browsers before any other. Of course, other browsers will probably work as well, but these have been tested and are recommended by Navicat:
- Firefox (Latest Version)
- Chrome (Latest Version)
- Internet Explorer 11 or later
- Microsoft Edge 39 or later
- Safari 9.1.3 or later
Features at a Glance
We’ve already established that Navicat Monitor employs an agentless architecture and can be installed on any workstation/device OR server running one of the main three (Windows, macOS, Linux) OSes. There are two ways to configure the Navicat software:
- You can install the Navicat Monitor software directly on your workstation/device and then access it locally via your preferred browser.
- You can also install the Navicat software on a server, which would allow you to access the monitor tools from any device that can communicate with your server.
Now let’s take a bird’s eye view of Navicat Monitor’s other pertinent features. Some are integral to any professional monitoring tool, while others go above and beyond, offering additional value in one complete package.
-
Real-time Performance Monitoring
Real-time data monitoring (RTDM) is a process through which an administrator can review and evaluate the overall database processes and functions performed on the data in real time, i.e., as it happens, through graphical charts on a central interface/dashboard. Navicat Monitor includes both a set of real-time and historical graphs that allow DBAs to drill down into the details of server statistics. It provides a fine-grained view of server load and performance metrics relating to availability, disk usage, network I/O, table locks and more. Moreover, by showing side-by-side statistics for each server, DBAs can easily spot and track deviations in performance and traffic among servers. Using the metrics provided by Navicat’s interactive dashboard, DBAs can determine possible remedies and adjust server settings accordingly.
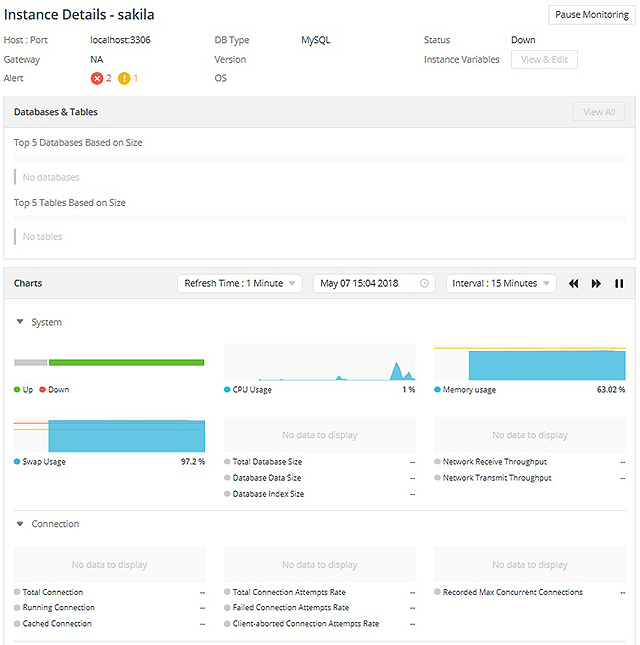
Real-time Performance Monitoring -
Alerts
Even the most dedicated DBA can’t be watching server performance 24/7. Even if it was feasible, that wouldn’t be a an enviable existence! That’s where database alerts come in. An alert is raised when a threshold value for a System Monitor counter has been reached. For example, you could create an alert that is raised when the number of deadlocks exceeds a specific value. In response to the alert, Navicat Monitor’s built-in Alert feature notifies you before bigger problems arise to ensure your databases are constantly available and performing in optimal capacity. Notifications can be sent via email, SMS or SNMP whenever a warning or critical condition occurs in your infrastructure.
After an alert has been raised, Navicat Monitor provides advanced root cause analysis that enables you to drill down and find more in-depth information when an issue is found – server metrics, performance statistics, hardware usage, and historical data. You can also monitor your alerts in the Alert Details screen, which provides an overview of the selected alerts that comprises its summary, timeline, metric charts, and more.
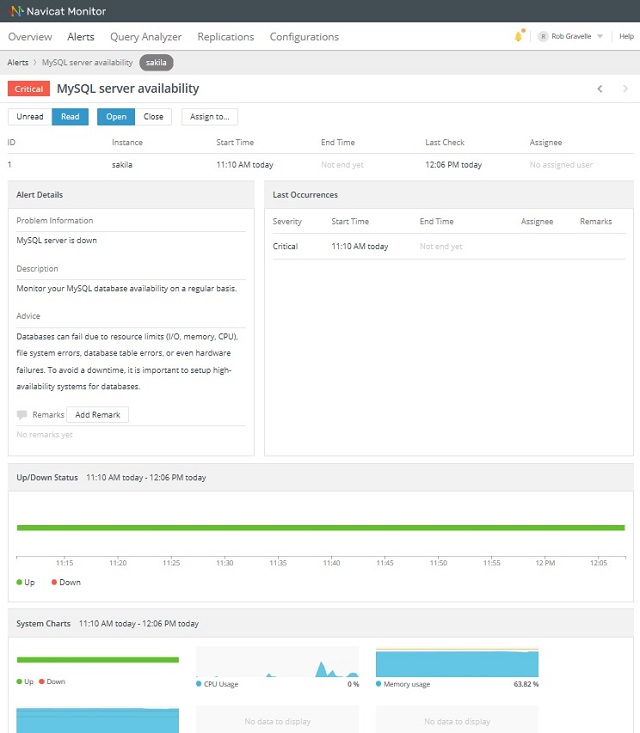
Navicat Monitor Alerts - Query Analyzer
The query analyzer monitors queries in real time to quickly improve the performance and efficiency of your server. It shows the summary information of all executing queries and lets you easily uncover problematic queries, for instance:
- identifying top queries with cumulative execution time count
- slow queries with unacceptable response time
- detecting deadlocks when two or more queries permanently block each other
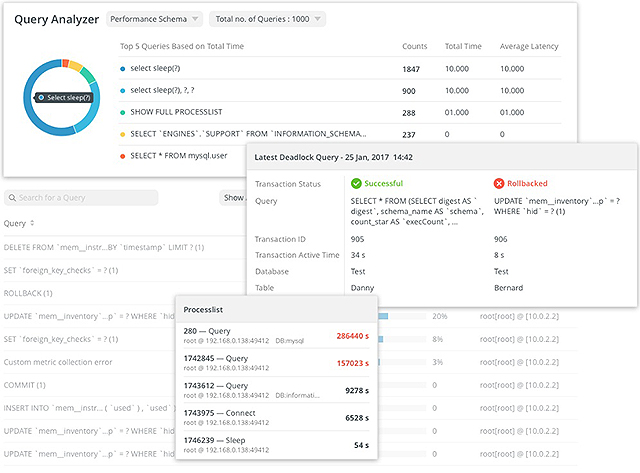
Query Analyzer - Reporting
In addition to collect metrics of multiple instances on the same chart to compare and analyze data, Navicat Monitor can also generate professional reports at lightning speed. You can also save your report as a high-quality PDF document via the PDF button.
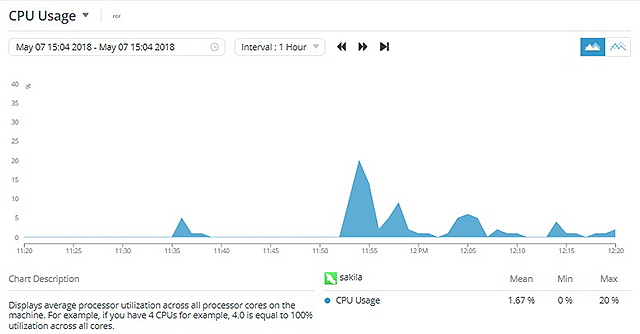
Reporting - Replication
Monitoring a replication topology is an important aspect of deploying replication. Because replication activity is distributed, it is essential to track activity and status across all computers involved in replication.
Using Navicat Monitor, you can apply schematic diagrams to visually represent the relationship between master servers and slaves. You can monitor the overall health of a replication topology as a whole, each individual node, and each replication subsystem to make sure the data on the replicated servers is always up to date.
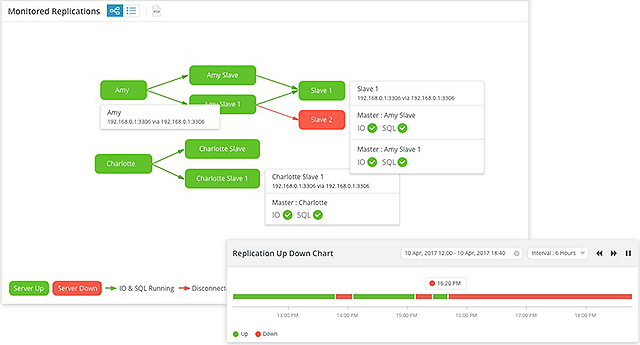
Monitored Replications - Manage Users and Roles
Navicat Monitor allows the creation of local users, or external users using LDAP or AD authentication, along with their access rights and restrictions by assigning roles to users. You can customize the pre-defined roles to best fit your needs or create new roles with customized privileges settings to restrict access to selected pages in Navicat Monitor.
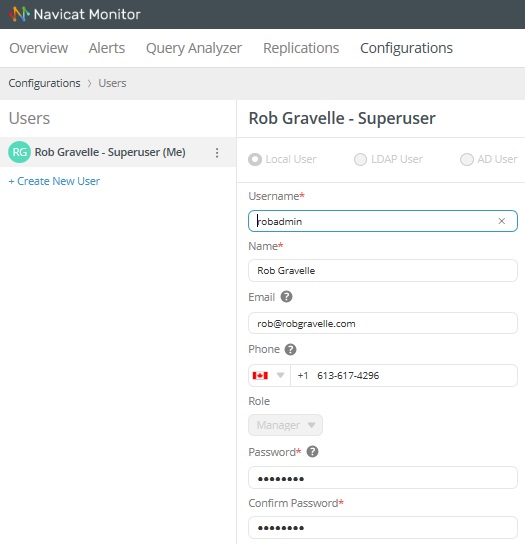
Manage Users and Roles
- Instances Management
Organize your servers into groups to make it easier for users to find them by category. Assign users to specific groups as members and apply the same alert configuration settings to them with minimal effort. All members will get notified when an alert is raised.
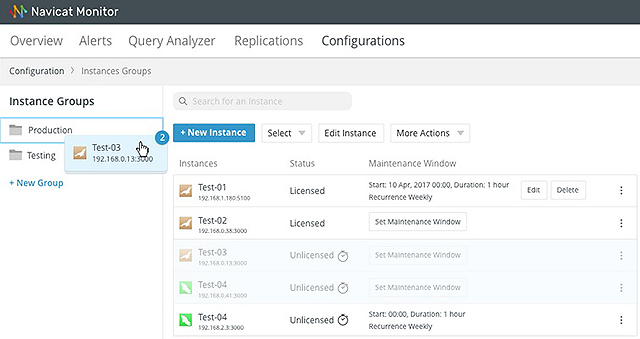
Instances Management - Export Monitor Settings
Exporting Navicat Monitor settings can be useful if you want to migrate an application server or for backup purposes. The exported zip file includes Token Keys, Instance Settings, Repository Database Settings and all the files necessary for the restoration.

Export Monitor Settings