MMS • RSS
Amazon DynamoDB is a serverless, NoSQL, fully managed database service that delivers single-digit millisecond latency at any scale.
In provisioned mode of DynamoDB, you pay for the capacity you provision, regardless of actual usage. The percentage of consumed capacity relative to provisioned capacity is known as throughput utilization.
In this post, we demonstrate how to evaluate throughput utilization for DynamoDB tables in provisioned mode. Understanding this metrics helps you determine whether switching to on-demand mode is the right choice. Moving to on-demand mode, where you pay-per-request for throughput, can optimize costs, eliminate capacity planning, minimize operational overhead, and enhance overall user experience for your applications.
Overview
DynamoDB supports two throughput modes: on-demand and provisioned.
- On-demand mode charges per request, automatically scaling without requiring capacity planning or auto scaling management.
- Provisioned mode lets you specify the required read and write capacity per second for your application.
In November 2024, we announced a 50% price reduction on DynamoDB on-demand throughput and up to 67% off global table throughput. With this announcement, you can now enjoy the power and flexibility of DynamoDB while being more cost-effective, scaling down to zero, and focusing more resources on driving innovation and growth.
If you were already using on-demand mode, you may have a noticed a drop in your DynamoDB costs overnight when the billing changes were applied around November 1, 2024. One of the key advantages of DynamoDB is that new features and improvements can automatically benefit your applications as they’re released, without requiring manual database version upgrades. However, if you’re using provisioned mode, it’s important to analyze your read and write throughput consumption to determine if switching to on-demand mode is now more cost-effective. This post explains how to evaluate throughput utilization.
Throughput utilization
Throughput utilization is high when your consumed throughput is close to provisioned capacity. If you provision significantly more read or write capacity than actual usage, your throughput utilization is low, leading to unnecessary costs.
Tables with low throughput utilization can benefit from switching to on-demand mode, which offers automatic scaling and potential cost savings.
However, throughput utilization alone does not reflect operational overhead, such as capacity planning, auto scaling management, and regular configuration tuning in provisioned mode. When deciding whether to switch to on-demand mode, consider both throughput utilization and operational costs to make an informed decision.
Plotting throughput utilization
To plot throughput utilization, you can use Amazon CloudWatch metrics for each table or global secondary index (GSI). To plot throughput utilization, use the following instructions.
To access CloudWatch metrics, follow the steps:
- On the CloudWatch console, in the navigation pane, select All metrics.
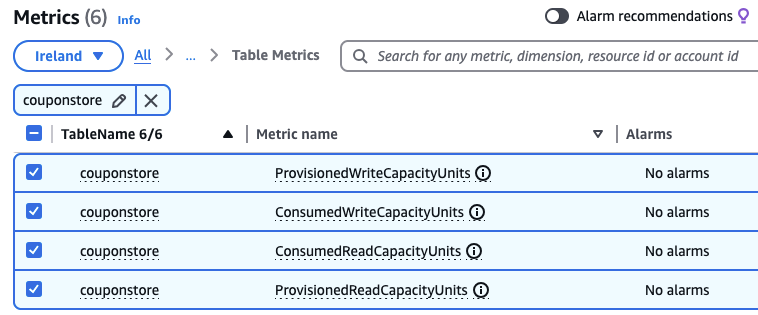
- Search for your table name, for example, couponstore. Choose DynamoDB and Table metrics.
- From the available list of metrics, select both the
Consumed*andProvisioned*metrics for Read and Write capacity. For example, selectProvisionedReadCapacityUnitsandConsumedReadCapacityUnitsfor Reads.
The following screenshot shows the selected read and write metrics for our sample table, couponstore.

To add math expressions, follow these steps:
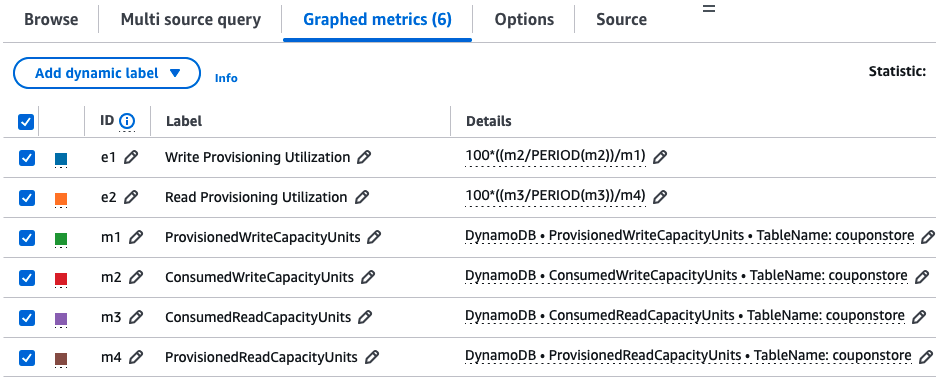
- In the Graphed metrics tab, choose Add math and Empty expression.
- Identify the ID of the
ConsumedWriteCapacityUnitsandProvisionedWriteCapacityUnitsmetrics (for example,m2andm1). - Add the following math expression for write throughput utilization:
- Repeat for read throughput. If the metrics are
m3andm4, the expression is:
The following screenshot shows the Graphed metrics screen with the math expressions:

To configure graph settings, follow these steps:
- On the top of the screen, set the time window to at least one month.
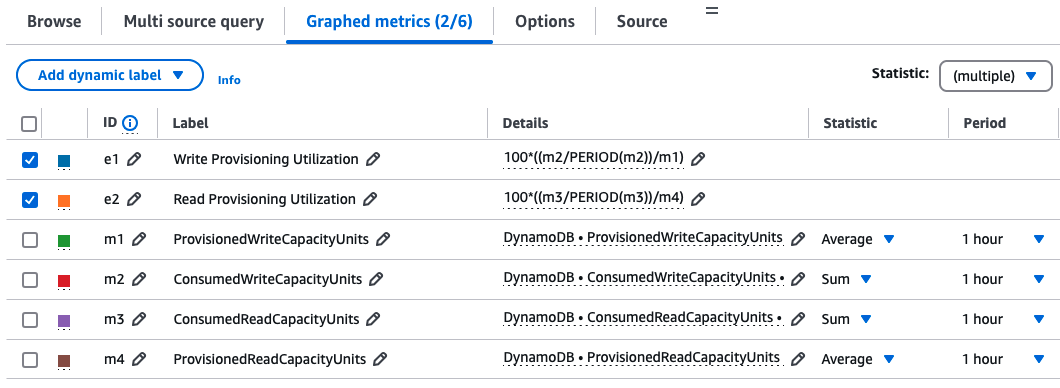
- On the Graphed metrics tab under Statistic, use the Sum statistic for
consumed*metrics and Average forprovisioned*metrics. - Adjust the Period to at least 1 hour. If analyzing historical data, use higher granularity if necessary.
- Disable (but don’t delete) the consumed and provisioned metrics to focus on the math metrics. These will represent your throughput utilization.
The following screenshot shows these settings.

Interpreting throughput utilization
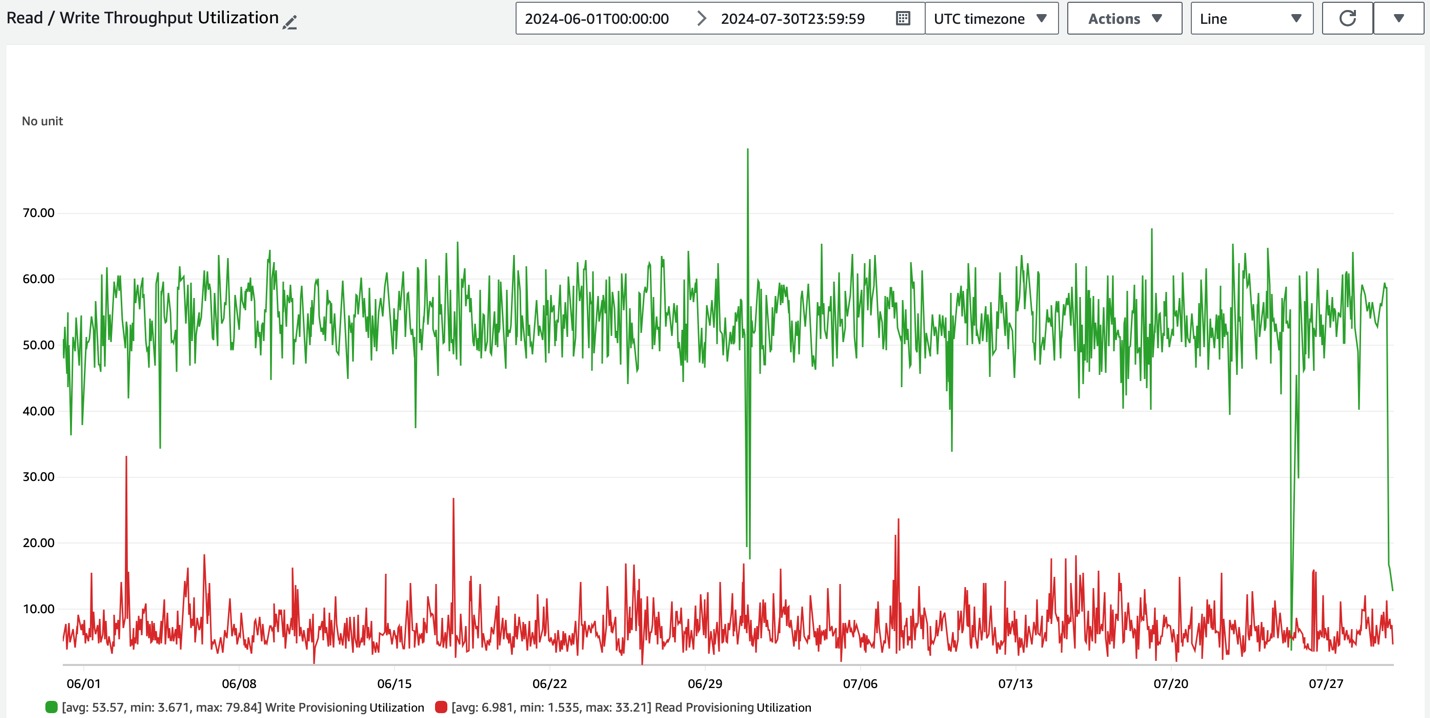
Throughput utilization is expressed as a percentage, ranging from 0% to 100%. For example, if the graph shows utilization ranging around 30%, it indicates that the table is generally over-provisioned by about 70%. Alternatively, if the utilization is around 60%, your workload has a 40% buffer.

When to switch to on-demand
To understand how to decide when to switch to on-demand, consider the following points:
Below 30% utilization:
- If the throughput utilization averages below 30% over a month (or consecutive months), switching to on-demand capacity mode is highly recommended. This change optimizes cost, reduces operational overhead, and improves scaling.
Between 30% and 45% utilization:
- If the average utilization is between 30% and 45%, switching to on-demand can still be beneficial, particularly from a total cost of ownership (TCO) perspective.
- This switch can reduce or eliminate throttling that could occur in provisioned mode.
- You’re no longer continually reviewing and managing auto scaling configurations. This gives you less operational overhead so you can focus more on building new functionality.
If utilization exceeds 45%, provisioned mode may be a suitable choice for the table, excluding total cost of ownership factors.
CloudWatch metric source code
You can also use the following CloudWatch metrics console configuration to calculate throughput utilization for your table or GSI.Use the following code for tables. Replace
with your table’s name.
Add the desired source code into the CloudWatch Metrics console. After replacing the table and GSI placeholders, choose Update to graph throughput utilization, as shown in the following screenshot.

Cleanup
Consider this a reminder to delete any temporary resources created while following this post. This includes DynamoDB tables, custom CloudWatch metrics, and CloudWatch dashboards.
Considerations
This analysis focuses on throughput utilization and doesn’t account for the total cost of ownership (TCO), such as personnel to manage resources and tune auto scaling configurations. It’s important to understand your TCO and evaluate whether switching to on-demand helps you optimize on the bottom line. Use these utilization graphs as a starting point for evaluating a switch to on-demand capacity mode.
We recommend plotting throughput utilization for 1 or more months in the past to get a trend view. Also, a CloudWatch metrics period of 1 hour or more can often smooth out any short bursts in provisioning and utilization. Consider changing the period of the metrics to higher granularity such as 1 minute, 5 minutes, or 15 minutes and observe the bursts the occur. On-demand capacity mode will certainly be beneficial for these spikes by design.
Conclusion
In this post, we demonstrated how to measure throughput utilization for your provisioned mode DynamoDB tables and GSIs. Evaluating your table’s utilization helps you make informed decisions about switching to on-demand mode optimizing costs, and reducing operational overhead.
If you’re looking for an automated way to analyze utilization across multiple tables, check out the metrics-collector tool open-sourced by my team.
To deepen your understanding of DynamoDB’s on-demand capacity mode and its potential benefits, read Demystifying Amazon DynamoDB on-demand capacity mode.
Did this post help you evaluate the appropriate capacity mode for your tables? Share your feedback in the comments!
About the Author