
MMS • RSS
Posted on nosqlgooglealerts. Visit nosqlgooglealerts
Amazon DynamoDB continuously sends metrics about its behavior to Amazon CloudWatch. With CloudWatch, you can track metrics such as each table’s provisioned and consumed read and write capacity, counts for the number of read and write throttle events, as well as average latencies of each type of call. Something I’ve heard customers ask for is how to get a count of successful requests of each operation type (for example, how many GetItem or DeleteItem calls were made) in order to better understand usage and costs. In this post, I show you how to retrieve this metric.
Default CloudWatch metrics
First, let’s look at what metrics are readily available. On the DynamoDB console, if you navigate to a particular table, the Monitor tab shows a long list of convenient metrics about that table pulled from CloudWatch. The following screenshot shows an example.

Retrieve a count metric
Imagine you find a period of elevated read consumption. You can expand the graph of read usage to show the Read Capacity Units (RCUs) consumed per second (displayed in the following screenshot on a per-minute period).
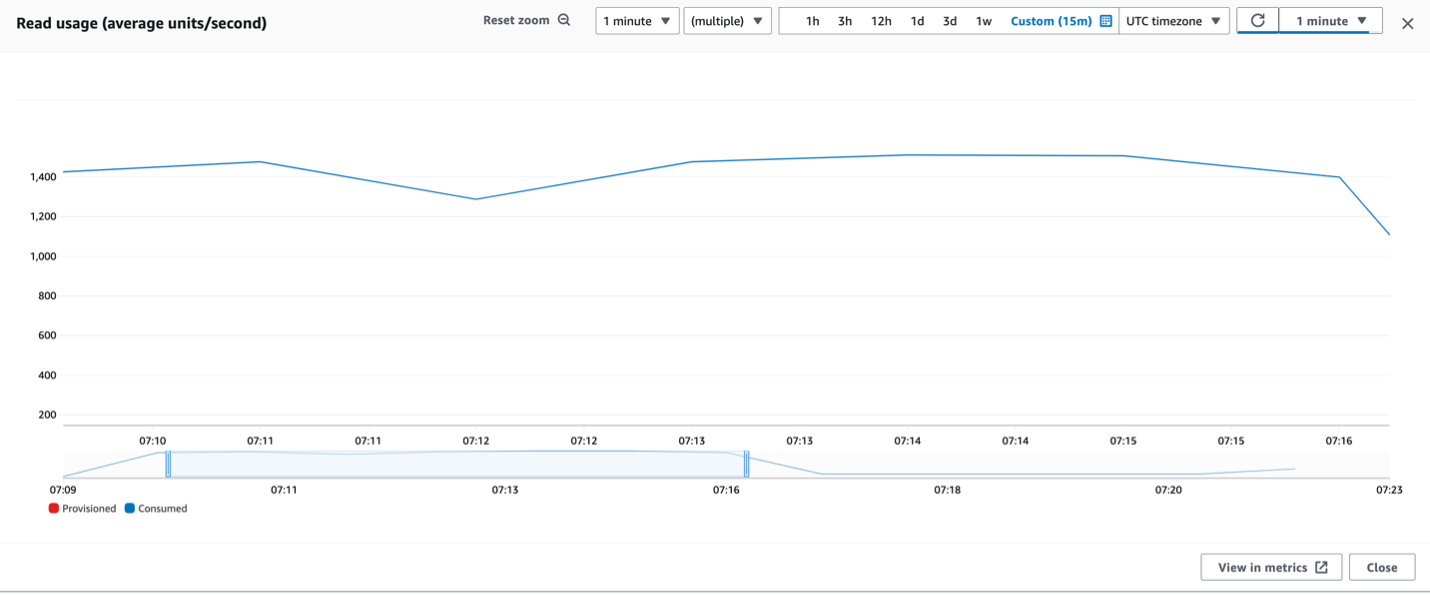
The Read usage graph shows the consumption rate that matters for pricing, but doesn’t show how many requests were being made during each period or what type they were. How many GetItem, BatchGetItem, Query, or Scan calls were happening? One graph that gets close is the average latencies for each operation type. The following screenshot shows the average Get latencies for GetItem and BatchGetItem calls during the period in question.
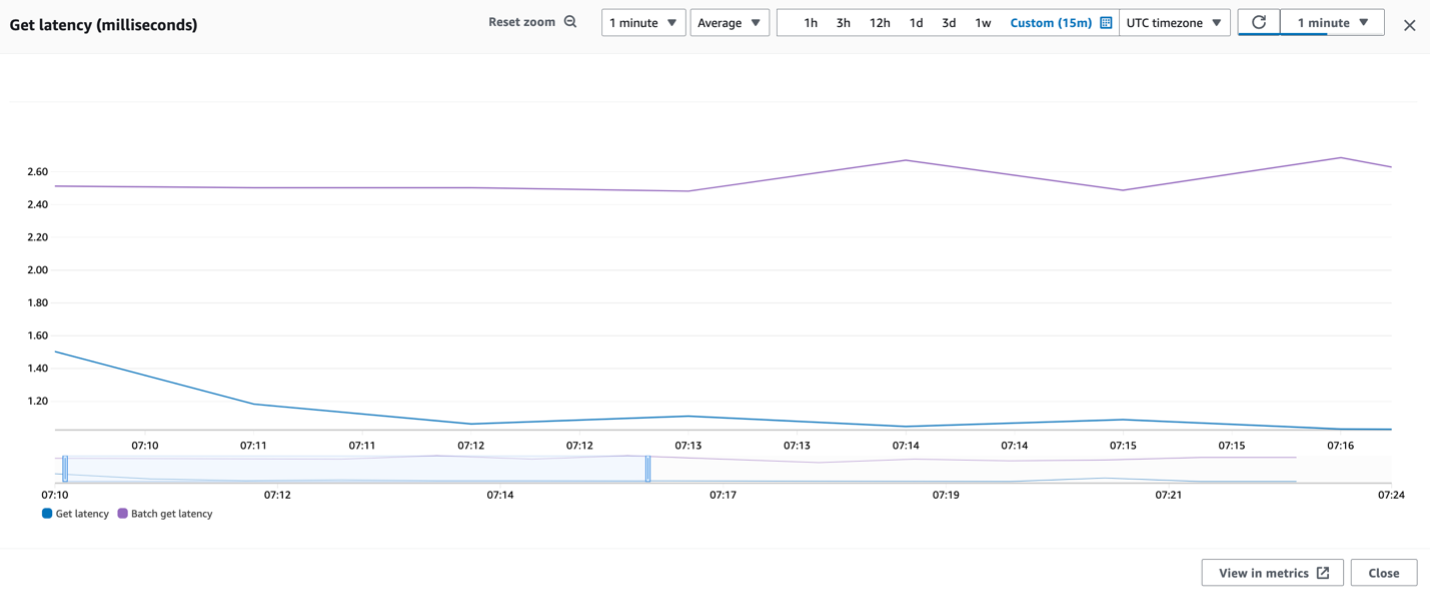
You can convert this average latency metric to a count metric by changing the statistic in the top center from Average to Sample count. This provides you with how many latency samples were gathered in each time period, which for our purposes is perfect because that matches how many successful GetItem and BatchGetItem calls were made. It’s now a successful request count graph. The following screenshot shows the adjusted graph. Ignore the top left still saying it’s in milliseconds, because by changing the statistic we’ve changed the units from “average milliseconds of latency” to “number of latency measurements”, which provides the number of requests.
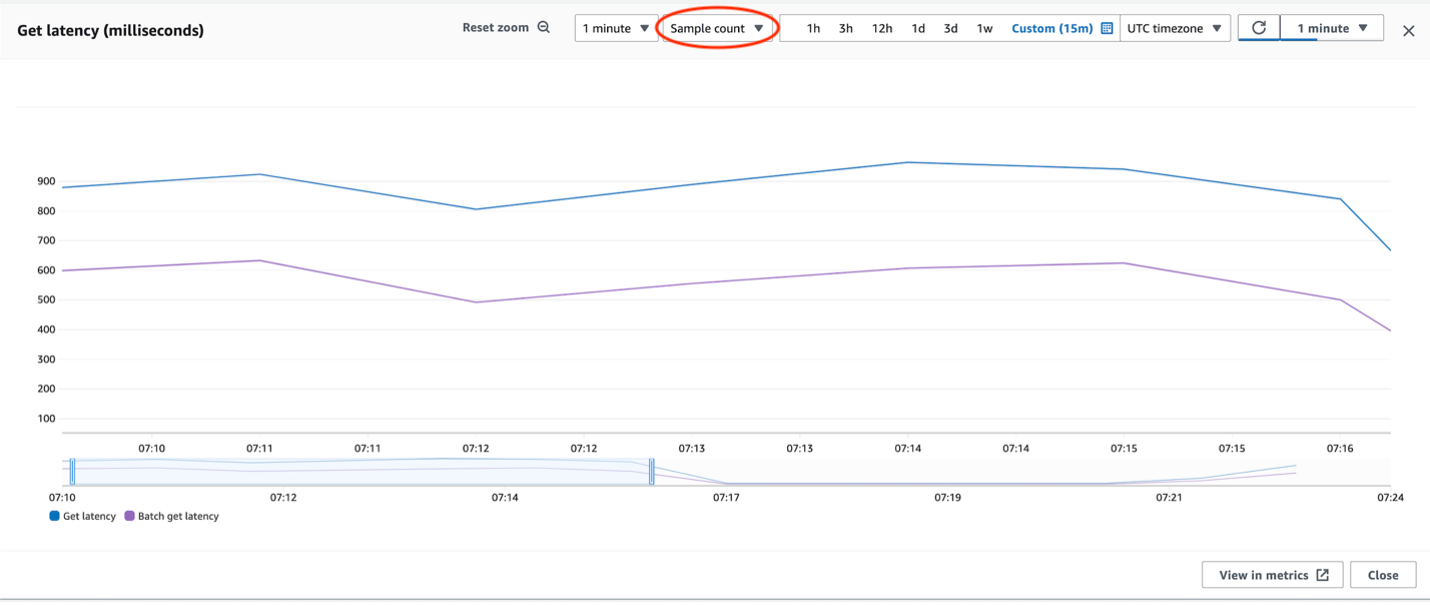
This simple adjustment gives you a way to track the number of successful calls per operation type per time period.
A note about time periods: The most granular time period available for DynamoDB CloudWatch metrics is a one minute period. A metric that reports usage or requests “per second” is showing an inferred per second rate based on the larger time period. This means if you see 1,000 requests per second on a one minute period, what that technically means is there were 60,000 requests during the minute. More historic CloudWatch data tends to be aggregated into periods of 5 or 15 minutes.
CloudWatch dashboard
You can create a CloudWatch dashboard that shows the count of each operation type for a given table. A CloudWatch dashboard is a customizable page on the CloudWatch console that you can use to monitor your resources in a single view. The definition of a dashboard can be based on a JSON file, which is viewable and editable on the Actions menu, as shown in the following screenshot.
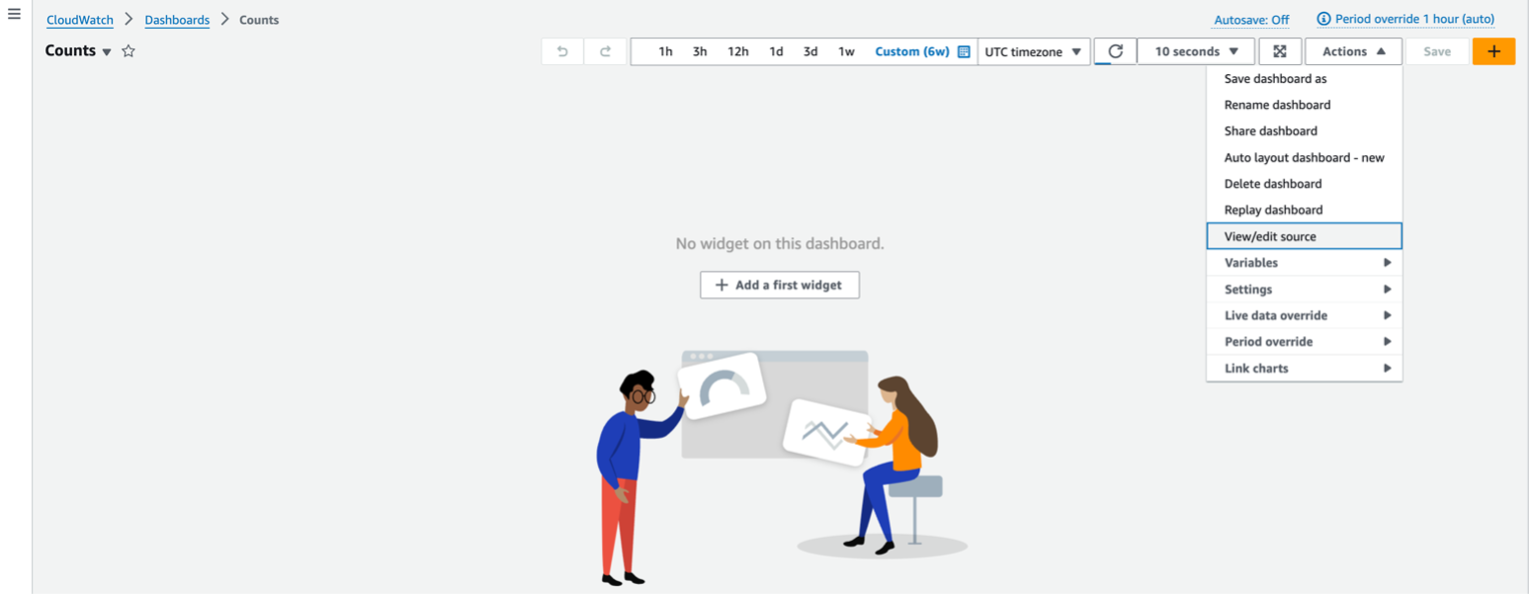
The following example JSON dashboard definition displays request counts for all standard operation types for a given table. To use it, adjust the code to provide your table name and AWS Region if not us-east-1. Then in CloudWatch Dashboards, you can create a new dashboard, provide a name, cancel out adding a widget, and on the Actions menu, choose View/edit source and provide your modified JSON as the source.
The resulting dashboard then looks like the following screenshot.
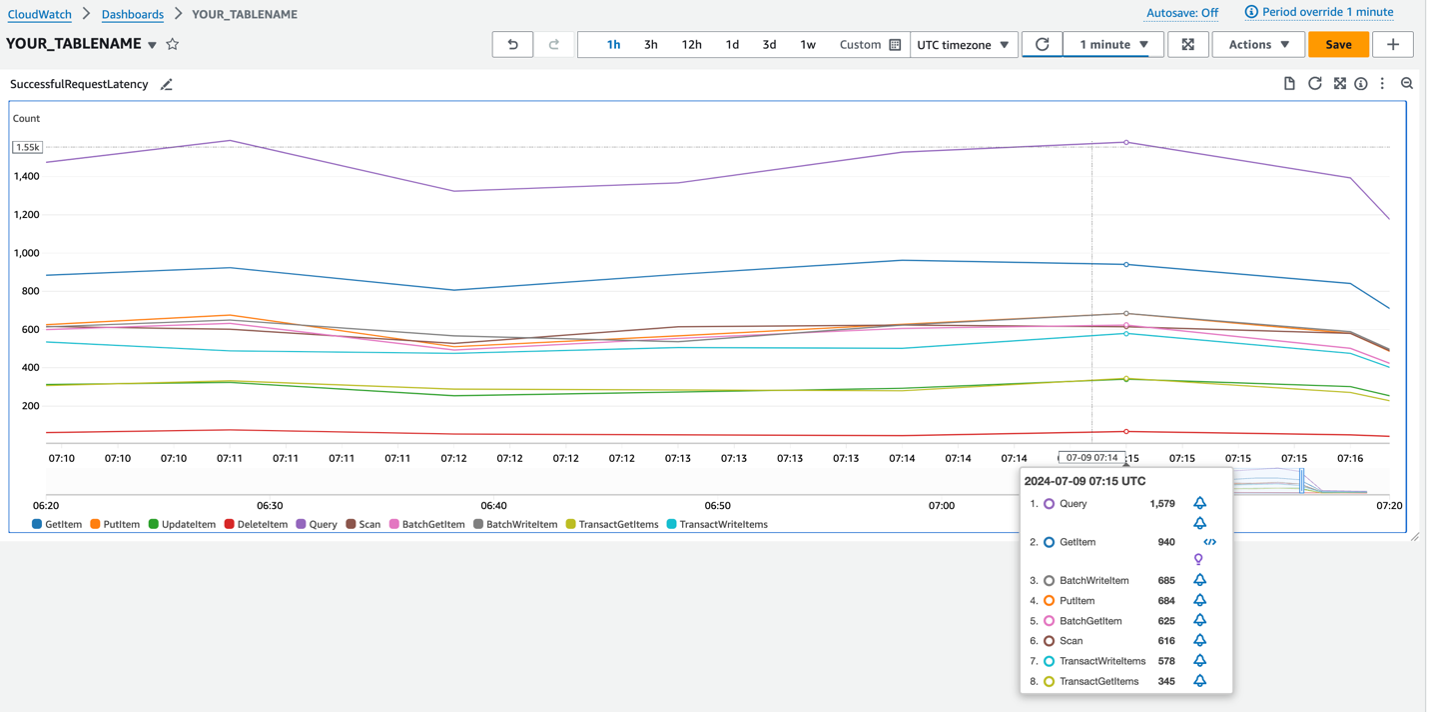
You can experiment with changing the Period (available under the Actions menu) to control the granularity. Remember, you can’t go finer grained than 1 minute and for historic data may need a 5 or 15 minute period.
You can add expressions to the Dashboard to show total reads, total writes, and total requests to the graph, as shown in the following expanded JSON.
Clean up
Custom dashboards incur a small cost per month, although the first few are free, so be sure to delete any custom dashboards you’re not using. You can delete a custom dashboard the same way you created it, via the Console or command line.
Conclusion
In this post we demonstrated how to track DynamoDB operation counts in CloudWatch using the latency metric and adjusting the statistic from Average to Sample count. We’ve provided steps to configure the metric and provided a CloudWatch dashboard source JSON file to track all operation counts in a given table. The following 2.5 minute video shows a screen recording walking you through the process.
Try it out with your own DynamoDB tables, and let us know your feedback in the comments section. You can find more DynamoDB posts and others posts written by Jason Hunter in the AWS Database Blog.
About the Author
 Jason Hunter is a California-based Principal Solutions Architect specializing in Amazon DynamoDB. He’s been working with NoSQL databases since 2003. He’s known for his contributions to Java, open source, and XML.