MMS • RSS
Posted on nosqlgooglealerts. Visit nosqlgooglealerts
Amazon DynamoDB is a fast NoSQL, fully managed, serverless database that enables you to develop modern applications at any scale. DynamoDB delivers consistent single-digit millisecond latency at any scale for single item read and write requests.
Amazon DynamoDB Accelerator (DAX) is a fully managed, in-memory cache for DynamoDB. By using DAX with DynamoDB, you can improve the latency for read requests in your application. Applications that perform more reads than writes to a database are generally called read-heavy applications. Examples include ecommerce websites, social media applications, and news media websites. Use of DAX can also reduce the cost of read operations on your DynamoDB tables when it is used for read-heavy applications.
In this post, we discuss how to improve latency and reduce cost when using DynamoDB for your read-heavy applications.
Improve latency with DAX
In computing, latency refers to the amount of time that passes after sending a request before a response is received. With DynamoDB, you can achieve single-digit millisecond latency at any scale. For more information, see Understanding Amazon DynamoDB latency. For applications that require lower latency, you can use DAX to further reduce read latency.
Latency comparison with and without DAX
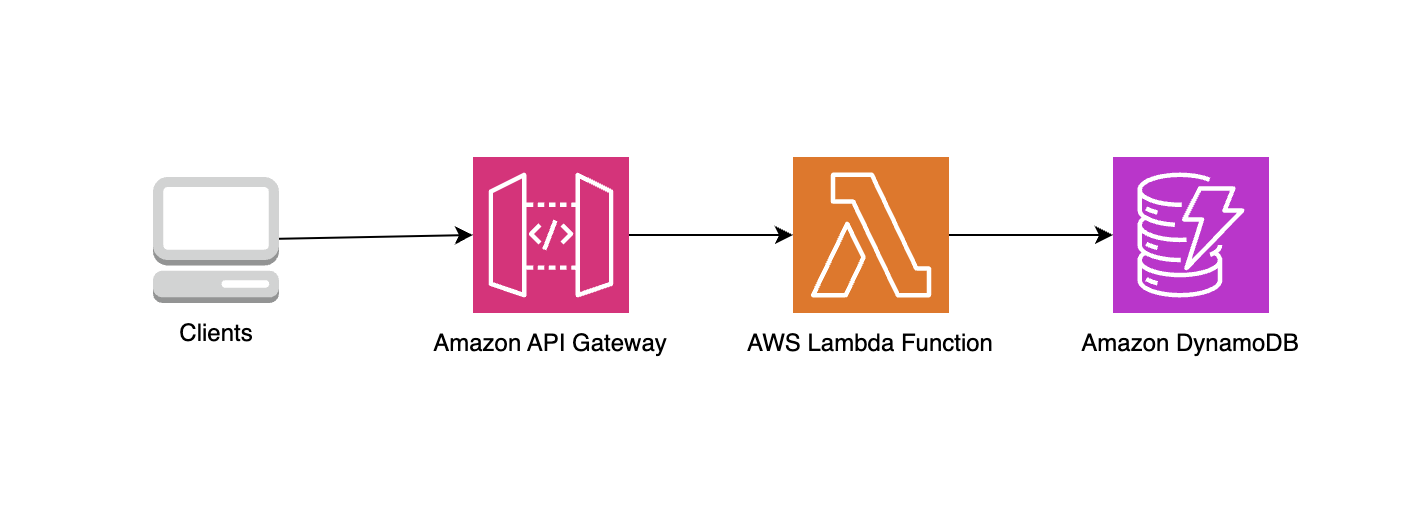
Let’s illustrate the benefits of DAX with an application that reads data from DynamoDB for an ecommerce website; we’ll call it the product service. The service uses Amazon API Gateway (API Gateway), AWS Lambda and DynamoDB, as shown in the following diagram.
We ran tests to simulate up to 8,500 read requests per second from the product service to DynamoDB. Our tests used a DynamoDB table initialized with 4K product items evenly spread across 20 product categories. For every request sent to the product service, 1 of 4K items or 1 of 20 product categories was randomly selected. Test requests from clients to the product service were gradually ramped up from 0 requests per second to approximately 8,500 requests per second and back down to 0 requests per second during a 10-minute period.
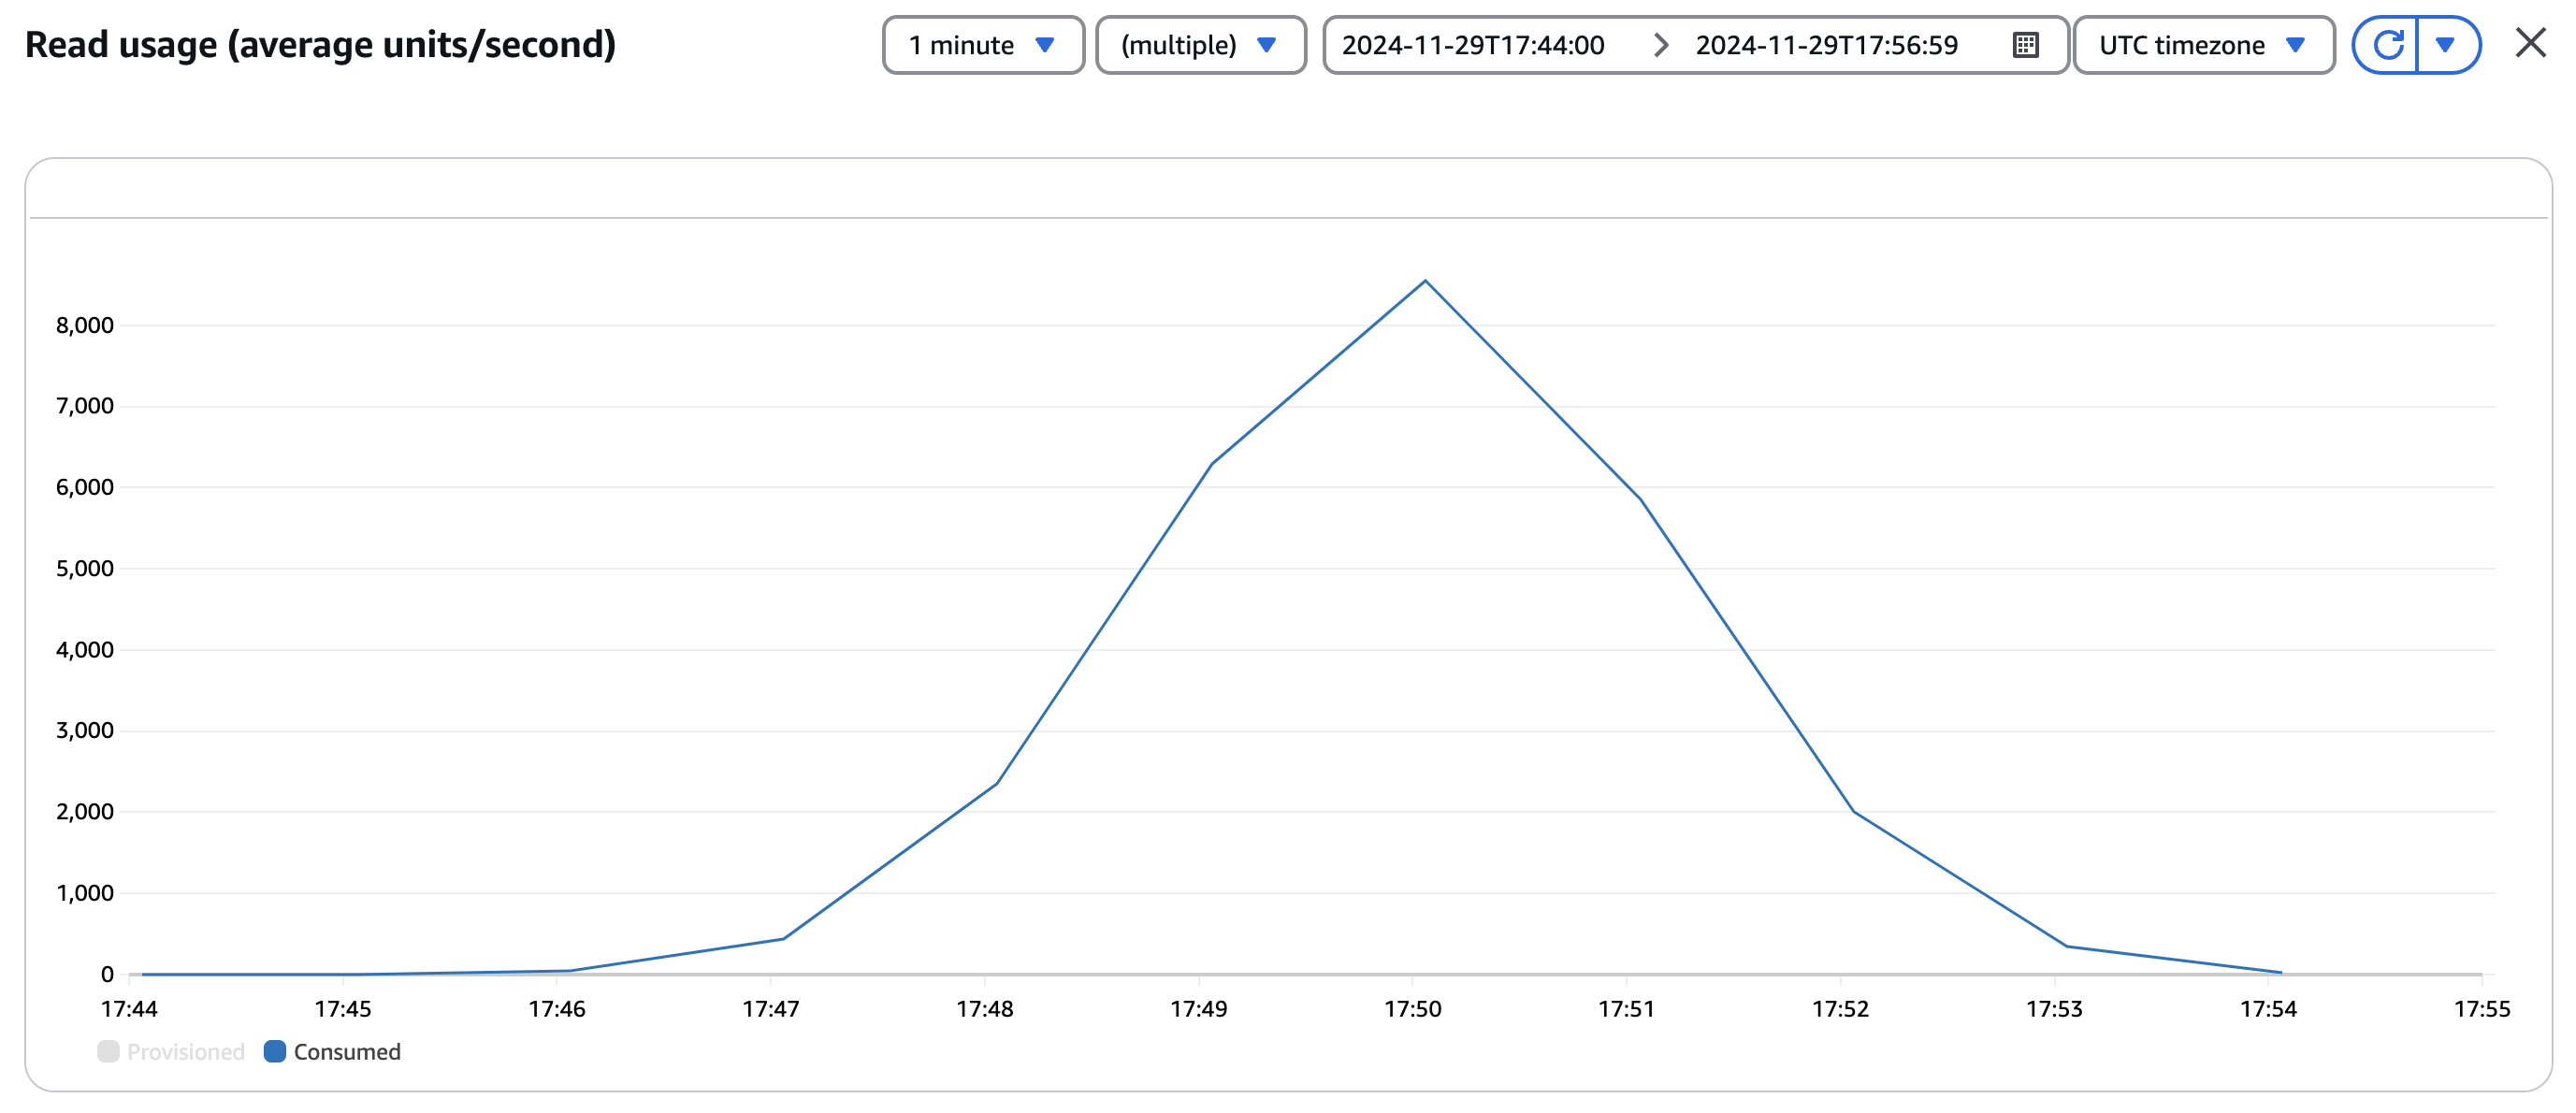
The following screenshot shows the average read capacity units (RCUs) consumed on DynamoDB. We can see RCUs consumption increase from 0 to about 8,500 requests per second during the first half of the tests, then from 8,500 back to 0 requests per second during the second half of the test.
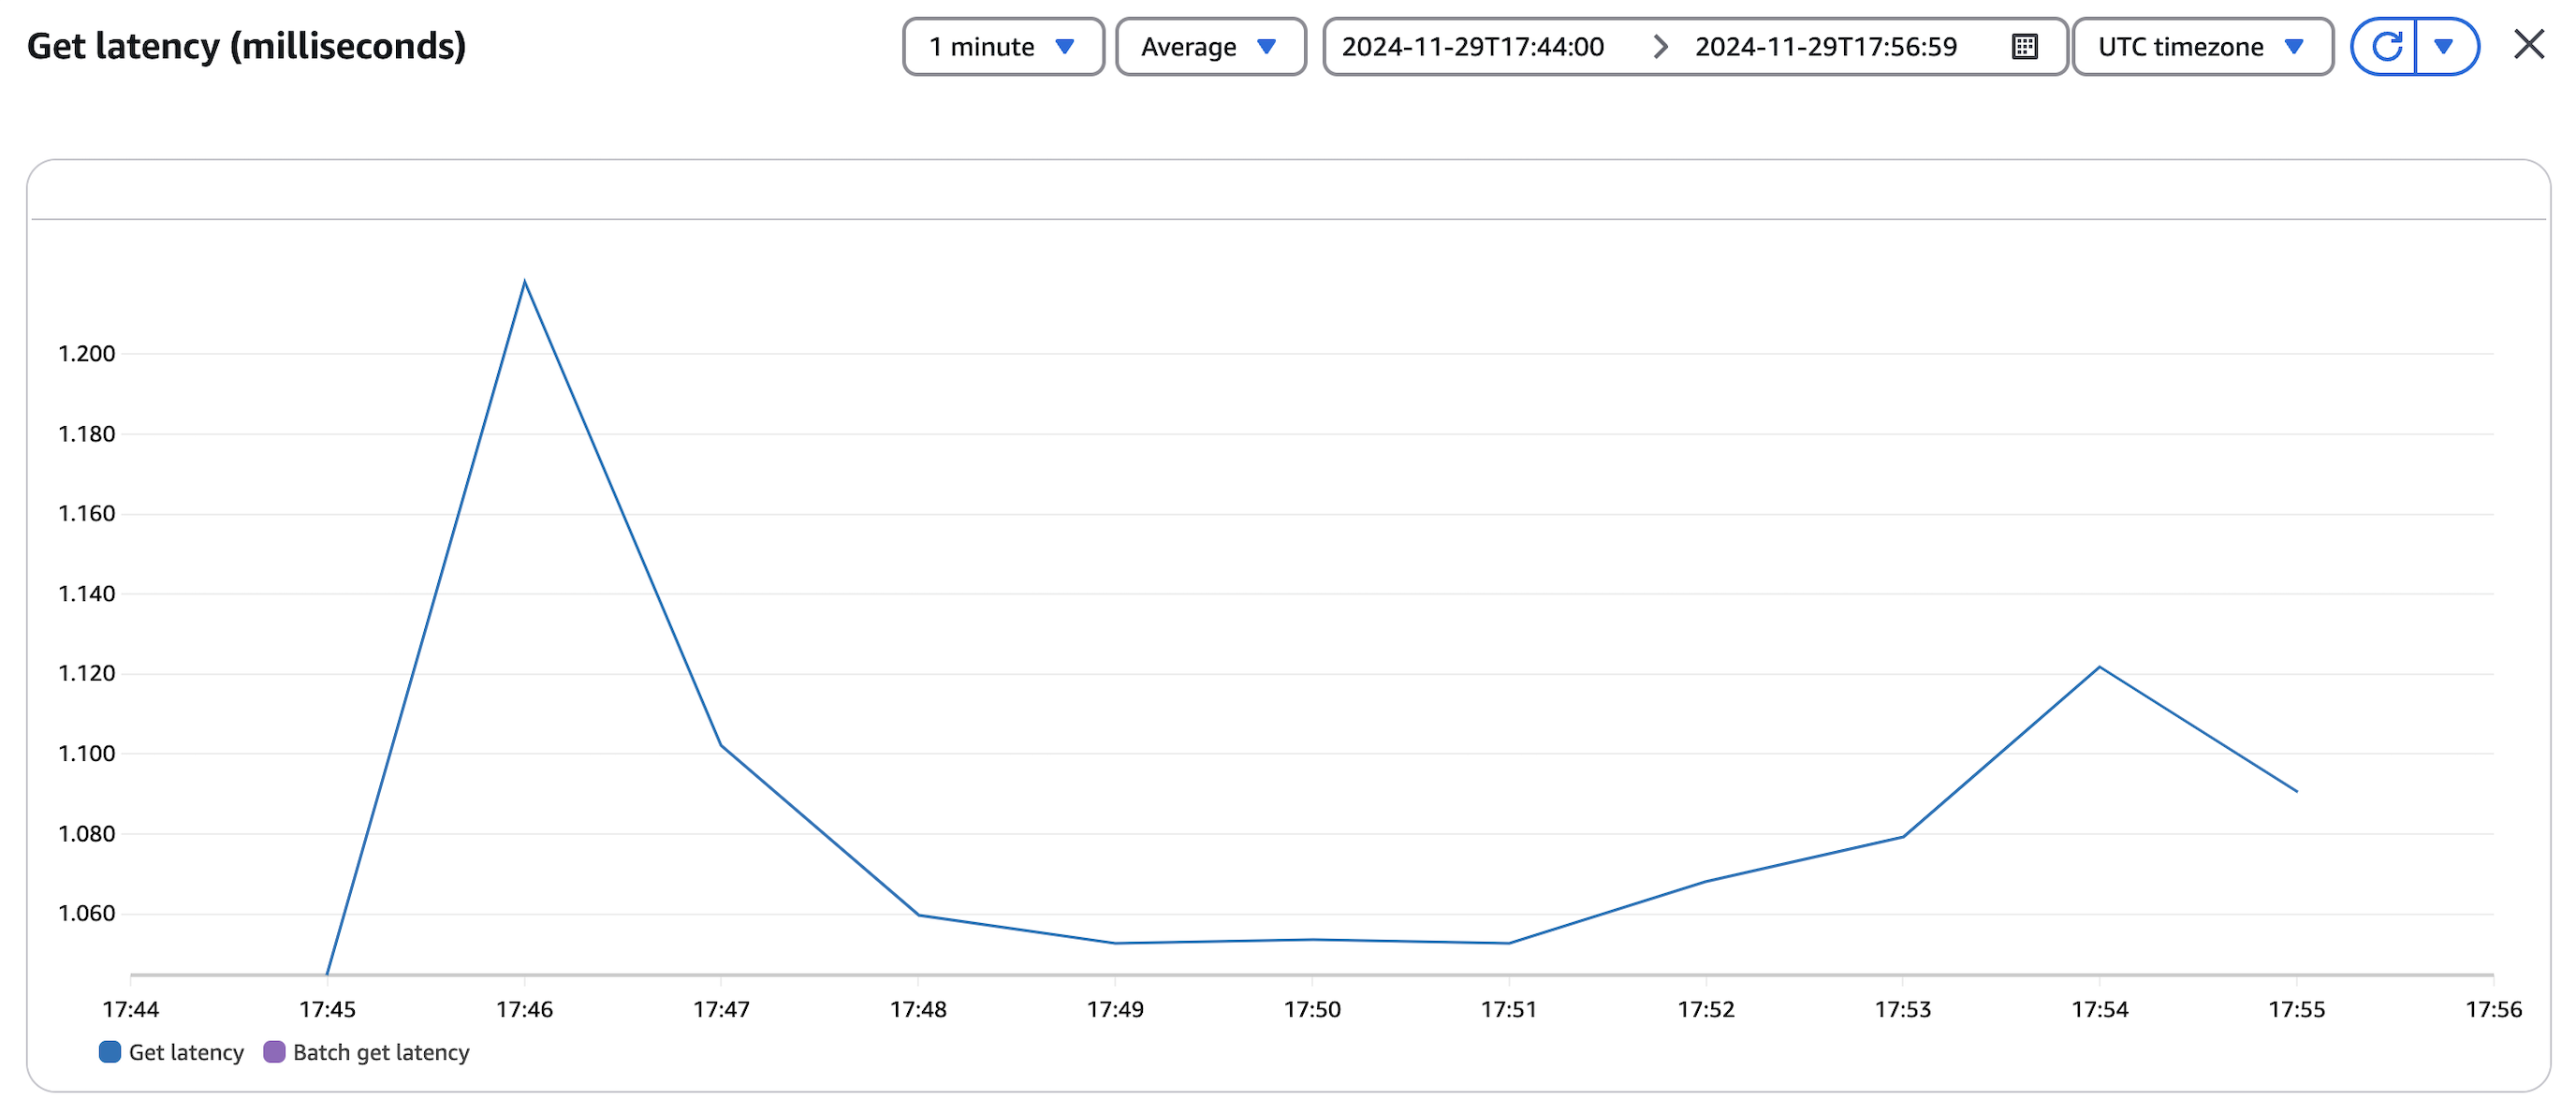
The following screenshot shows the average latency retrieving a single item from DynamoDB. We can see that latency varied between 0.95 and 1.30 milliseconds during the test.
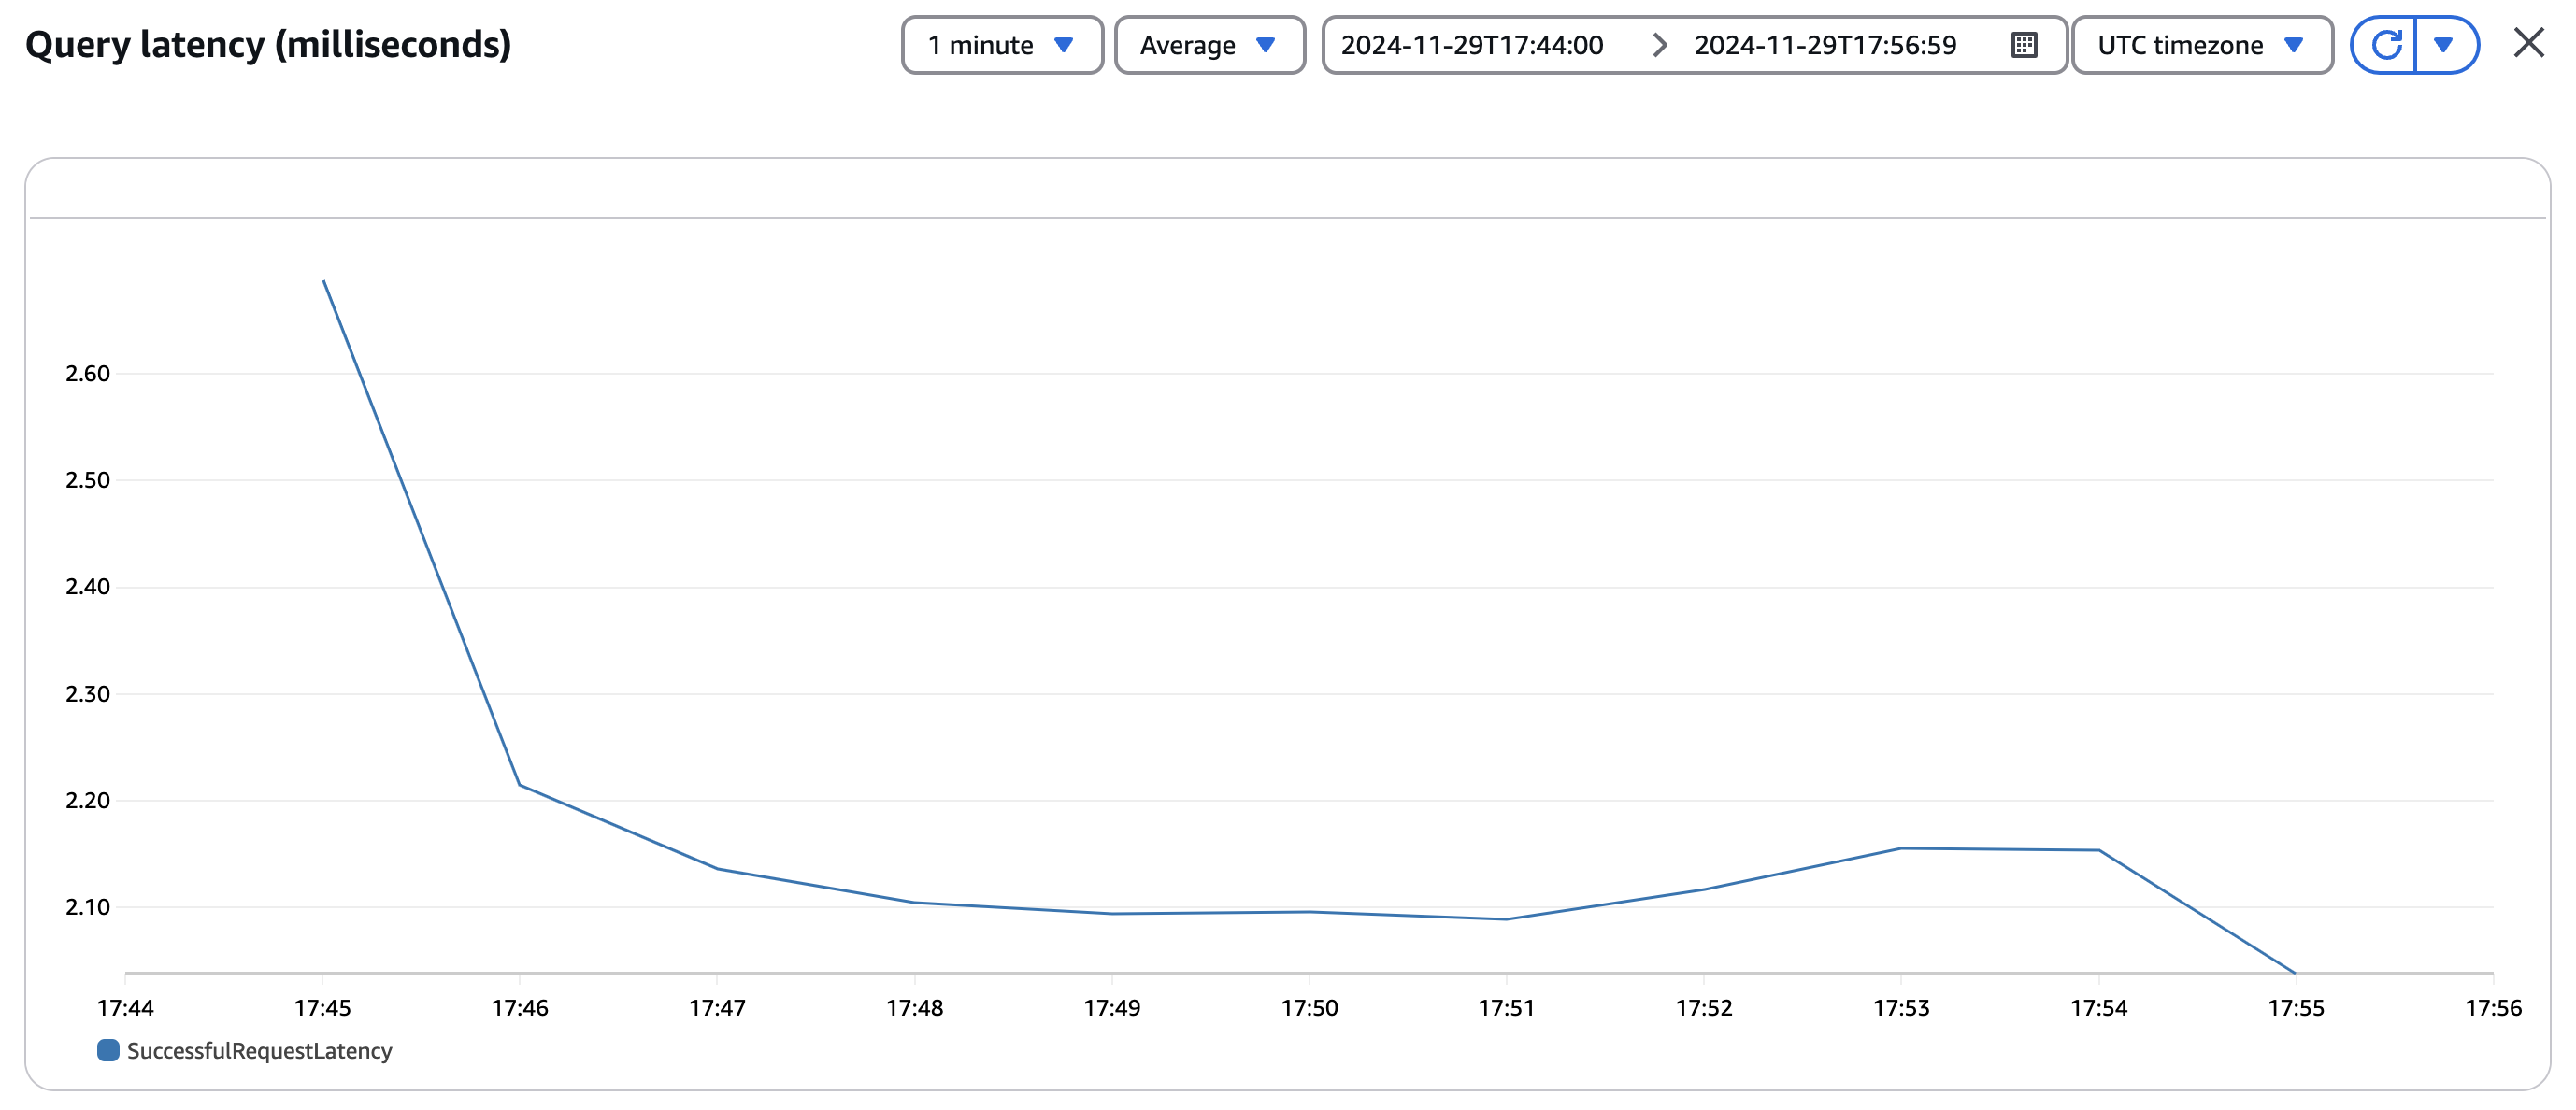
The following screenshot shows the average latency retrieving a list of items in the same product category from DynamoDB. We can see that latency varied between 2 and 3 milliseconds during the test.
The following table shows the latency, in milliseconds, of the product service from our tests.
| Requests |
99th Percentile (ms) |
Average (ms) |
| All Requests |
92 |
51 |
| GetSingleProduct |
80 |
47 |
| GetListOfProducts |
100 |
54 |
The tests show that most requests to retrieve a single item from the product service, that is GetSingleProduct requests, had a latency of 80 milliseconds or less. Most requests to retrieve a list of items from the product service, that is GetListOfProducts requests, had a latency of 100 milliseconds or less.
Let’s add DAX to the product service to see the impact on the average RCUs consumed and the latency.
DAX is API-compatible with DynamoDB, so you only need to make a few changes to your application to start reaping the benefits of an in-memory cache. We made the following changes to the product service to implement DAX:
- Initialize a DAX client resource using the DAX cluster endpoint
Amazon DAX client is currently supported for Java, Node.js, .NET, Python and Go programming languages.
The following diagram illustrates the updated product service.
We ran the test again after implementing DAX. There was a 19% reduction in the average latency for GetSingleProduct requests and there was a 15% reduction in the average latency for GetListOfProducts requests.
DAX does not publish a latency metric for get item or query item requests. To observe the latency improvement for calls to the database, we measured the duration of each API request to DynamoDB and DAX as shown in the code snippet below.
The following screenshot shows the average duration for retrieving single items directly from DynamoDB. We see that the step to retrieve an item from DynamoDB completes in approximately 2.4 milliseconds.
The following screenshot shows the average duration when retrieving single items from DynamoDB when DAX is in use. This time, the step to retrieve a single item completes in approximately 0.6 milliseconds.
The following table shows the latency, in milliseconds, of the product service from our tests.
| Requests |
99th Percentile (ms) |
Average (ms) |
| All Requests |
83 |
42 |
| GetSingleProduct |
71 |
38 |
| GetListOfProducts |
91 |
46 |
The performance improvement from using DAX is dependent on the effectiveness of your cache. Repeated retrieval of the same set of items will result in more cache hits and fewer requests to DynamoDB as shown in the following illustration.
Retrieval of a diverse set of items will result in fewer cache hits and more requests to DynamoDB as shown in the following illustration where the differently colored arrows represent different items being retrieved.
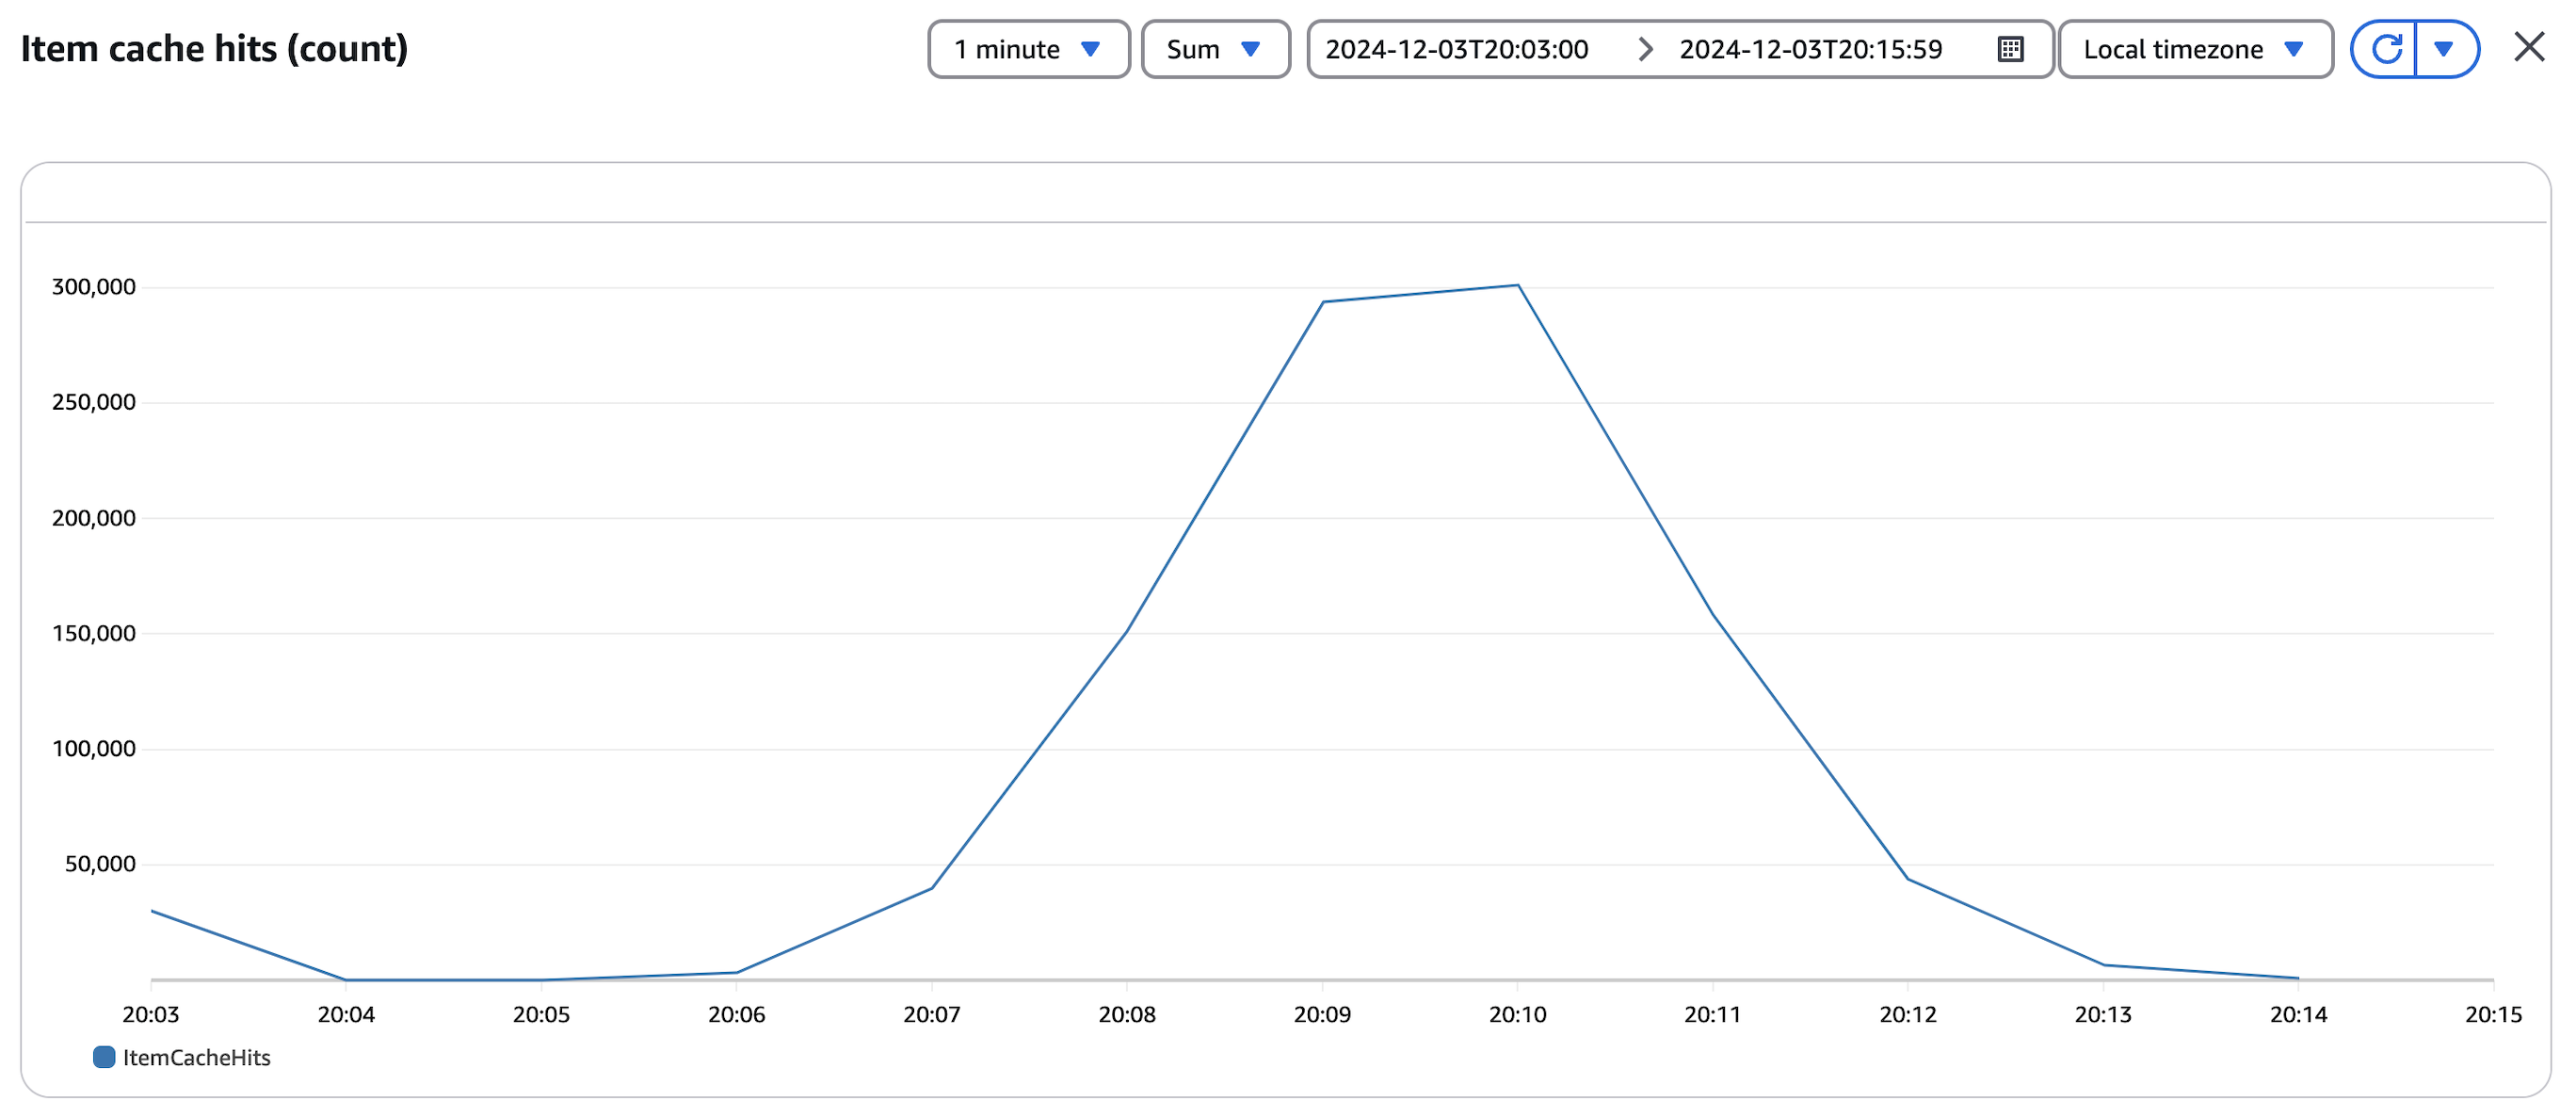
The following screenshot shows the item cache hits from our tests. We can see that as the number of requests to DAX increased, the number of cache hits on the DAX item cache increased to around 300,000 hits then it ramped down to 0 hits during the second half of the test.
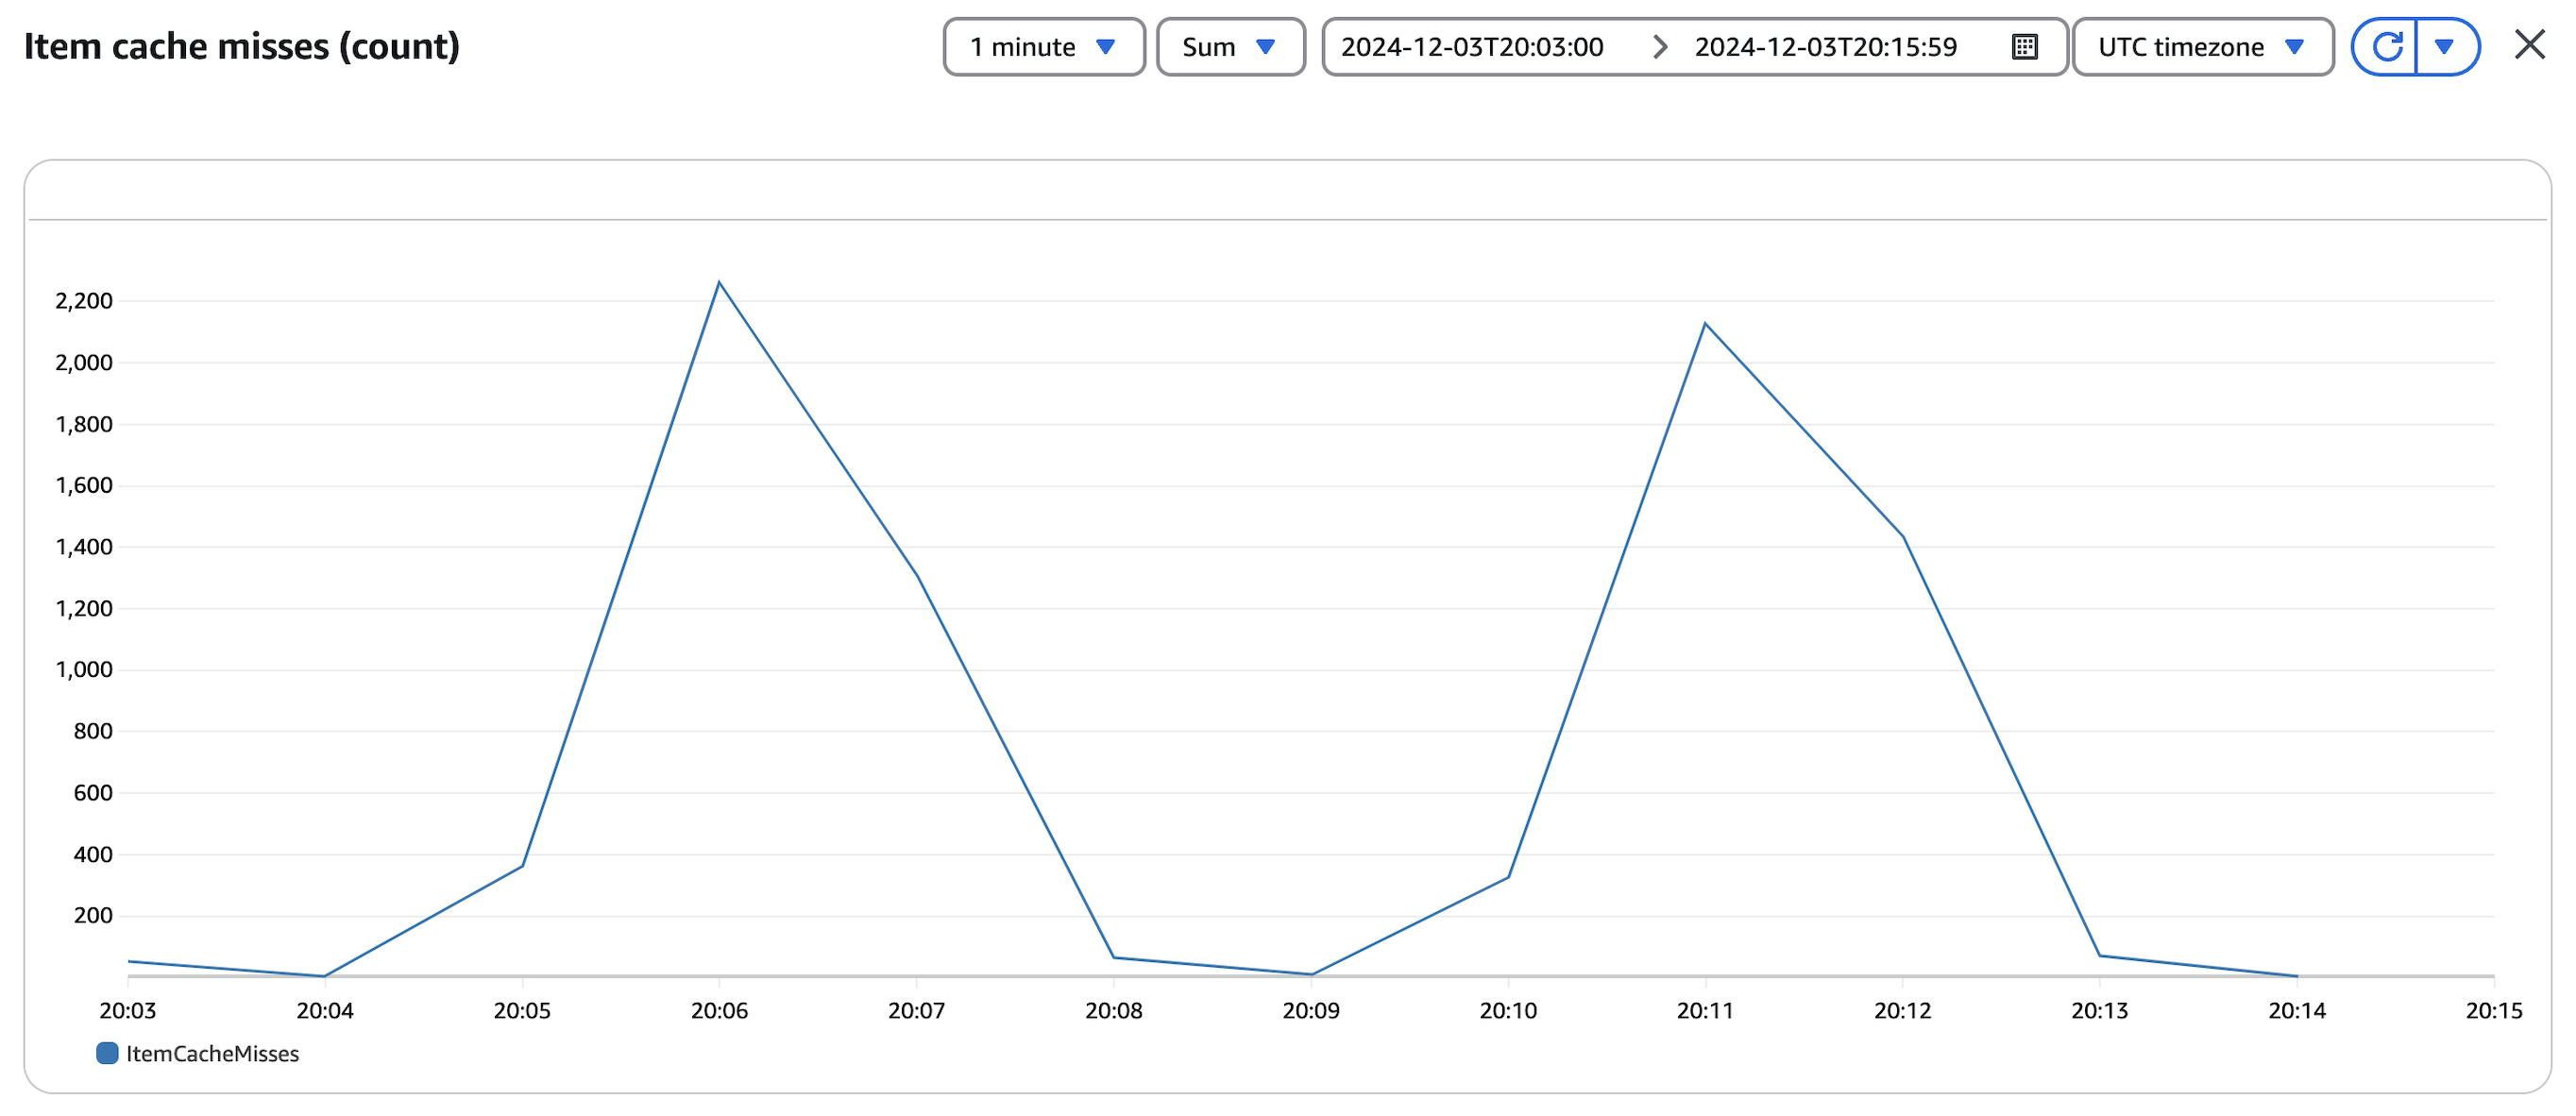
The following screenshot shows the item cache misses from our tests. We can see that as the item cache hits increased in the previous graph, there were fewer cache misses for requests from the product service.
Requests to retrieve a list of items, that is GetListOfProducts, had fewer cache misses during our tests because the smaller set of categories in our test data, that is 20 categories, results in the same set of items being retrieved multiple times even though they are retrieved at random.
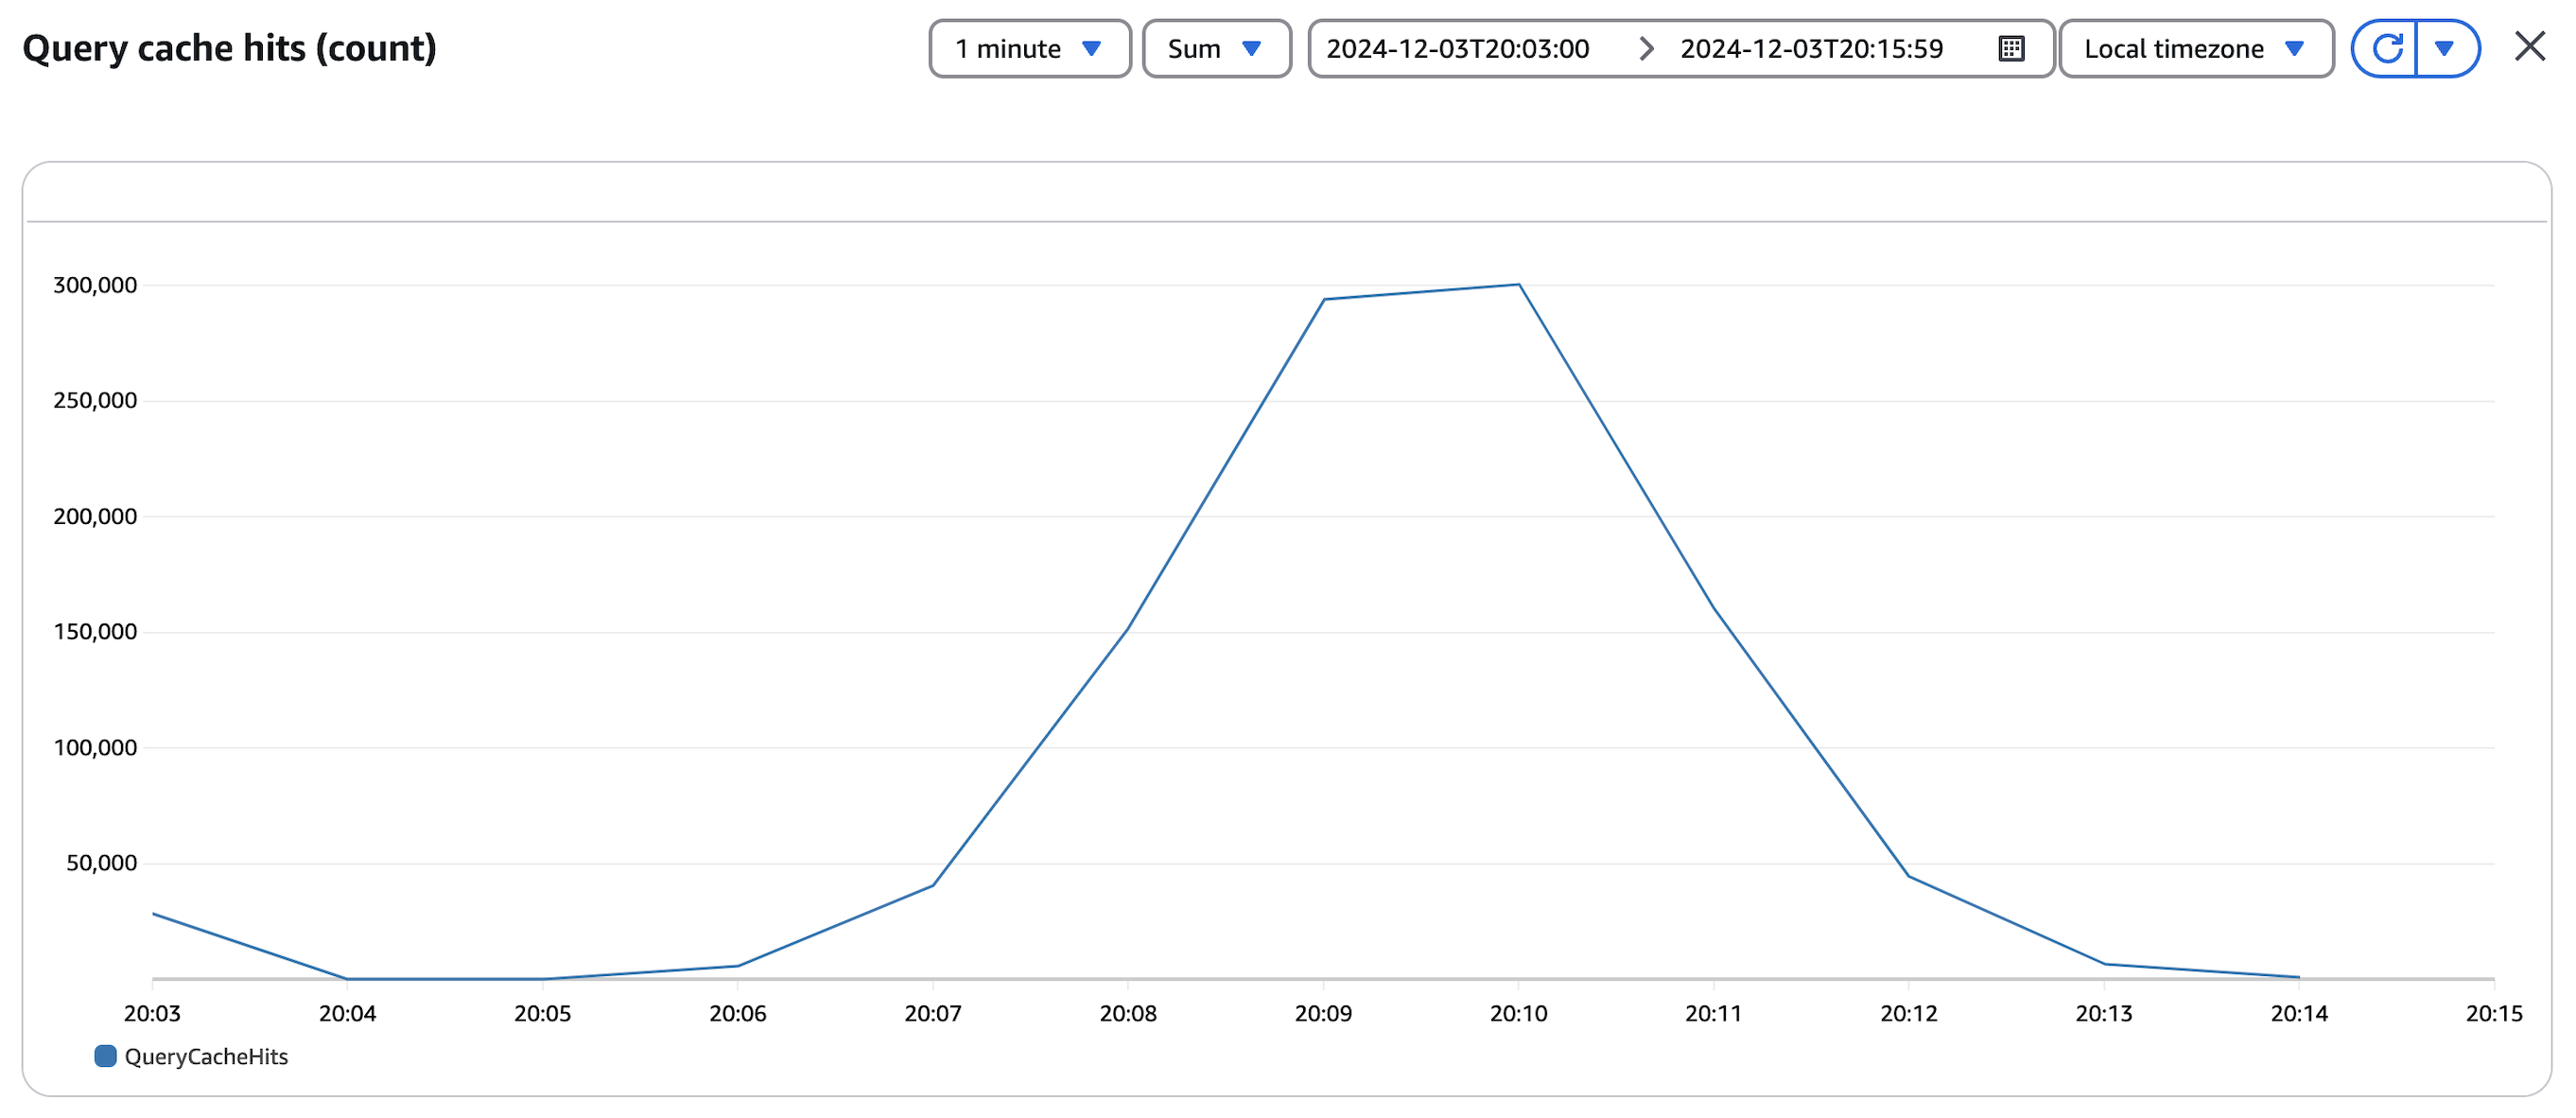
The following screenshot shows the query cache hits from our tests. Similar to the graph for the item cache hits, we can see the number of cache hits increase to approximately 300,000 hits during the first half of the test where the number of requests to DAX was increasing then it ramped down to 0 hits during the second half of the test.
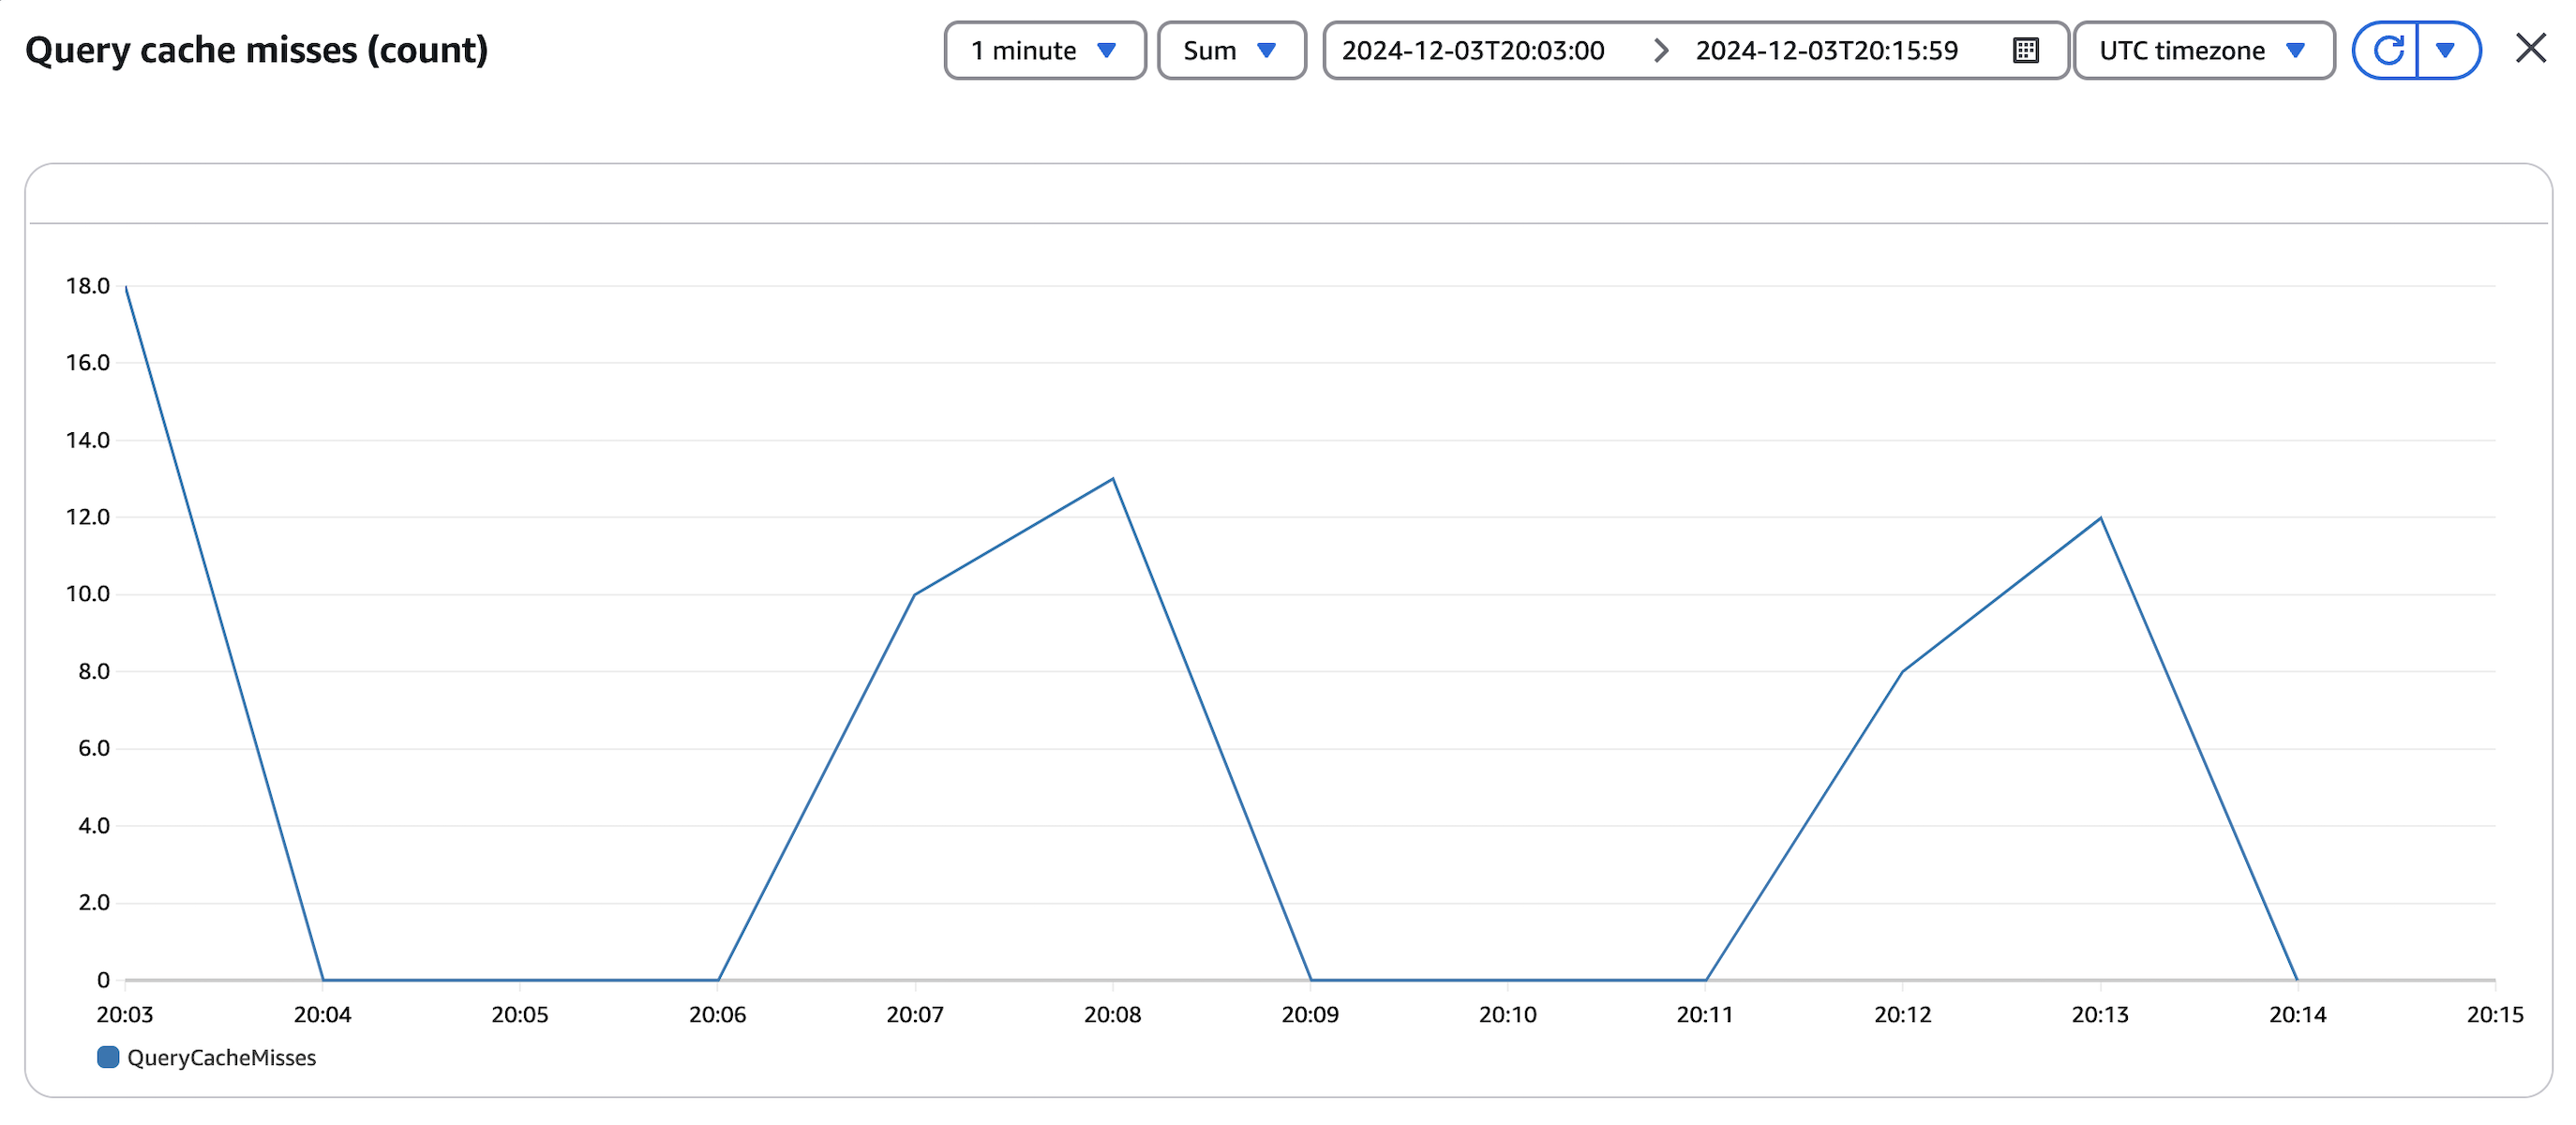
The following screenshot shows the query cache misses from our tests. We can see fewer cache misses peaking at 18 cache misses because of the small set of product categories in the test data.
DAX does not publish requests latency for get or query requests but the results from the second tests show improved latency on the product service. This is because DAX maintains an item cache and a query cache where it stores items and query result sets from read operations to your DynamoDB table. When an eventually consistent read request is made for a cached item or a cached query result set, DAX returns the result to the application without accessing DynamoDB. DAX will only forward the request to DynamoDB if a strongly consistent read request is made or if DAX does not have the items requested in its item cache or query cache.
This reduces the average RCUs consumed on DynamoDB by the product service because data DAX retrieves from DynamoDB is stored in its cache until the item has been in the cache for longer than the Time to Live (TTL) setting of the cache, then it is refreshed on the next request from the application to DAX.
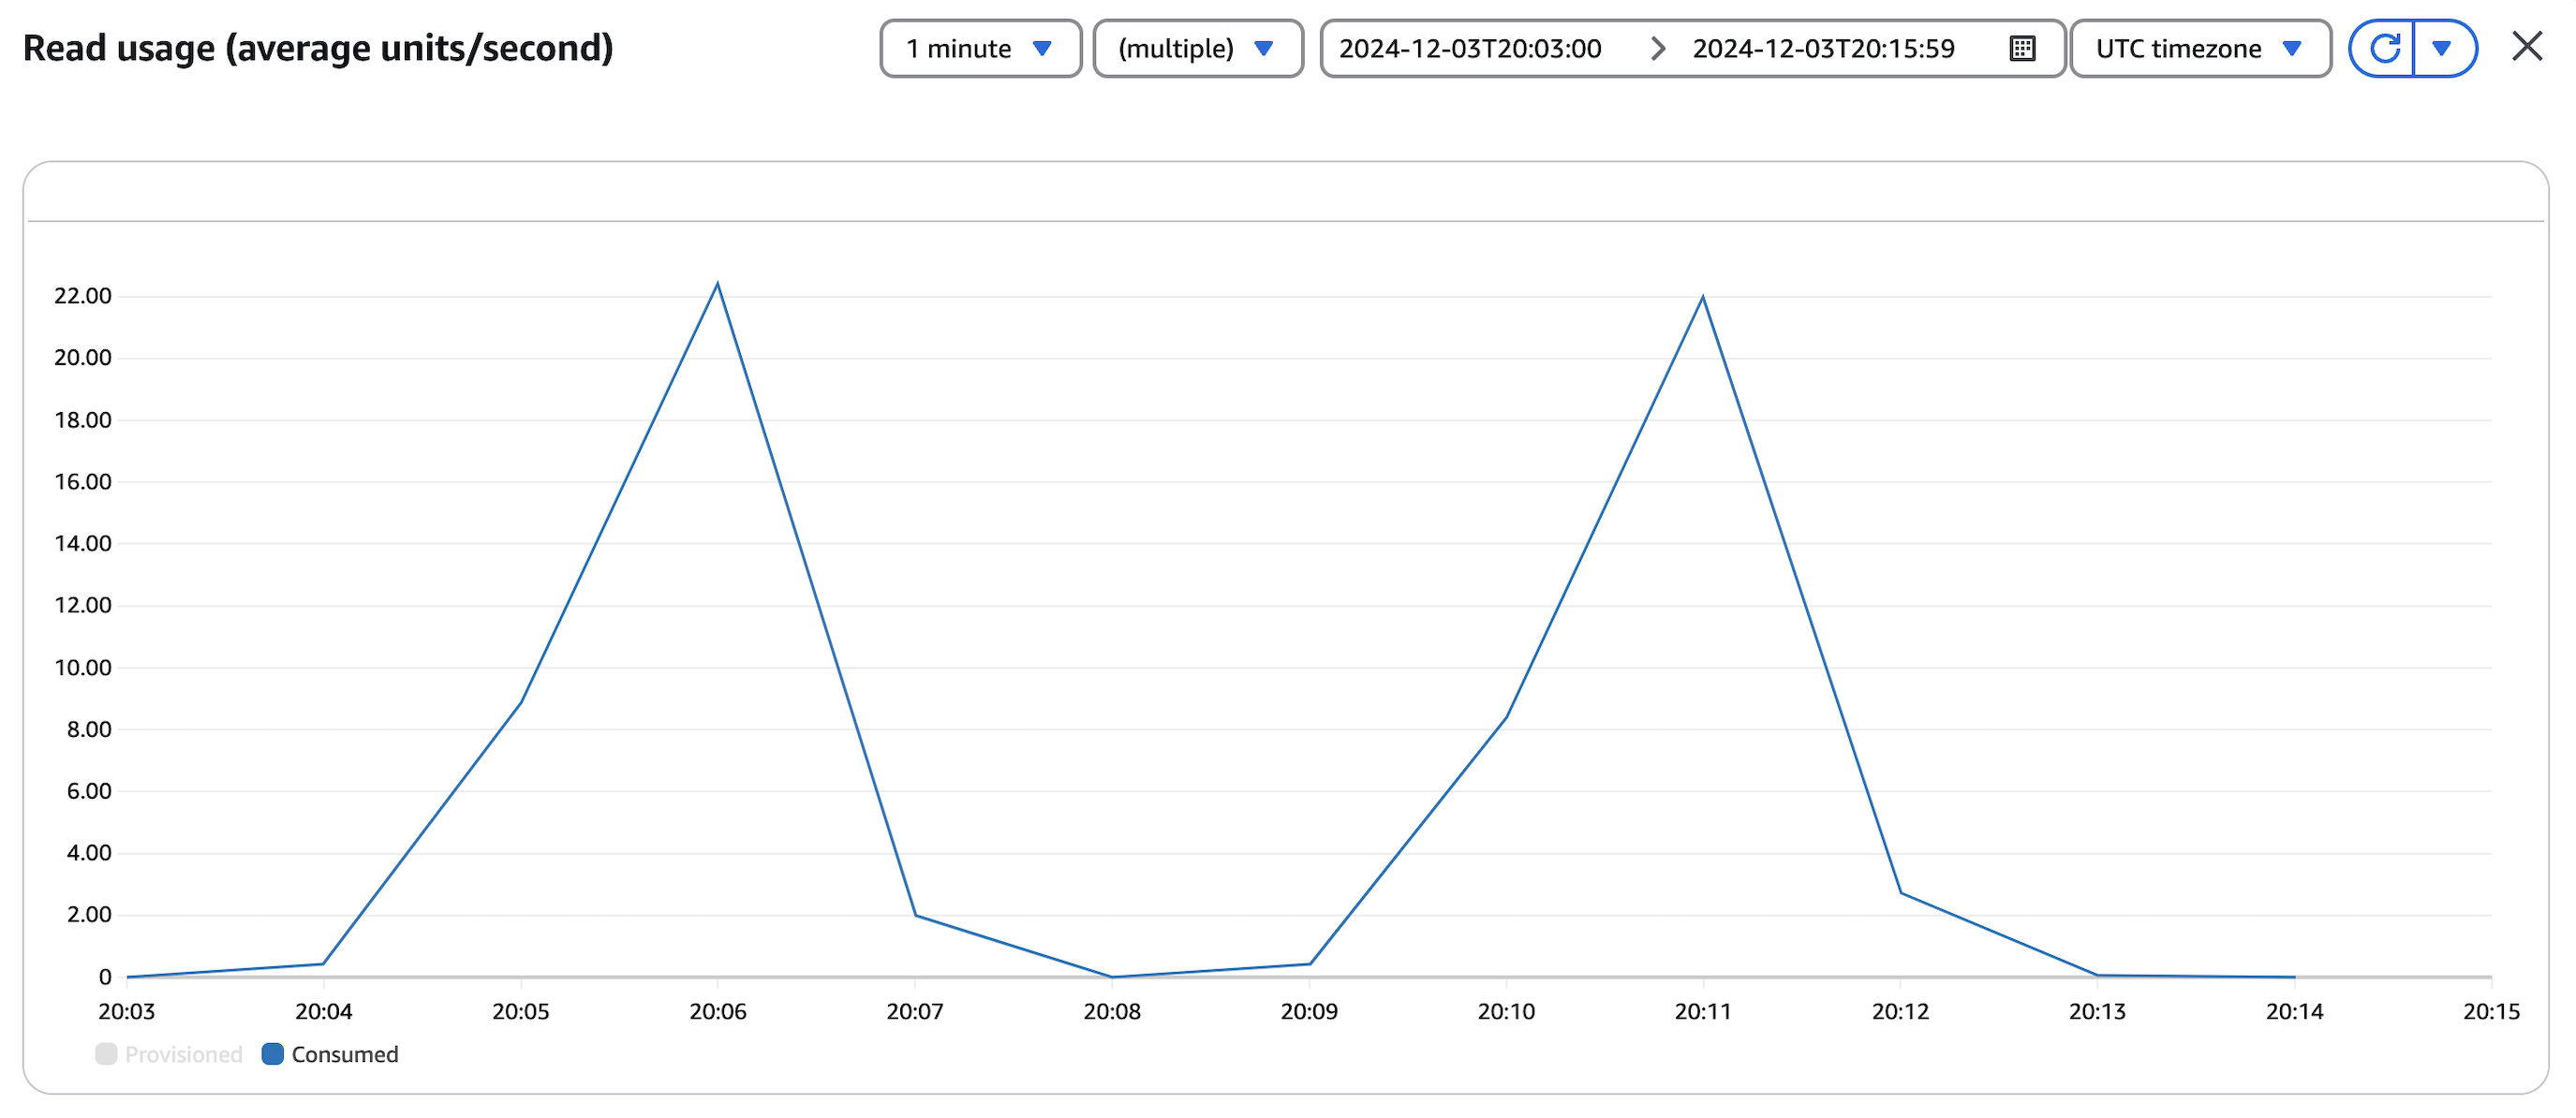
With DAX in use, the RCUs consumed on DynamoDB peaked around 22 RCUs. That is over 99% less than the 8,500 RCUs consumed when DAX was not used.
The following screenshot shows the average RCUs consumed on DynamoDB when DAX was in use. We can see that though the product service processed the same number of requests during both tests, the average RCUs consumed on DynamoDB during the second test peaked around 22 RCUs compared to 8,500 RCUs when DAX was not used.
The right TTL setting for your DAX cluster will vary by application because there needs to be a balance between application performance optimization and data consistency. For read-heavy workloads with infrequent updates, a longer TTL will help minimize your cache misses. For more details, refer to Selecting TTL setting for the caches.
Pricing
DynamoDB pricing
There are two pricing options for DynamoDB read and write operations: on-demand capacity mode and provisioned capacity mode. With on-demand capacity mode, DynamoDB charges for the number of reads and writes made to your database table. With provisioned capacity mode, DynamoDB charges for the read and write capacity units you provision for your table and you can use DynamoDB auto scaling to dynamically adjust the capacity provisioned for your table.
DAX pricing
DAX nodes are charged by the hour and you are billed for each node in your DAX cluster. The price for each node is dependent on the node type you select.
Use of t-type nodes is not recommended for production workloads that require consistently high CPU capacity from DAX. Using the desired throughput capacity for your application, you can estimate the appropriate node type and node count required for your DAX cluster.
Reduced cost with DAX
Since DAX nodes are charged by the hour, your application must exceed a certain read capacity threshold for use of DAX to be economical. The threshold will vary by the node type used in your DAX cluster.
Let’s assume that the product service needs to support the read requirements listed in the following table.
|
Rate (Requests/Sec) |
Duration (Hours/Day) |
|
| Normal operations |
6,000 |
20 |
| Peak operations |
12,000 |
4 |
A DynamoDB table configured in provisioned capacity mode will cost you approximately $474 for read operations monthly. The following table shows this estimate.
|
Provisioned RCU |
RCU-Hours per Month |
Monthly Cost ($) |
|
| Normal operations |
8,571 |
2,605,888 |
338.77 |
| Peak operations |
17,143 |
1,045,784 |
135.95 |
The provisioned RCUs used in our estimate is greater than the RCUs required for the product service. This is because DynamoDB auto scaling dynamically adjusts the provision throughput on a table operating in provisioned capacity mode when the consumed capacity on the table exceeds your target utilization for a specific period. The default target utilization for a table in provisioned capacity mode is 70 percent of your read and write capacity. You can set the auto scaling target utilization to a value between 20 and 90 percent of your desired read and write capacity.
A DynamoDB table configured in on-demand capacity mode will cost you approximately $1,150 for read operations monthly. The following table shows this estimate.
|
Rate (Requests/Sec) |
Num of Requests (Millions/Month) |
Monthly Cost ($) |
|
| Normal operations |
6,000 |
13,132.80 |
820.80 |
| Peak operations |
12,000 |
5,270.40 |
329.40 |
When using DAX, we need to include the cost of the DAX cluster to the cost of read operations to your DynamoDB table. Effective use of DAX requires picking a TTL that reduces the number of reads to DynamoDB while maintaining data consistency. The equivalent configuration to support the read requirements (that is 6,000 requests per second during normal operations and 12,000 requests per second during peak operations) are shown in the following tables.
The estimated cost for your DynamoDB table read operations in provisioned capacity mode.
|
Provisioned RCU |
RCU-Hours per Month |
Monthly Cost ($) |
|
| Normal operations |
28 |
8,512 |
1.10 |
| Peak operations |
57 |
3,538 |
0.46 |
The estimated cost for your DynamoDB table read operations in on-demand capacity mode.
|
Rate (Requests/Sec) |
Num of Requests (Millions/Month) |
Monthly Cost ($) |
|
| Normal operations |
20 |
43.78 |
2.74 |
| Peak operations |
40 |
17.69 |
1.11 |
The cost for DAX.
| Node Type |
Number of Nodes |
Monthly Cost ($) |
| dax.r5.large |
2 |
372.30 |
The approximate monthly cost for read operations on DynamoDB would be $374 in provisioned capacity mode and $376 in on-demand capacity mode. This is approximately a 21% reduction in read operations cost when DAX is used with DynamoDB in provisioned capacity mode and a 67% reduction in read operations cost when DAX is used with DynamoDB in on-demand capacity mode.
The DAX cluster used in this example was set up with two nodes for high availability and dax.r5.large nodes were used because of the number of requests we want the product service to support during peak operations. DAX does not currently support autoscaling so the cluster used in this example was sized for peak operations. Depending on the needs of your application, your DAX cluster can have up to 11 nodes.
DAX cluster sizing
To achieve optimal performance of your DAX cluster, make sure to size your DAX cluster correctly. For more details, refer to DAX cluster sizing guide.
Conclusion
In this post, we described a method to improve latency and reduce cost for read-heavy applications that use DynamoDB. Though DAX is not a serverless service and it incurs charges for the cluster nodes even during idle periods, it can still be a cost-effective solution for certain use cases. Specifically, DAX proves particularly valuable for read-heavy applications that utilize DynamoDB and serve a large user base.
To learn more about DAX, refer to In-memory acceleration with DynamoDB Accelerator (DAX). Refer to Amazon DynamoDB Accelerator (DAX): A Read-Through/Write-Through Cache for DynamoDB to learn more about how DAX works under the hood.
About the Author
 Imhoertha Ojior is a Solutions Architect at AWS in London. He is passionate about helping customers design distributed applications that require consistent database performance at any scale.
