
There are many reasons to be excited about generics in Go. In this article, I’m going to show how, using Go generics, ScyllaDB achieved a 40% performance gain in an already well-optimized package, the Google B-Tree implementation. (For background, ScyllaDB is a NoSQL database for data-intensive apps that require high performance and low latency. It’s available as open source, enterprise and DBaaS).

A B-Tree is a kind of self-balancing tree. For the purpose of this article, it’s sufficient to say that it is a collection. You can add, remove, get or iterate over its elements. The Google B-Tree is well optimized; measures are taken to make sure memory consumption is correct. There is a benchmark for every exported method, and the benchmark results show that there are zero allocations in the B-Tree code for all operations except cloning. This suggests it would be hard to further optimize using traditional techniques.
The work covered in this article was part of ScyllaDB’s long-standing partnership with the Computer Science Department at the University of Warsaw. We’ve worked on a number of projects together: integrating Parquet, an async userspace filesystem, a Kafka client for Seastar, a system for linear algebra in ScyllaDB and a design for a new Rust driver.
(If you obsess over performance optimizations like this, join us at P99 CONF — a free virtual conference dedicated to all things performance.)
Making Faster B-Trees with Generics
While working on a new ScyllaDB Go Driver with students of the University of Warsaw, we ported the B-tree code to generics. (If you’re not familiar with generics in Go, check out this tutorial.).
The initial result: the generics code is faster by 20 to 30 percent according to the Google benchmarks (here’s the issue we opened). Below is a full benchmark comparison done with benchstat.
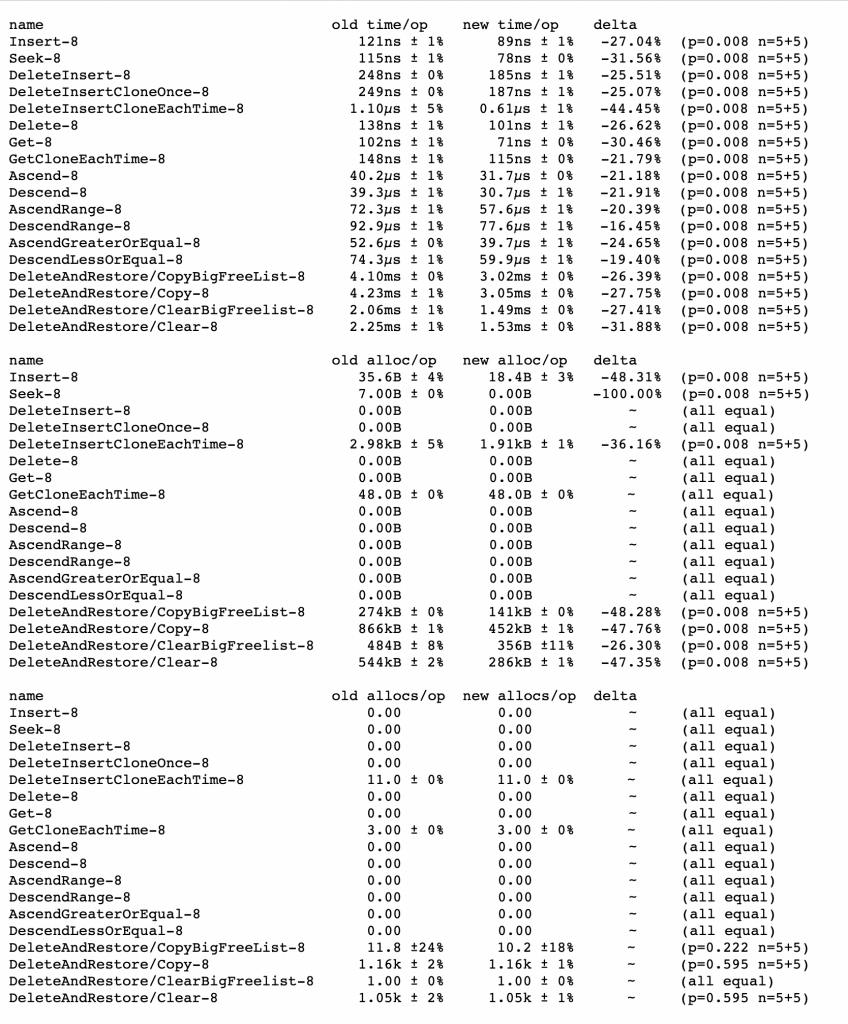
This is great, but within those numbers lies a troubling detail. The zero allocations is not something that you would normally see given that the functions accept an interface as a parameter.
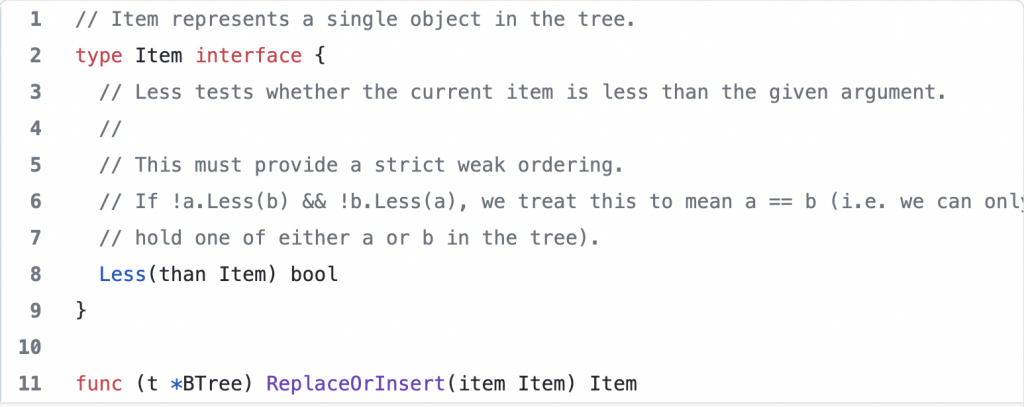
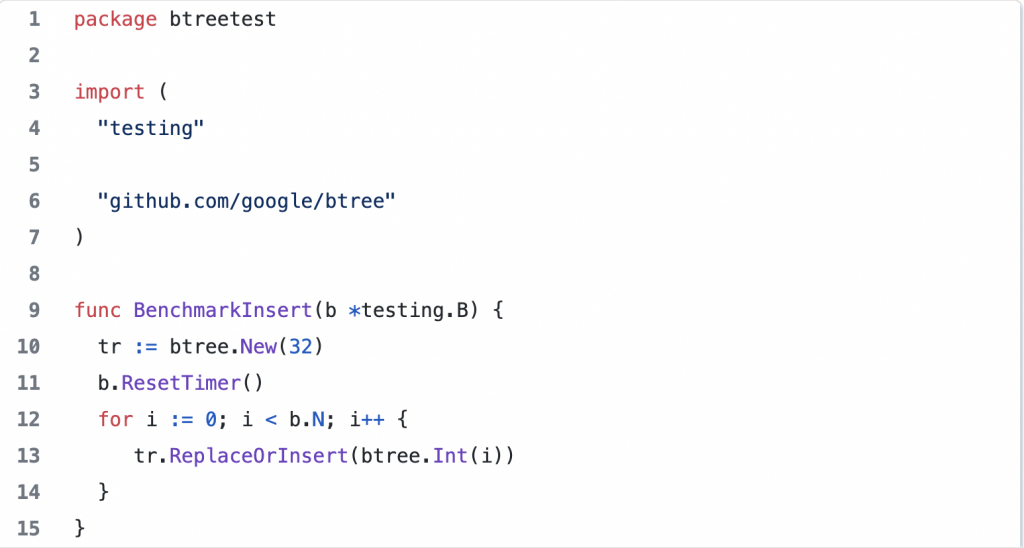
For the rest of the article, let’s focus on benchmarking the ReplaceOrInsert function responsible for ingesting data. Consider a simplified benchmark.
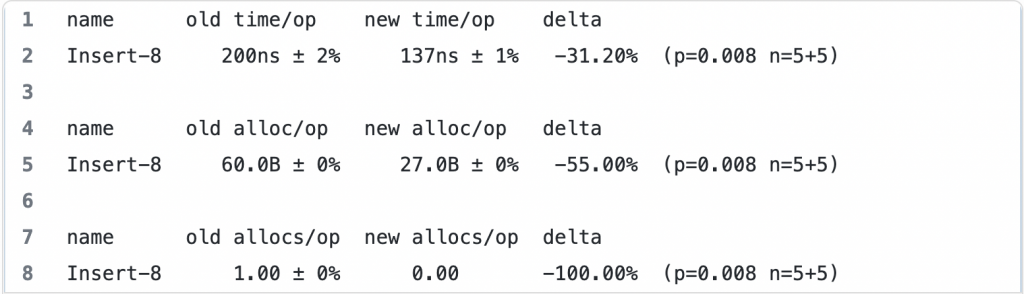
The results show even greater improvement: 31 percent vs. 27 percent, and allocations drop from 1 (in the case of the interface-based implementation) to 0 (in the case of generics).
Let’s try to understand what happens here.
The Additional Allocation
The Google benchmarks operate on a B-tree of integers hidden by an Item interface. They use pre-generated random data in a slice. When an Item is passed to the ReplaceOrInsert function, the underlying integer is already on the heap. Technically, we are copying a pointer. This is not the case when a plain integer needs to be converted to an Item interface — the parameter values start “escaping to heap.”
Go has a feature of deciding if a variable you initialized should live in the function’s stack or in the heap. Traditionally, the compiler was very “conservative.” When it saw a function like func bind(v interface{}), anything you wanted to pass as v would have to go to heap first. This is referred to as a variable escaping to the heap. Over the years, the compiler has gotten smarter, and calls to local functions or functions in other packages in your project can be optimized, preventing the variables from escaping. You can check for yourself by running go build -gcflags="-m". in a Go package.
In the following example, Go can figure out that it’s safe to take a pointer to the main function’s stack.
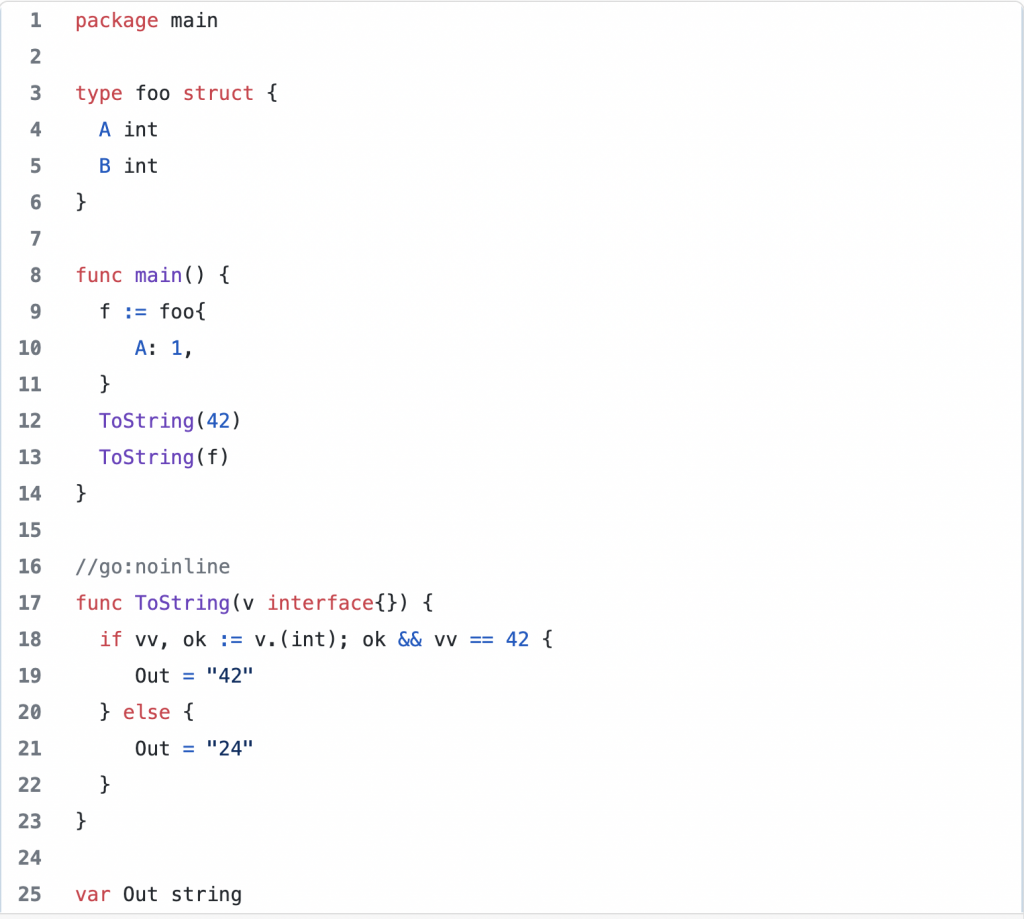
As you can see, the compiler informs us that variables do not escape to heap.
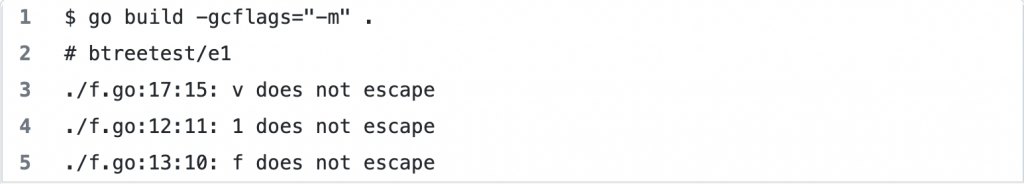
By changing the ToString implementation to
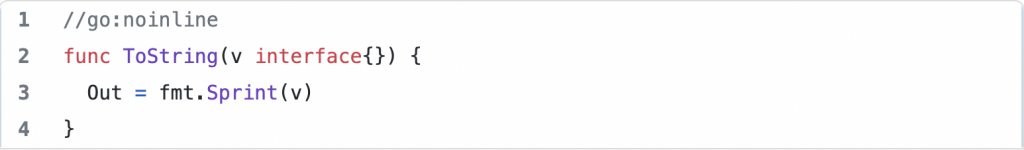
we see that the variables and literal values do start escaping.
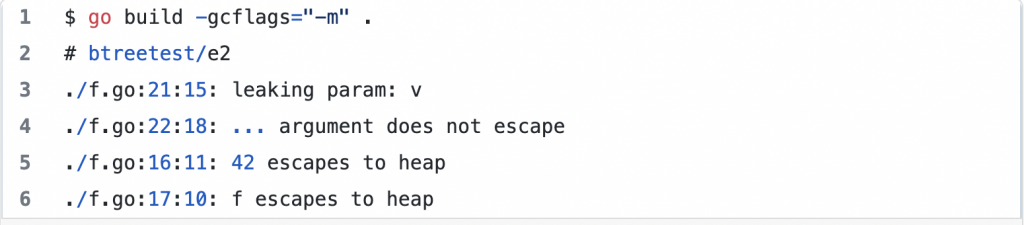
In practical examples, when calling a function that accepts an interface as a parameter, the value almost always escapes to heap. When this happens, it not only slows down the function call by the allocation but also increases the garbage collection (GC) pressure. Why is this important? The generics approach enables a truly zero allocation API, with zero GC pressure added. More on this as we continue.
Why Is It Faster?
The B-tree, being a tree, consists of nodes. Each node holds a list of items.
![]()
When the Item is a pre-generics plain old interface, the value it holds must live separately somewhere on the heap. The compiler can’t tell the item size. From the runtime perspective, an interface value is an unsafe pointer to data (word), a pointer to its type definition (typ), a pointer to interface definition (ityp) — see definitions in the reflect package. It’s easier to digest than the runtime package. In that case, we have items as a slice of int pointers.
On the other hand, with a generic interface
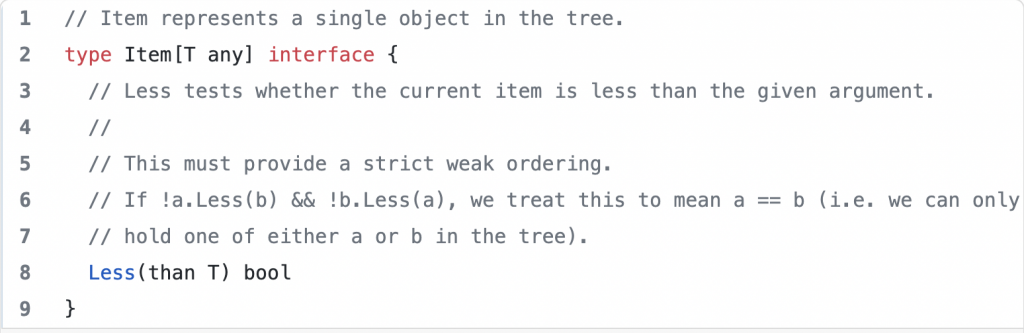
and a generic type definition
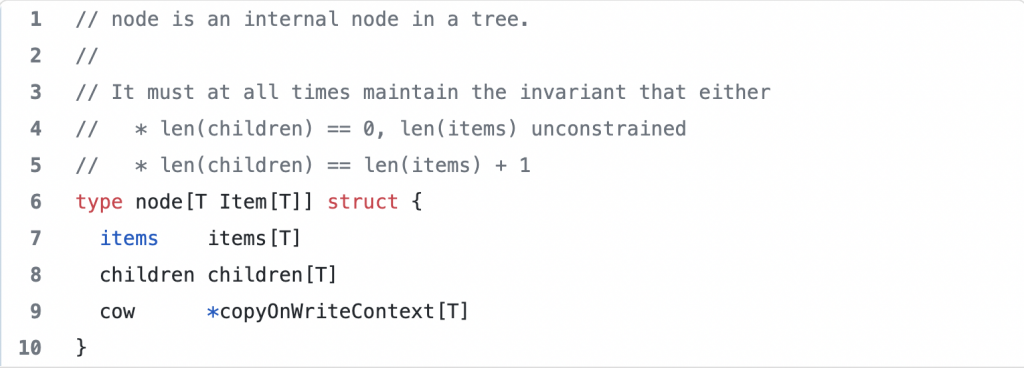
items are a slice of ints. This reduces the number of small heap objects by a factor of 32.
Enough theory. Let’s try to examine a concrete use. For the purpose of this article, I wrote a test program that is a scaled-up version of my benchmark code.
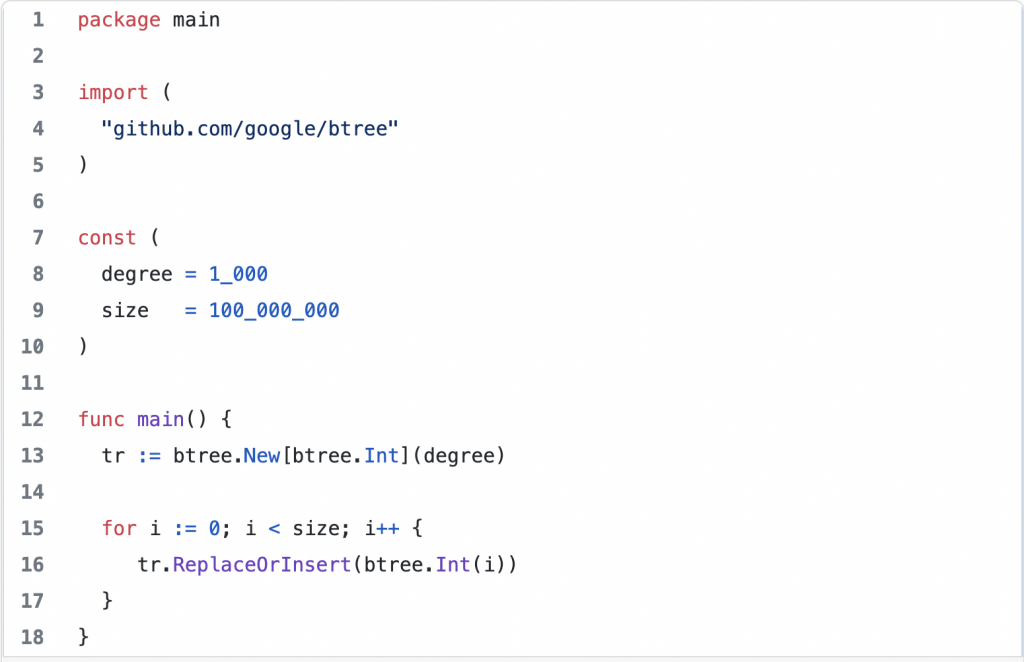
We are adding 100 million integers, and the degree of the B-tree (number of items in a node) is 1k. There are two versions of this program: one uses generics, the other plain old interface. The difference in code is minimal. It’s simply changing btree.New(degree) to btree.New[btree.Int](degree) in line 13. Let’s compare data gathered by running both versions under /usr/bin/time -l -p.
| generics | interface | delta | |
| real | 11.49 | 16.59 | -30.74% |
| user | 11.27 | 18.61 | -39.44% |
| sys | 0.24 | 0.6 | -60.00% |
| maximum resident set size | 2334212096 | 6306217984 | -62.99% |
| average shared memory size | 0 | 0 | |
| average unshared data size | 0 | 0 | |
| average unshared stack size | 0 | 0 | |
| page reclaims | 142624 | 385306 | -62.98% |
| page faults | 0 | 0 | |
| swaps | 0 | 0 | |
| block input operations | 0 | 0 | |
| block output operations | 0 | 0 | |
| messages sent | 0 | 0 | |
| messages received | 0 | 0 | |
| signals received | 600 | 843 | -28.83% |
| voluntary context switches | 25 | 48 | -47.92% |
| involuntary context switches | 1652 | 2943 | -43.87% |
| instructions retired | 204760684966 | 288827272312 | -29.11% |
| cycles elapsed | 37046278867 | 60503503105 | -38.77% |
| peak memory footprint | 2334151872 | 6308147904 | -63.00% |
| HeapObjects | 236884 | 50255826 | -99.53% |
| HeapAlloc | 2226292560 | 6043893088 | -63.16% |
Here, using generics solves a version of the N+1 problem for slices of interfaces. Instead of one slice and N integers in heap, we now can have just the slice of ints. The results are profound. The new code behaves better in every way. The wall time duration is down by 40%, context switches are down by 40%, system resources utilization is down by 60% — all thanks to a 99.53% reduction of small heap objects.
Let’s conclude by taking a look at top CPU utilization.
go tool pprof -top cpu.pprof
| generics | interface |
| Type: cpu
Time: Apr 5, 2022 at 10:23am (CEST) Duration: 11.61s, Total samples = 11.05s (95.18%)< Showing nodes accounting for 10.77s, 97.47% of 11.05s total Dropped 52 nodes (cum <= 0.06s) flat flat% sum% cum cum% 4.96s 44.89% 44.89% 4.96s 44.89% runtime.madvise 4.61s 41.72% 86.61% 4.61s 41.72% runtime.memclrNoHeapPointers 0.64s 5.79% 92.40% 0.64s 5.79% github.com/google/btree.items[…].find.func1 0.19s 1.72% 94.12% 0.83s 7.51% sort.Search 0.08s 0.72% 94.84% 5.82s 52.67% github.com/google/btree..insert 0.08s 0.72% 95.57% 0.08s 0.72% runtime.mmap 0.07s 0.63% 96.20% 0.90s 8.14% github.com/google/btree.items[…].find 0.05s 0.45% 96.65% 5.88s 53.21% github.com/google/btree..ReplaceOrInsert 0.05s 0.45% 97.10% 4.19s 37.92% github.com/google/btree..insertAt (inline) 0.04s 0.36% 97.47% 0.61s 5.52% github.com/google/btree..maybeSplitChild 0 0% 97.47% 0.57s 5.16% github.com/google/btree..split |
Type: cpu
Time: Apr 5, 2022 at 10:31am (CEST) Duration: 16.69s, Total samples = 18.65s (111.74%) Showing nodes accounting for 17.94s, 96.19% of 18.65s total Dropped 75 nodes (cum <= 0.09s) flat flat% sum% cum cum% 9.53s 51.10% 51.10% 9.53s 51.10% runtime.madvise 2.62s 14.05% 65.15% 2.62s 14.05% runtime.memclrNoHeapPointers 1.09s 5.84% 70.99% 1.31s 7.02% github.com/google/btree.items.find.func1 0.93s 4.99% 75.98% 2.73s 14.64% runtime.scanobject 0.67s 3.59% 79.57% 0.67s 3.59% runtime.heapBits.bits (inline) 0.44s 2.36% 81.93% 1.75s 9.38% sort.Search 0.30s 1.61% 83.54% 0.30s 1.61% runtime.markBits.isMarked (inline) 0.27s 1.45% 84.99% 2.03s 10.88% github.com/google/btree.items.find 0.27s 1.45% 86.43% 3.35s 17.96% runtime.mallocgc 0.26s 1.39% 87.83% 0.26s 1.39% runtime.(*mspan).refillAllocCache 0.25s 1.34% 89.17% 0.60s 3.22% runtime.greyobject 0.24s 1.29% 90.46% 0.26s 1.39% runtime.heapBits.next (inline) 0.23s 1.23% 91.69% 0.23s 1.23% github.com/google/btree.Int.Less 0.20s 1.07% 92.76% 0.20s 1.07% runtime.memmove 0.20s 1.07% 93.83% 0.20s 1.07% runtime.mmap 0.15s 0.8% 94.64% 2.47s 13.24% github.com/google/btree.(*items).insertAt (inline) 0.12s 0.64% 95.28% 0.27s 1.45% runtime.findObject 0.08s 0.43% 95.71% 5.44s 29.17% github.com/google/btree.(*node).insert 0.03s 0.16% 95.87% 5.48s 29.38% github.com/google/btree.(*BTree).ReplaceOrInsert 0.02s 0.11% 95.98% 0.84s 4.50% github.com/google/btree.(*node).maybeSplitChild 0.02s 0.11% 96.09% 0.45s 2.41% runtime.convT64 0.01s 0.054% 96.14% 9.83s 52.71% runtime.(*mheap).allocSpan 0.01s 0.054% 96.19% 2.82s 15.12% runtime.gcDrain 0 0% 96.19% 0.78s 4.18% github.com/google/btree.(*node).split |
You can literally see how messy the interface profile is, and how gc starts kicking in killing it… It’s even more evident when we focus on gc.
go tool pprof -focus gc -top cpu.pprof
| generics | interface |
| Type: cpu
Time: Apr 5, 2022 at 10:23am (CEST) Duration: 11.61s, Total samples = 11.05s (95.18%) Active filters: focus=gc Showing nodes accounting for 0.29s, 2.62% of 11.05s total flat flat% sum% cum cum% 0.19s 1.72% 1.72% 0.19s 1.72% runtime.memclrNoHeapPointers 0.02s 0.18% 1.90% 0.02s 0.18% runtime.(*mspan).refillAllocCache 0.01s 0.09% 1.99% 0.02s 0.18% runtime.(*fixalloc).alloc 0.01s 0.09% 2.08% 0.01s 0.09% runtime.(*mheap).allocNeedsZero 0.01s 0.09% 2.17% 0.01s 0.09% runtime.(*mspan).init (inline) 0.01s 0.09% 2.26% 0.01s 0.09% runtime.heapBits.bits (inline) 0.01s 0.09% 2.35% 0.01s 0.09% runtime.markrootSpans 0.01s 0.09% 2.44% 0.01s 0.09% runtime.recordspan 0.01s 0.09% 2.53% 0.02s 0.18% runtime.scanobject 0.01s 0.09% 2.62% 0.01s 0.09% runtime.stkbucket |
Type: cpu
Time: Apr 5, 2022 at 10:31am (CEST) Duration: 16.69s, Total samples = 18.65s (111.74%) Active filters: focus=gc Showing nodes accounting for 6.06s, 32.49% of 18.65s total Dropped 27 nodes (cum <= 0.09s) flat flat% sum% cum cum% 2.62s 14.05% 14.05% 2.62s 14.05% runtime.memclrNoHeapPointers 0.93s 4.99% 19.03% 2.73s 14.64% runtime.scanobject 0.67s 3.59% 22.63% 0.67s 3.59% runtime.heapBits.bits (inline) 0.30s 1.61% 24.24% 0.30s 1.61% runtime.markBits.isMarked (inline) 0.27s 1.45% 25.68% 3.35s 17.96% runtime.mallocgc 0.26s 1.39% 27.08% 0.26s 1.39% runtime.(*mspan).refillAllocCache 0.25s 1.34% 28.42% 0.60s 3.22% runtime.greyobject 0.24s 1.29% 29.71% 0.26s 1.39% runtime.heapBits.next (inline) 0.12s 0.64% 30.35% 0.27s 1.45% runtime.findObject 0.08s 0.43% 30.78% 0.08s 0.43% runtime.spanOf (inline) 0.06s 0.32% 31.10% 0.06s 0.32% runtime.(*mspan).base (inline) 0.06s 0.32% 31.42% 0.06s 0.32% runtime.(*mspan).init (inline) 0.06s 0.32% 31.74% 0.06s 0.32% runtime.heapBitsSetType 0.04s 0.21% 31.96% 0.04s 0.21% runtime.(*mSpanStateBox).get (inline) 0.04s 0.21% 32.17% 0.04s 0.21% runtime.pthread_kill 0.04s 0.21% 32.39% 0.04s 0.21% runtime.usleep 0.01s 0.054% 32.44% 0.10s 0.54% runtime.(*mheap).allocSpan 0.01s 0.054% 32.49% 2.82s 15.12% runtime.gcDrain |
The generic version spent 0.29s (2.62 percent) in GC while the interface version spent 6.06s accounting for – hold your breath – 32.49% of the total time!
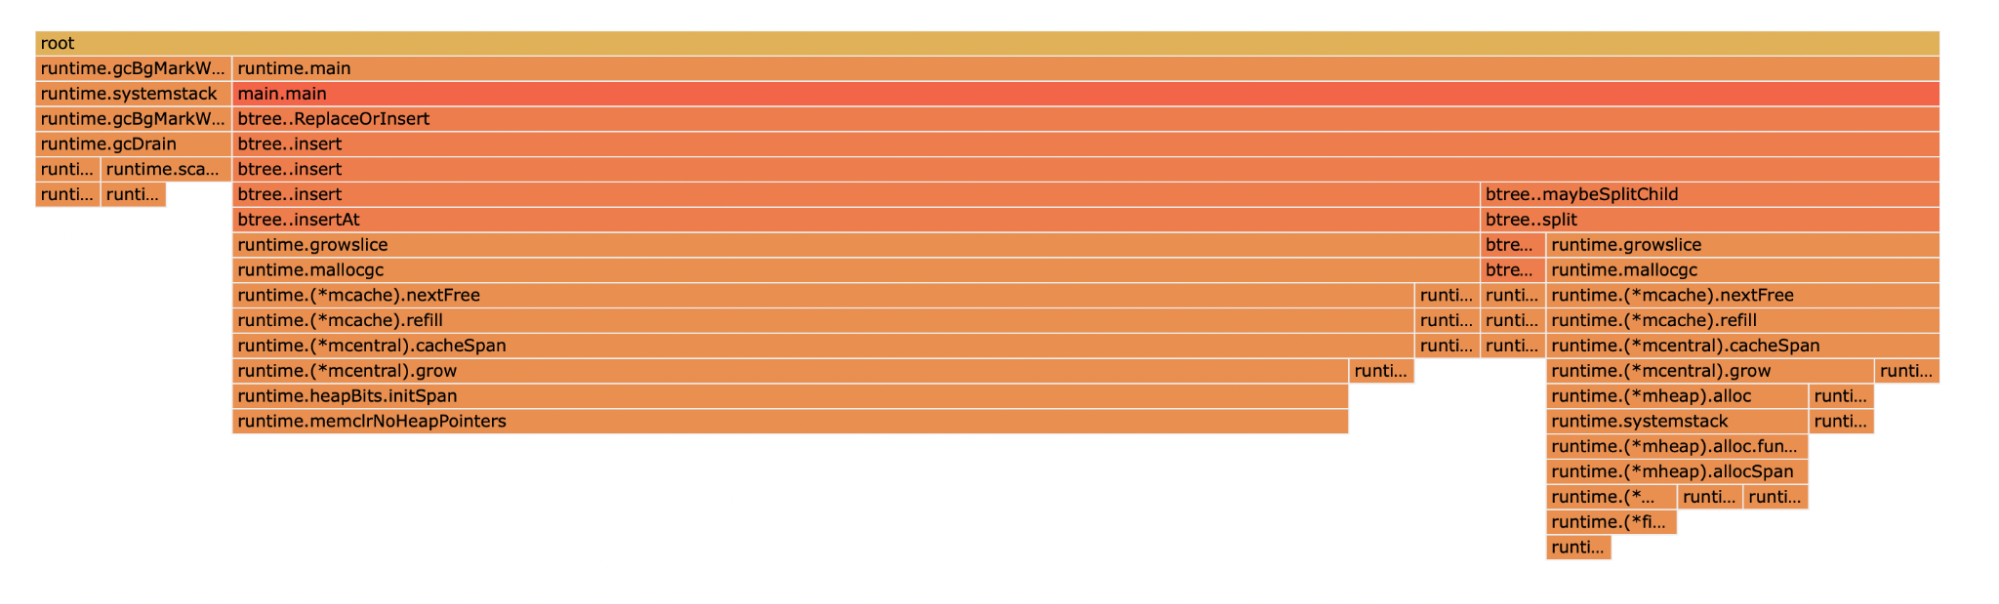
Generics: CPU profile flame focused on GC-related functions.
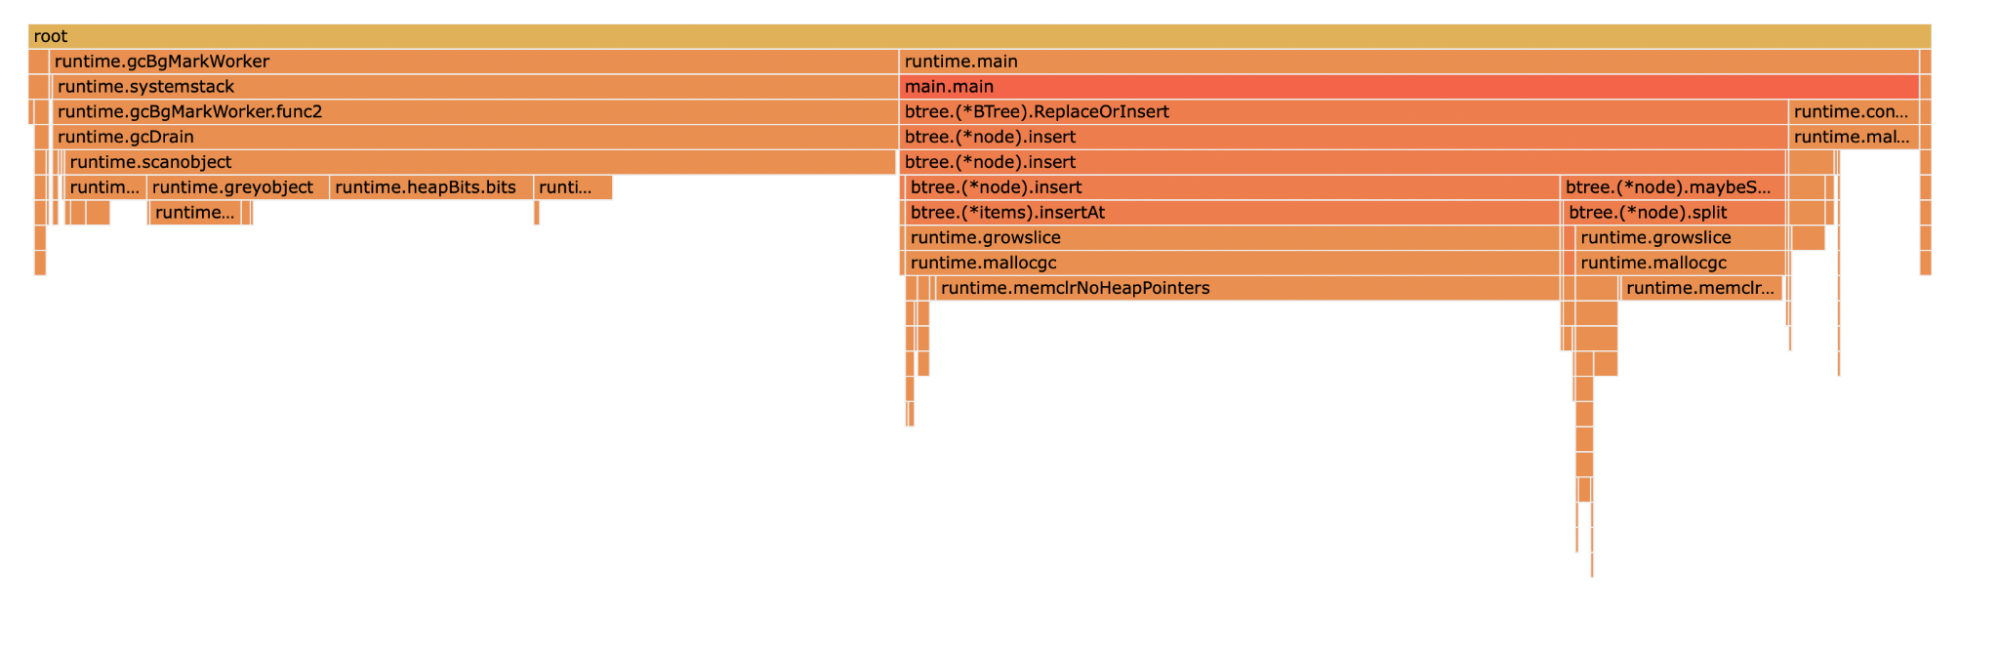
Interface: CPU profile flame focused on GC-related functions.
Conclusion
By shifting from an implementation using interfaces to one using generics, we were able to significantly improve performance, minimize garbage collection time, and minimize CPU and other resource utilization, such as heap size. Particularly with heap size, we were able to reduce HeapObjects by 99.53%.
The future of Go generics is bright, especially in the domain of slices.
Join Us at P99 CONF
If you enjoyed diving into this level of Go performance optimization, you will really enjoy the tech talks at P99 CONF, a free virtual conference that will be held Oct. 19-20. P99 CONF is dedicated to engineers who obsess over P99 percentiles and high-performance, low-latency applications. You can see the speaker lineup and register now at p99conf.io.
Feature image via Pixabay