
MMS • RSS
Article originally posted on Data Science Central. Visit Data Science Central
Recently, I encountered the mystery of a stock trading algorithm that habitually makes the wrong investment decision. It is usually wrong 55 to 60 percent of the time. This algorithm makes use of simulated traders – usually a thousand of them. Each trader is triggered to do buy and sell orders using a purely technical approach – that is to say, by analyzing the price. I call the simulated traders that make money “the Nogs.” By definition, all of the Nogs are winners. However, every winner is perhaps one trade away from becoming a loser; this seems to be the case with the Nogs.
The first column on the table below contains some Canadian stocks stored on my database. By the way, the trading symbol “Weed” is for a cannabis stock. Recreational cannabis will be legal nationally in Canada this October. I am not promoting the sale. I am only elaborating on the peculiar ticker symbol of the stock. Notice the column showing “wrongness” ranging from 54.01 percent to 61.68 percent. As a group, the Nogs are rarely right in the short-term. I determine this by checking out the price of the stock the following day. Okay, I don’t do it myself. I have a computer program that does it.
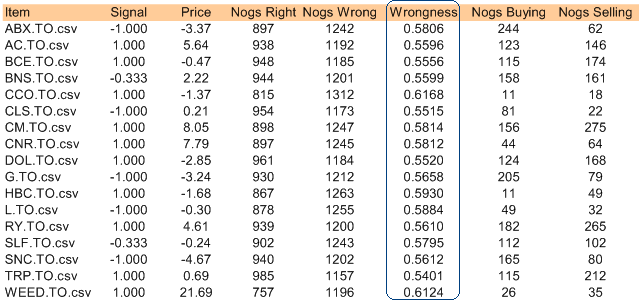
Don’t get confused by the “Price” since the table below obviously doesn’t show the price. Rather, I required the Nogs were to analyze a derivative of the stock price. The first row shows that 244 Nogs were buying ABX while 62 were selling; since the Nogs are usually wrong, there is a sell signal as indicated by -1. Going along with the Nogs would be a problem since they are wrong about 58.06 percent of the time trading ABX.
Because Nogs tend to be wrong, this creates deep philosophical questions about why this might be so. When a person says, “I am successful,” they are probably internalizing the success. While it might be entirely true, they would not normally externalize the success: “I am not special. I was just at the right place at the right time doing what comes naturally to me. I could have just as easily lost my shirt.” Nogs are winners perhaps incidentally – because a trading environment tends to involve both winners and losers. If a stock is in a long-term dive, the winning Nogs would be tuned for a declining price environment. Once the environment changes, these winners might become the losers.
After I developed the Nogs, I wondered if they are truly wrong so consistently. After all, it is a great accomplishment making an algorithm that is consistently wrong. So I created different types of stock metrics to offer the Nogs. It doesn’t seem to matter what market data the Nogs are fed, they just tend to be wrong in terms of guessing the immediate future. I came to realize that I finally found a device or tool that trades stocks worse than me. I rubbed my hands – thinking of the possibilities – determined to do just the opposite of whatever the Nogs do. Then I realized that this still leaves a 40 to 45 percent chance of being wrong. Not only this, but I have come to be aware of a flaw in my perception of what is wrong.
Let me explain my flawed perception. A person can win a bet a hundred times and lose money. This is possible because the bets tend to focus on the price. So if I win a hundred times, making $1 each time for a total of $100, but then on my next bet I lose $110, true enough I won 100 out of 101 bets. I am still down $10. Some analysts would say that my methodology nonetheless is sound given a 99 percent success rate. However, this kind of success can put a person in the poorhouse. So after I created these different metrics for the Nogs, I proceeded on a new form of technical analysis.
I realized that to make great use of statistics on stocks, using the price isn’t the best route. Consider the price pattern for the cannabis stock that I mentioned earlier – converted to a different kind of metric that I call “appreciation.” The appreciation pattern fits in nice boundaries. It is nice not just for me but also for a computer since it is possible to input buy and sell instructions without worrying about the price per se. A straightforward technical approach might base an entry and exit strategy on the price, ignoring the fact that relative cheapness or richness is, well, relative; and so the critical set points are not fixed.
It was a bit of an adventure. I thought to myself, I can analyze these alternate metrics along with the price; they all seem to provide different shades of the truth. I didn’t have any colourful Japanese terms for the patterns as one would find in normal technical analysis. I decided that I would invent my own – like the laughing dog or angry fruit fly.

I created a bundle of buy and sell rules for all of the stocks currently on the database. Personally, I find the thought of losing money horrific. It happens, and yes I get horrified. Then I get over it. But still I don’t enjoy the experience. So I created these rules specifically not to lose money. Of course, when there is less risk, there is probably less reward. I preserved the original rules for posterity because they reflect my personality. My program uses the rules to determine when and how to trade.
I confess that I didn’t actually check the results of this simulated run beforehand. Here are a number of trades performed by the simulator . . .
- ABX.TO Gain $3.03…2018-05-11 TO 2018-08-07…21.23% on $14.29 @S-25
- ABX.TO Gain $3.03…2018-05-11 TO 2018-08-07…21.23% on $14.29 @S-30
- ABX.TO Gain $4.24…2018-05-11 TO 2018-08-17…32.45% on $13.08 @S-35
- ABX.TO Gain $4.24…2018-05-11 TO 2018-08-17…32.45% on $13.08 @S-40
- AC.TO Gain $0.38…2018-05-11 TO 2018-08-17…1.63% on $23.42 @L-30
- AC.TO Gain $0.03…2018-05-11 TO 2018-08-01…0.13% on $23.42 @L-15
- RY.TO Gain $1.26…2018-05-11 TO 2018-05-25…1.27% on $98.97 @S-5
- ABX.TO Gain $3.78…2018-05-18 TO 2018-08-17…28.97% on $13.08 @S-30
- ABX.TO Gain $3.2…2018-05-18 TO 2018-08-24…23.49% on $13.66 @S-35
- ABX.TO Gain $3.27…2018-05-18 TO 2018-08-31…24.08% on $13.59 @S-40
- CM.TO Gain $3.42…2018-05-18 TO 2018-06-01…3.02% on $113.07 @S-10
- CM.TO Gain $2.55…2018-05-18 TO 2018-06-28…2.24% on $113.94 @S-30
- ABX.TO Gain $3.77…2018-05-25 TO 2018-08-24…27.67% on $13.66 @S-30
- ABX.TO Gain $3.84…2018-05-25 TO 2018-08-31…28.28% on $13.59 @S-35
- G.TO Gain $4.37…2018-05-25 TO 2018-08-17…31.48% on $13.91 @S-5
- G.TO Gain $2.53…2018-05-25 TO 2018-08-10…16.12% on $15.75 @S-15
- G.TO Gain $4.37…2018-05-25 TO 2018-08-17…31.48% on $13.91 @S-40
- AC.TO Gain $1.01…2018-06-01 TO 2018-07-30…4.42% on $22.92 @L-10
- G.TO Gain $4.47…2018-06-01 TO 2018-08-17…32.17% on $13.91 @S-15
- SNC.TO Gain $0.62…2018-06-01 TO 2018-08-07…1.11% on $55.95 @S-35
- SLF.TO Gain $2.54…2018-06-07 TO 2018-08-07…4.88% on $52.12 @S-40
- SNC.TO Gain $5.02…2018-06-07 TO 2018-08-10…9.42% on $53.27 @S-40
- G.TO Gain $2.58…2018-06-13 TO 2018-08-07…16.26% on $15.86 @S-30
- HBC.TO Gain $1.42…2018-06-13 TO 2018-08-07…13.93% on $10.19 @S-15
- HBC.TO Gain $1.51…2018-06-13 TO 2018-08-10…15.0% on $10.09 @S-20
- HBC.TO Gain $1.42…2018-06-13 TO 2018-08-07…13.93% on $10.19 @S-30
- SLF.TO Gain $3.07…2018-06-13 TO 2018-08-10…5.95% on $51.67 @S-40
- SNC.TO Gain $4.32…2018-06-13 TO 2018-08-07…7.72% on $55.95 @S-30
- SNC.TO Gain $7.0…2018-06-13 TO 2018-08-10…13.15% on $53.27 @S-35
- SNC.TO Gain $6.78…2018-06-13 TO 2018-08-17…12.69% on $53.48 @S-40
- G.TO Gain $4.42…2018-06-19 TO 2018-08-17…31.81% on $13.91 @S-30
- G.TO Gain $2.2…2018-06-19 TO 2018-08-01…13.67% on $16.12 @S-35
- HBC.TO Gain $1.17…2018-06-19 TO 2018-08-10…11.63% on $10.09 @S-25
- SNC.TO Gain $6.04…2018-06-19 TO 2018-08-10…11.34% on $53.27 @S-30
- SNC.TO Gain $5.82…2018-06-19 TO 2018-08-17…10.88% on $53.48 @S-35
- DOL.TO Gain $7.03…2018-06-25 TO 2018-08-07…15.19% on $46.25 @S-30
- DOL.TO Gain $7.03…2018-06-25 TO 2018-08-07…15.19% on $46.25 @S-35
- HBC.TO Gain $1.54…2018-06-25 TO 2018-08-10…15.35% on $10.09 @S-30
- HBC.TO Gain $1.54…2018-06-25 TO 2018-08-10…15.35% on $10.09 @S-35
- SNC.TO Gain $6.5…2018-06-25 TO 2018-08-31…12.28% on $52.96 @S-35
- AC.TO Gain $6.01…2018-06-28 TO 2018-08-24…29.02% on $20.72 @L-30
- AC.TO Gain $3.07…2018-06-28 TO 2018-08-17…14.86% on $20.72 @L-25
- AC.TO Gain $3.19…2018-06-28 TO 2018-08-07…15.41% on $20.72 @L-15
- AC.TO Gain $6.01…2018-06-28 TO 2018-08-24…29.02% on $20.72 @L-10
- HBC.TO Gain $2.42…2018-06-28 TO 2018-08-17…26.34% on $9.18 @S-30
- HBC.TO Gain $2.42…2018-06-28 TO 2018-08-17…26.34% on $9.18 @S-35
- ABX.TO Gain $3.3…2018-07-05 TO 2018-08-01…22.98% on $14.36 @S-20
- AC.TO Gain $2.68…2018-07-05 TO 2018-08-17…12.71% on $21.12 @L-35
- AC.TO Gain $5.68…2018-07-05 TO 2018-08-31…26.89% on $21.12 @L-30
- AC.TO Gain $2.81…2018-07-05 TO 2018-07-30…13.35% on $21.12 @L-20
- AC.TO Gain $5.62…2018-07-05 TO 2018-08-24…26.6% on $21.12 @L-15
- G.TO Gain $4.0…2018-07-05 TO 2018-08-24…27.64% on $14.47 @S-30
- G.TO Gain $2.6…2018-07-05 TO 2018-08-07…16.41% on $15.86 @S-35
- G.TO Gain $4.0…2018-07-05 TO 2018-08-24…27.64% on $14.47 @S-40
- HBC.TO Gain $1.86…2018-07-05 TO 2018-08-24…18.57% on $10.03 @S-30
- HBC.TO Gain $1.86…2018-07-05 TO 2018-08-24…18.57% on $10.03 @S-35
- ABX.TO Gain $3.19…2018-07-10 TO 2018-08-10…22.4% on $14.26 @S-25
- AC.TO Gain $5.41…2018-07-10 TO 2018-08-31…25.32% on $21.38 @L-15
- G.TO Gain $2.35…2018-07-10 TO 2018-08-10…14.98% on $15.75 @S-35
- G.TO Gain $3.82…2018-07-10 TO 2018-08-31…26.82% on $14.28 @S-40
- AC.TO Gain $5.68…2018-07-12 TO 2018-08-24…27.0% on $21.05 @L-25
- AC.TO Gain $5.68…2018-07-12 TO 2018-08-24…27.0% on $21.05 @L-20
- AC.TO Gain $5.59…2018-07-17 TO 2018-08-24…26.47% on $21.14 @L-35
- WEED.TO Gain $24.42…2018-07-20 TO 2018-08-24…74.06% on $32.98 @L-20
- DOL.TO Gain $2.01…2018-07-30 TO 2018-08-17…4.32% on $46.56 @L-5
I want readers to appreciate that I didn’t type out by hand any of that material above. It was computer generated. I see that there are no negative settled positions, thank goodness. There are a number of trades resulting in negligible gains. I would probably adjust the rules to attempt to prevent those trades. I can actually create a library of rules to apply to different situations – e.g. to match the context of the market. In a number of cases, trades are done on the same stock a few times. The reason for this is that there are different signalling weights being triggered. So some level of interpretation is necessary if a person intends to actually take a position.
The simulator uses something that I call the “Zig” pattern for a stock containing an array of signalling weights. These weights are used in the conditionals of the rules. Below I present a theoretical Zig pattern, which probably never appears in real life. Then immediately below it is a Zig pattern from a real stock – not the cannabis stock I mentioned earlier. The simulator is designed to bend the Zig pattern in order to squeeze out better positions. This process of “squeezing” I must say is fairly demanding on my computer. However, the process is automated.

To me if traders behave rationally, the Zig should resemble the upper image. However, at the moment, my assertion seems to lack market support. Stated differently, to me as a logical individual, I would use a Zig pattern; but since the market does not support one, I would nonetheless attempt to exploit this scenario if possible (i.e. in the hopes that logic might prevail at a later time). Some stocks have truly deformed Zigs. I am left to question why stocks have different patterns and what these differences mean in relation to the little societies taking positions.
The Nogs will periodically signal the same way as the simulation. In fact, they often signal the same way. Yet the Nogs are usually wrong. They are right 40 to 45 percent of the time. So what is a person to do? Well, I learned a long time ago not to rely on a single perspective. In all likelihood I would consider many different types of analysis – including traditional technical analysis. I would only buy a stock that I don’t mind keeping. The technicals might simply provide me a reasonable entry point. Then knowing my personality these days I would probably not spend a whole lot of time thinking about it. This is a perplexing position for me to have given the active trading supported by the computer program. A lesson I learned from the Nogs is that they spend their time constantly betting and yet getting nowhere.