Author: Matt Foster

MMS • Matt Foster
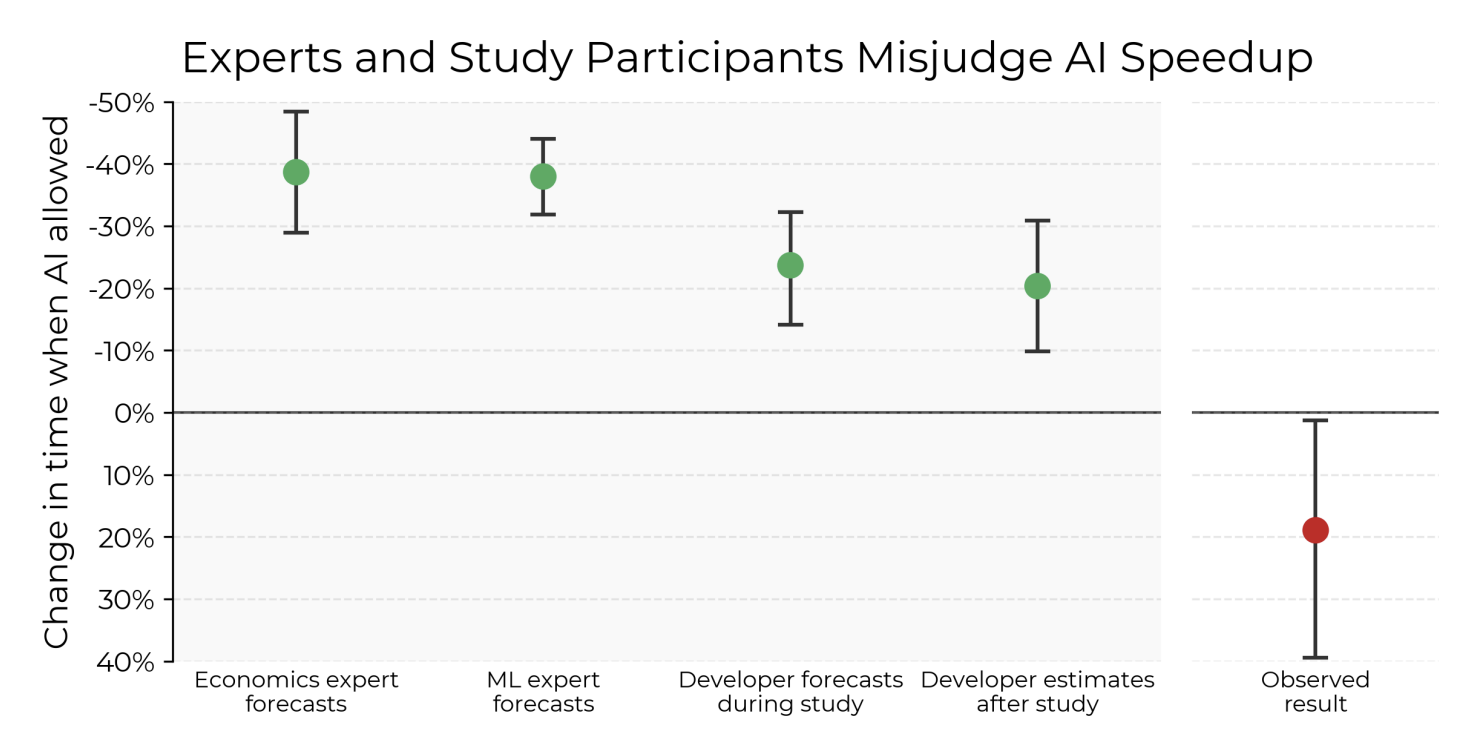
A recent study challenges the widespread belief that AI tools accelerate software development. Researchers at METR conducted a randomized controlled trial of experienced open-source developers using AI-enhanced development tools like Claude 3.5 and Cursor Pro. Contrary to expectations, they found that AI-assisted programming led to a 19% increase in task completion time—even as developers believed they were working faster. The findings reveal a potential gap between AI’s perceived promise and its real-world impact.
To evaluate AI’s influence under realistic conditions, the researchers designed a randomized controlled trial (RCT) rooted in production-grade environments. Rather than using synthetic benchmarks, they recruited experienced contributors to complete real tasks across mature open-source repositories.
Participants were 16 professional developers with an average of five years of experience on the projects they were assigned. The repositories included realistic, ‘in-anger’ issues drawn from their own codebases: very large (> 1.1m lines of code), well established open source projects.
Across 246 tasks, each developer was randomly assigned to a maximum of two-hour sessions either with or without access to AI assistance. Those with access used Cursor Pro, a code editor with integrated support for Claude 3.5/3.7 Sonnet. The control group was explicitly blocked from using AI tools.
The study collected both objective and subjective metrics, including task duration, code quality, and developer perception. Before and after each task, developers and external experts predicted the likely effect of AI on productivity.
The central result was both striking and unexpected: AI-assisted developers took 19% longer to complete tasks than those without AI. This contradicted pre-task expectations from both participants and experts, who had predicted an average speedup of ~40%.
The authors attributed the slowdown to a variety of contributing factors, including time spent prompting, reviewing AI-generated suggestions, and integrating outputs with complex codebases. Through 140+ hours of screen recordings, they identified five key contributors to the slowdown. These frictions likely offset any up-front gains from code generation, revealing a significant disconnect between perceived and actual productivity.
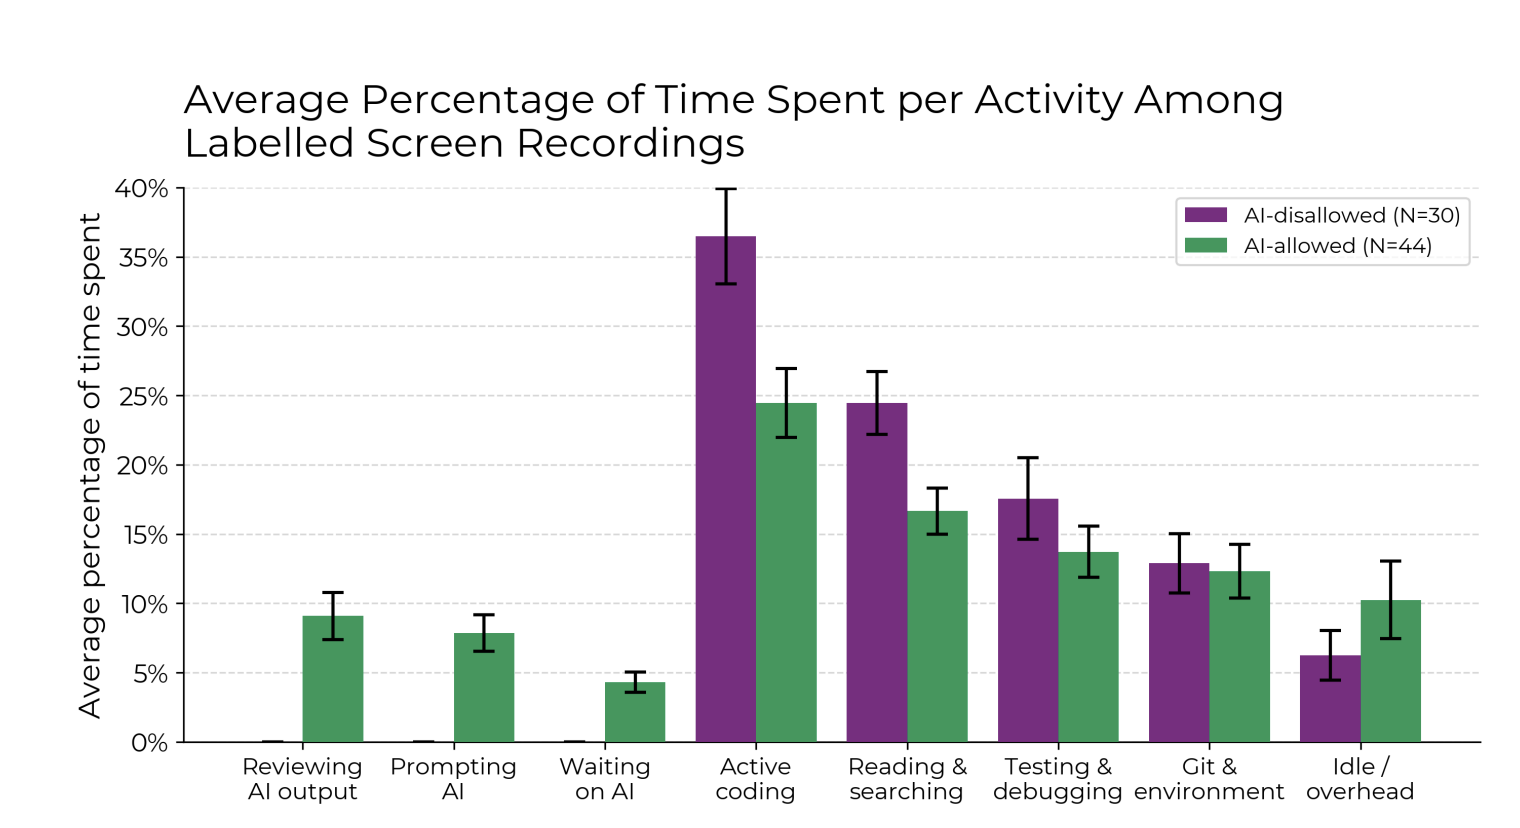
The researchers highlight this phenomenon as a ‘perception gap’—where friction introduced by AI tooling is subtle enough to go unnoticed in the moment but cumulatively slows real-world output. The contrast between perception and outcome underscores the study’s importance of grounding AI tool evaluation not just in user sentiment, but in rigorous measurement.
The authors caution against overgeneralizing their findings. While the study shows a measurable slowdown with AI tooling in this particular setting, they stress that many of the contributing factors are specific to their design. The developers were working in large, mature open-source codebases—projects with strict review standards and unfamiliar internal logic. The tasks were constrained to two-hour blocks, limiting exploration, and all AI interactions were funneled through a single toolchain
Importantly, the authors emphasize that future systems may overcome the challenges observed here. Improvements in prompting techniques, agent scaffolding, or domain-specific fine tuning could unlock real productivity gains even in the settings tested.
As AI capabilities continue to progress rapidly, the authors frame their findings not as a verdict on the usefulness of AI tools—but as a data point in a fast-evolving landscape that still requires rigorous, real-world evaluation.
MMS • Matt Foster

Meta has begun rewriting its mobile messaging infrastructure in Rust, gradually replacing a legacy C codebase that engineers say had become increasingly difficult to maintain and frustrating to work with. In episode 76 of The Metatech Podcast, members of Meta’s Messaging Infrastructure team outlined their motivations for the transition, citing memory safety, developer happiness and long-term maintainability as the main drivers.
The library at the center of the effort, ships in every Facebook, Messenger, Instagram, Instagram Lite, VR-headset and wearable build, touching billions of users each day.
Developers describe the old C runtime in terms of functions that stretched hundreds of lines and manual memory bookkeeping: variables were allocated at the top of a file and freed a thousand lines later, and even small refactors felt perilous.
Spaghetti begets spaghetti
…Meta software engineer Elaine quipped, capturing a broken-windows effect in which messy code encouraged more mess. Memory-management mistakes occasionally slipped into production and escalated into hard-to-debug on-call incidents.
Rust’s compile-time ownership checks remove entire classes of those errors, but the team emphasizes day-to-day happiness as much as safety. Cleaner semantics, deterministic formatting with rustfmt, and real-time feedback from Rust-Analyzer allow easier iteration and faster feedback. Performance still matters, yet the driving metric has shifted to developer velocity and confidence.
The learning curve for Rust can often be seen as daunting. Most of the engineers tackling the rewrite arrived with little or no Rust background—Elaine jokes she only knew “the crab logo” and later dreamt about the move keyword. To support this transition, the team leaned on One-on-one walkthroughs and patient code reviews to speed up the onboarding.
Meta’s open-code culture also helped: posting questions to specific Rust working-groups brought expert answers, turning a steep learning curve into a shared adventure rather than a solitary hurdle.
Tooling improvements have carried over to operations. Today an engineer can set a breakpoint in a mixed C/Rust stack and watch the debugger hop seamlessly into Rust frames, with fully symbolicated mobile crash logs—support that didn’t exist just months ago.
As happier workflows, faster feedback, and safer refactors take hold, Engineers described feeling more confident making changes, with engineer Buping remarking that Rust’s compile-time checks made it easier to identify and remedy broken code.
The Rust working group has attracted engineers across the organization who are motivated to productionize Rust on mobile. While the long-term roadmap isn’t spelled out, early signs of internal interest suggest a growing appetite for adoption.
Meta’s team felt it was too early to quantify time savings from the migration, but they can take encouragement from others further along the path. Cloudflare reports faster, more reliable development and code that’s easier for engineers to reason about. Google reached a similar conclusion in its shift from C++, noting that contributors required less effort to write, review, and build code in Rust. Together, these examples highlight how developer experience, not just raw performance, is becoming a decisive factor in language and tooling migrations.
MMS • Matt Foster
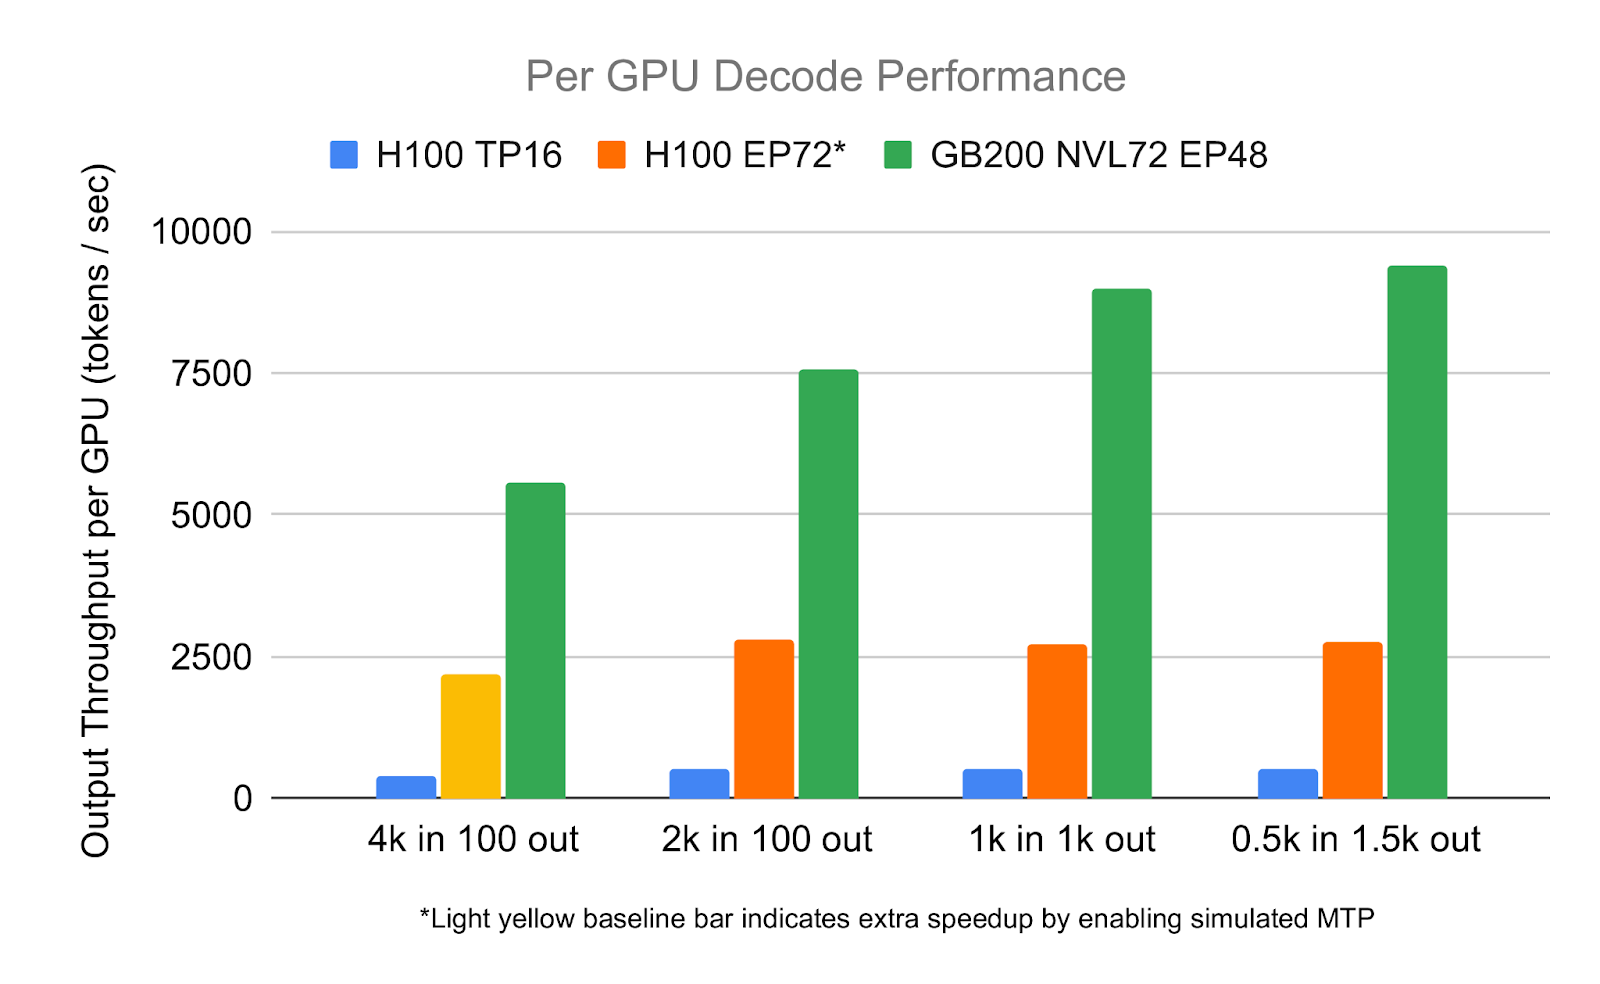
In collaboration with NVIDIA, researchers from SGLang have published early benchmarks of the GB200 (Grace Blackwell) NVL72 system, showing up to a 2.7× increase in LLM inference throughput compared to the H100 on the DeepSeek-V2 671B model.
The uplift is attributed to a suite of software optimizations built for the Blackwell architecture, including FP8-optimized matrix multiplication, accelerated attention kernels, and high-speed token routing over NVLink. These enhancements were integrated into the SGLang runtime to fully exploit GB200’s dense multi-GPU fabric and unified memory model.
NVIDIA’s GB200 NVL72 is positioned as a general-purpose platform for large-scale AI, spanning both training and inference. This benchmark, focused solely on inference, offers an early look at how the system performs under realistic load—before broader workloads like multi-trillion parameter training or multimodal serving are publicly tested.
In decoding benchmarks using a 2,000-token prompt, SGLang achieved 7,583 tokens per second per GPU—a 2.7× improvement over H100 HGX systems on the same workload. This level of throughput enables faster responses for large-context inputs and high concurrency, such as technical document summarization, codebase-aware AI assistants, and enterprise-scale retrieval-augmented generation (RAG). It also reduces the number of GPUs required to serve large models interactively, improving both latency and cost efficiency at scale.
The benchmark was conducted using DeepSeek-V2, a 671-billion parameter, decoder-only large language model. Released by DeepSeek, the model follows a Mixture-of-Experts (MoE) design—activating ~21B parameters per token (≈ 9% of the total)—meaning only a fraction of the parameters are used during inference.
This architecture presents a realistic performance challenge: token routing between experts stresses inter-GPU communication, while the large model size and long prompt lengths place sustained pressure on GPU memory.
To achieve the reported speedup, the SGLang team integrated a series of Blackwell-specific optimizations into their runtime. These include DeepGEMM, a high-performance FP8 matrix multiplication library designed to exploit Blackwell’s new UMMA (Unified Matrix Multiplication Accelerator) instructions; FlashInfer FMHA (Fused Multi-Head Attention), a rewritten fused attention kernel optimized for the DeepSeek model’s prefill phase; and DeepEP, a communication library that efficiently shuffles tokens between routed experts using direct NVLink memory mapping.
The team also employed CUTLASS MLA (Multi-Head Latent Attention), a latent-attention kernel tuned for Blackwell’s memory hierarchy, and Mooncake, a custom transfer engine for disaggregated key-value (KV) cache movement.
Collectively, these components formed a software path that minimized compute, memory, and communication overhead during SGLang’s large-scale multi-GPU inference experiments.
The authors note that while the benchmark demonstrates significant gains in decoding throughput, several areas remain under-optimized. In particular, the prefill stage has yet to be fully tuned, and many kernels do not yet saturate the GB200’s memory bandwidth or compute capacity. Communication and compute are also not fully overlapped, leaving further efficiency gains on the table.
Future work will focus on closing these gaps, with plans to optimize prefill latency and improve memory utilization and latency.
MMS • Matt Foster
AWS has expanded GuardDuty’s threat detection capabilities on EKS clusters, introducing new runtime monitoring features that use a managed eBPF agent to detect container-level threats. The update allows customers to identify suspicious behavior such as credential exfiltration, reverse shells, and crypto mining by analyzing system calls directly from the Kubernetes data plane. GuardDuty joins a growing set of cloud-native security services that embed workload protection into infrastructure through managed integrations rather than user-deployed agents.
Traditional agent-based threat detection in Kubernetes has long faced criticism for adding complexity, requiring elevated privileges, and increasing the attack surface. Agents can be difficult to deploy in managed environments and often consume valuable node resources.
Vendors like Orca Security and Wiz pioneered agentless cloud security by integrating via cloud APIs and snapshots rather than runtime hooks. This approach provides broad visibility—across virtual machines, containers, storage, and IAM configurations—but can miss real-time behaviors requiring OS-level introspection.
GuardDuty takes a hybrid approach. While still using an agent—a DaemonSet deployed to the EKS cluster—it is fully managed by AWS. Customers do not have to install or maintain the agent, and it runs outside the application context, avoiding sidecar or in-container deployments. This approach allows for more granular runtime visibility at the container level.
Open-source projects like Falco and Cilium Tetragon have also explored eBPF-based threat detection, offering powerful capabilities but requiring manual deployment, tuning, and ongoing maintenance. GuardDuty abstracts that complexity for teams operating within the AWS ecosystem.
The service continuously consumes system-level telemetry, analyzing patterns for anomalous or malicious behavior, and publishes findings to the GuardDuty console and EventBridge for integration with incident response workflows.
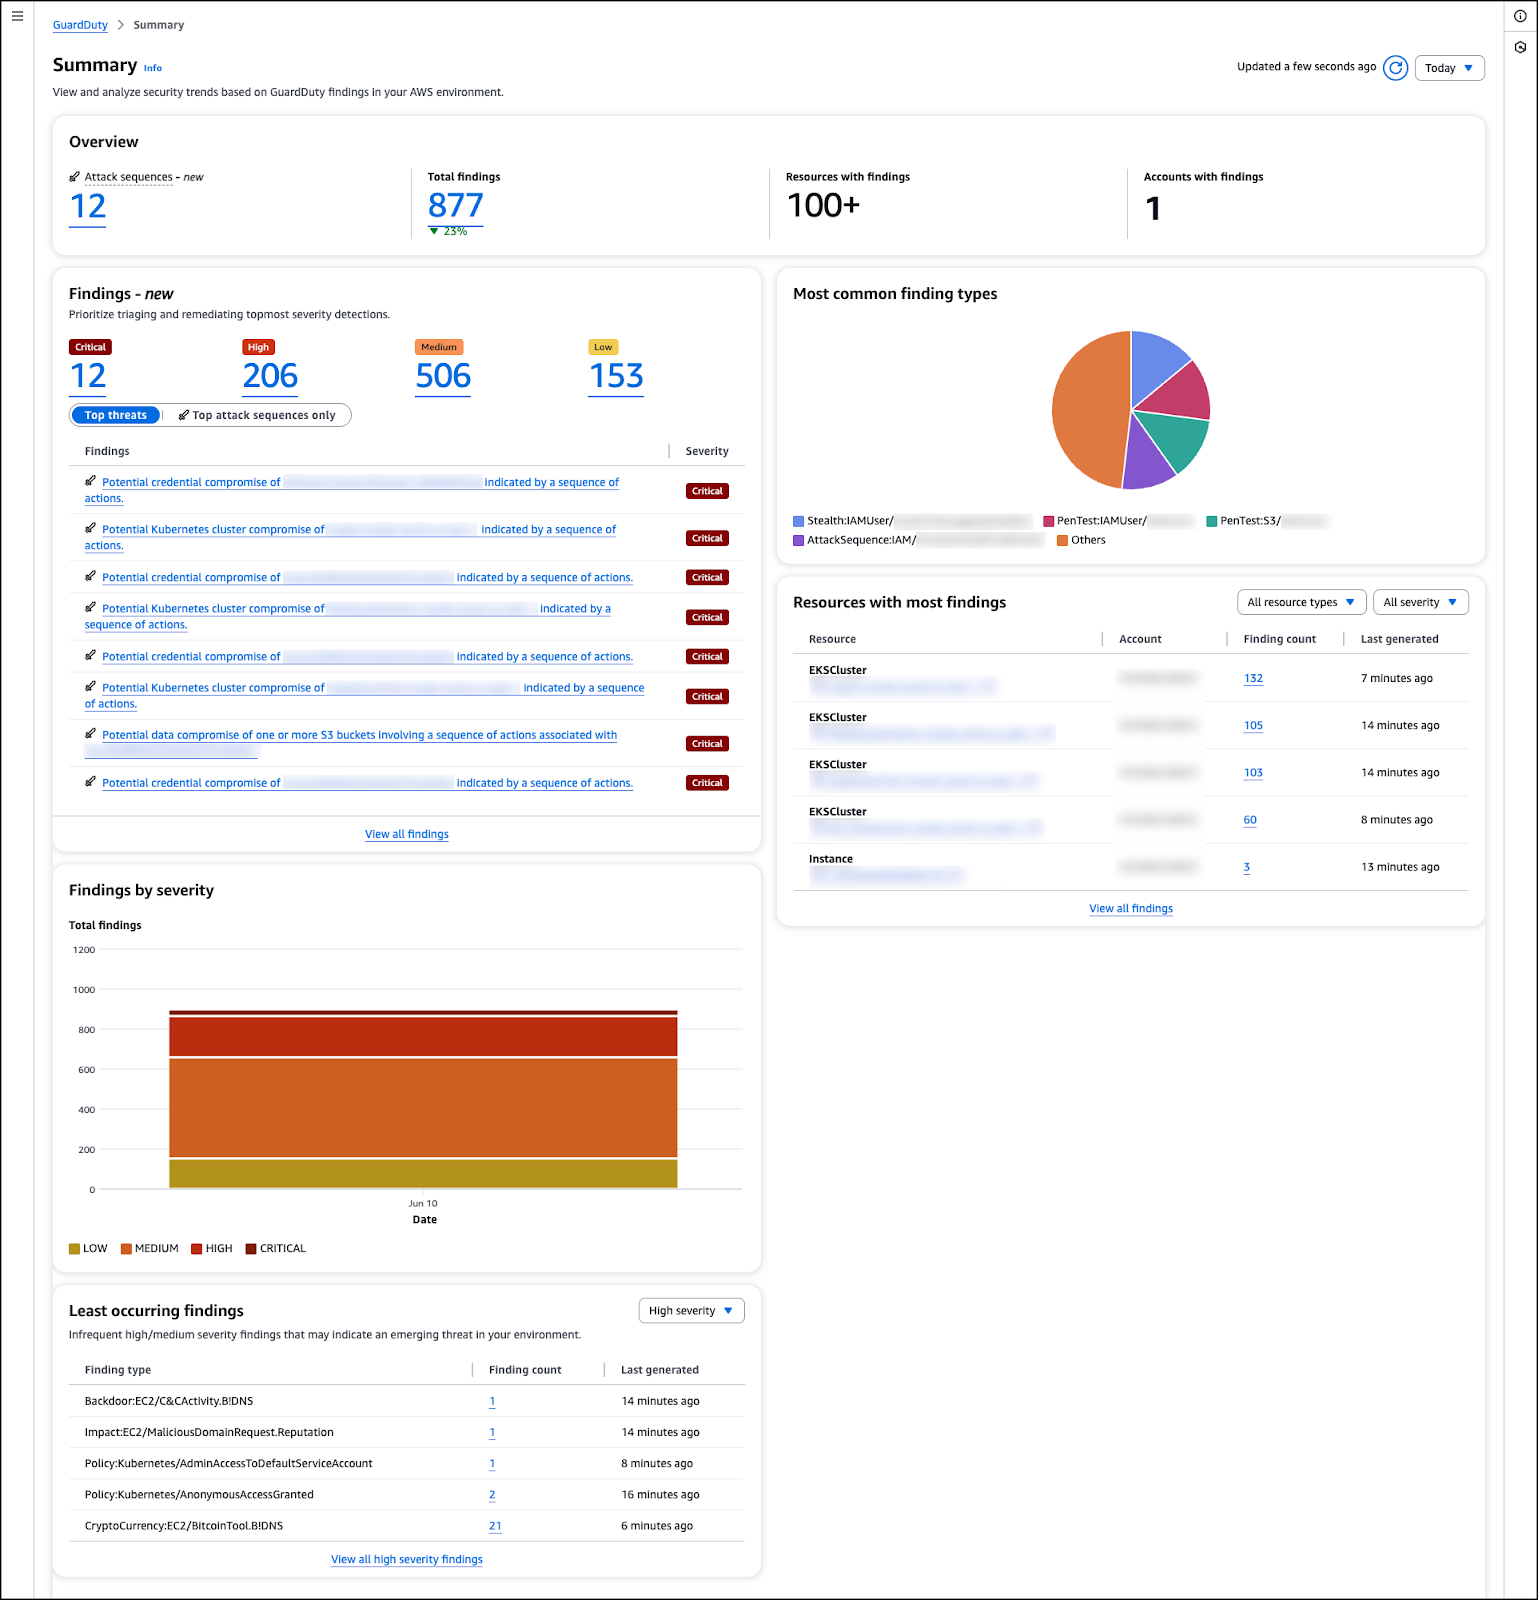
This telemetry is streamed from the data plane, where it’s enriched with context (such as pod metadata, image IDs, and namespace) and analyzed by GuardDuty’s detection engine.
AWS claims the extended suite of telemetry can detect suspicious binary execution, known crypto-mining tools, network connections to threat actors, and potential credential exfiltration.
The feature is currently accessible to users when either EKS Protection or Runtime Monitoring is enabled.
GuardDuty’s EKS extension reflects a broader industry trend: cloud providers are embedding threat detection deeper into their managed infrastructure and offering built-in security capabilities that reduce the need for customer-deployed agents. Microsoft Defender for Containers supports agentless scanning of Azure Kubernetes Service (AKS), while Google Cloud’s Security Command Center includes Kubernetes threat detection through Event Threat Detection (ETD).
This shift is not coincidental. The 2024 State of Kubernetes Security Report highlights that complexity and configuration overhead remain key barriers to adopting Kubernetes security solutions. In this context, GuardDuty’s Extended Threat Detection signals a move toward embedded, opinionated defenses—designed to reduce friction while preserving deep runtime visibility.
Apple Completes Migration of Key Ecosystem Service to Swift, Gains 40% Performance Uplift
MMS • Matt Foster
Apple has migrated its global Password Monitoring service from Java to Swift, achieving a 40% increase in throughput and significantly reducing memory usage—freeing up nearly 50% of previously allocated Kubernetes capacity.
In a recent post, Apple engineers detailed how the rewrite helped the service scale to billions of requests per day while improving responsiveness and maintainability. The team cited lower memory overhead, improved startup time, and simplified concurrency as key reasons for choosing Swift over further JVM optimization.
Swift allowed us to write smaller, less verbose, and more expressive codebases (close to 85% reduction in lines of code) that are highly readable while prioritizing safety and efficiency.
Apple’s Password Monitoring service, part of the broader Password app’s ecosystem, is responsible for securely checking whether a user’s saved credentials have appeared in known data breaches, without revealing any private information to Apple. It handles billions of requests daily, performing cryptographic comparisons using privacy-preserving protocols.
This workload demands high computational throughput, tight latency bounds, and elastic scaling across regions. Traffic fluctuates significantly over the course of a day, with regional peaks differing by up to 50%. To accommodate these swings, the system must quickly spin up or wind down instances while maintaining low-latency responses.
Apple’s previous Java implementation struggled to meet the service’s growing performance and scalability needs. Garbage collection caused unpredictable pause times under load, degrading latency consistency. Startup overhead—from JVM initialization, class loading, and just-in-time compilation, slowed the system’s ability to scale in real time. Additionally, the service’s memory footprint, often reaching tens of gigabytes per instance, reduced infrastructure efficiency and raised operational costs.
Originally developed as a client-side language for Apple platforms, Swift has since expanded into server-side use cases. Apple’s engineering team selected Swift not just for its ecosystem alignment, but for its ability to deliver consistent performance in compute-intensive environments.
The rewrite also used Vapor, a popular Swift web framework, as a foundation. Additional custom packages were implemented to handle elliptic curve operations, cryptographic auditing, and middleware specific to the Password Monitoring domain.
Swift’s deterministic memory management, based on reference counting rather than garbage collection (GC), eliminated latency spikes caused by GC pauses. This consistency proved critical for a low-latency system at scale. After tuning, Apple reported sub-millisecond 99.9th percentile latencies and a dramatic drop in memory usage: Swift instances consumed hundreds of megabytes, compared to tens of gigabytes with Java.
Startup times also improved. Without JVM initialization overhead or JIT warm-up, Swift services could cold-start more quickly, supporting Apple’s global autoscaling requirements.
Apple’s migration reflects a broader trend: the shift toward performance-oriented languages for services operating at extreme scale. Meta has a long history with Rust from hyper-performant Source control solutions to programming languages for the blockchain. Netflix introduced Rend, a high-performance proxy written in Go, to take over from a Java-based client interacting with Memcached. AWS increasingly relies on Rust in services where deterministic performance and low resource usage improve infrastructure efficiency.
While this isn’t a sign that Java and similar languages are in decline, there is growing evidence that at the uppermost end of performance requirements, some are finding that general-purpose runtimes no longer suffice.
MMS • Matt Foster
Have I Been Pwned (HIBP)– the popular data breach notification service founded by security researcher Troy Hunt, has launched a major front-end redesign aimed at improving breach visibility and laying the groundwork for future capabilities. In an interview with InfoQ, Hunt highlighted automation, family account enrollment, and improved enterprise workflows as immediate next steps, while calling for stronger breach disclosure norms across the industry.
The update introduces a modernized user experience and several new pages focused on helping both individuals and organizations more easily monitor exposed credentials and domains.
Hunt emphasizes that the update was not merely a technical overhaul but a response to the evolving needs of the user base. He mentions that after interacting with users worldwide, a recurring theme emerged: the desire for HIBP to be more approachable and user-friendly.
Hunt says the rebuild also lays the groundwork for future capabilities – including support for passkeys and delegated account management that reflect emerging security trends and real-world usage patterns. One example he cites is the ability to enroll family members’ email addresses, aimed at users who act as informal tech support for others.
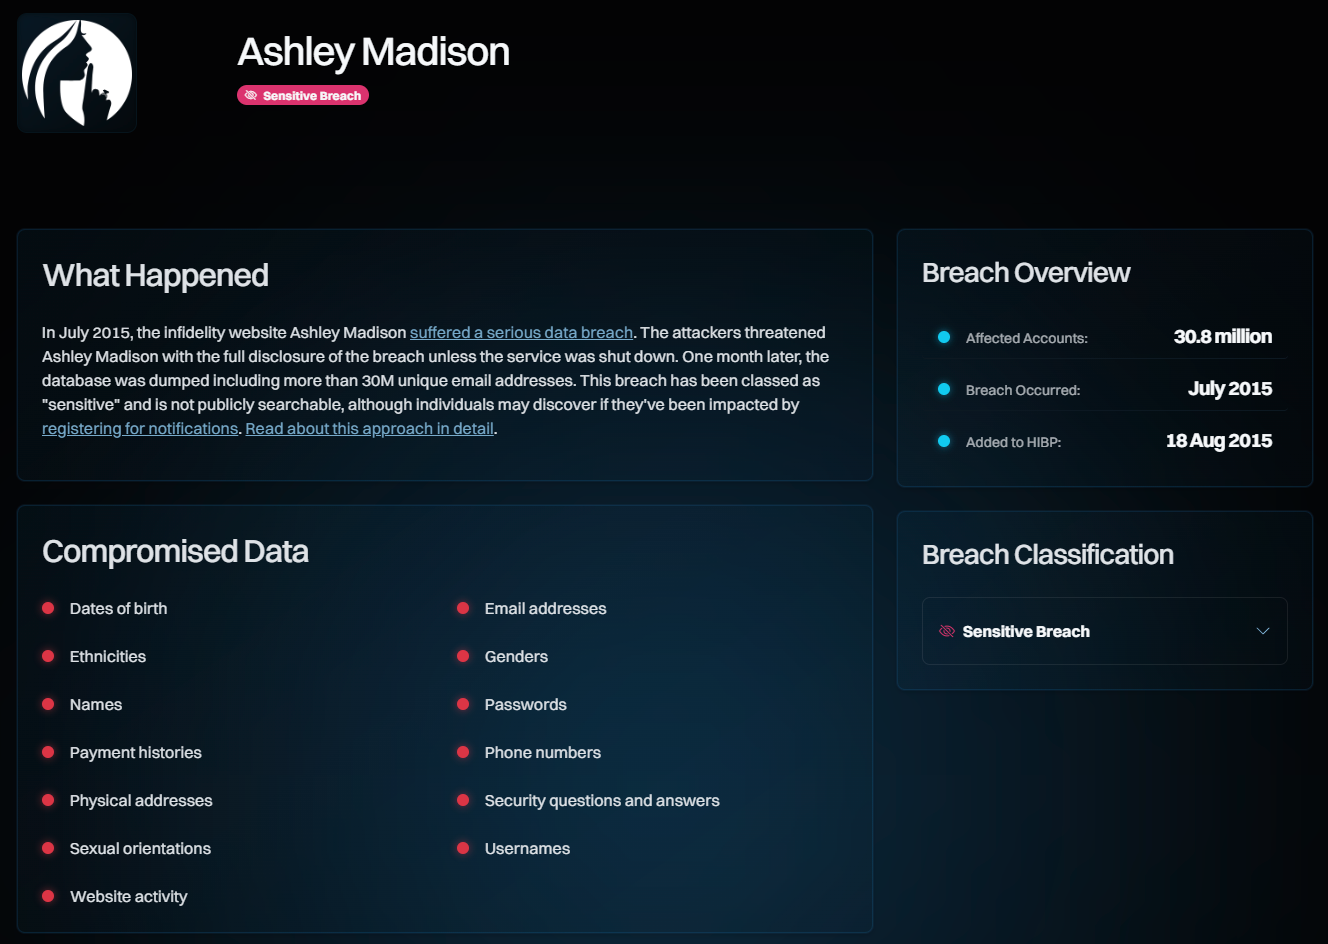
The version 2.0 update introduces several new front-end features aimed at improving usability and situational awareness. The redesigned Search page offers faster response times and a cleaner layout, while a new Breach page (below) provides a clearer breakdown of breach details.
Source: troyhunt.com
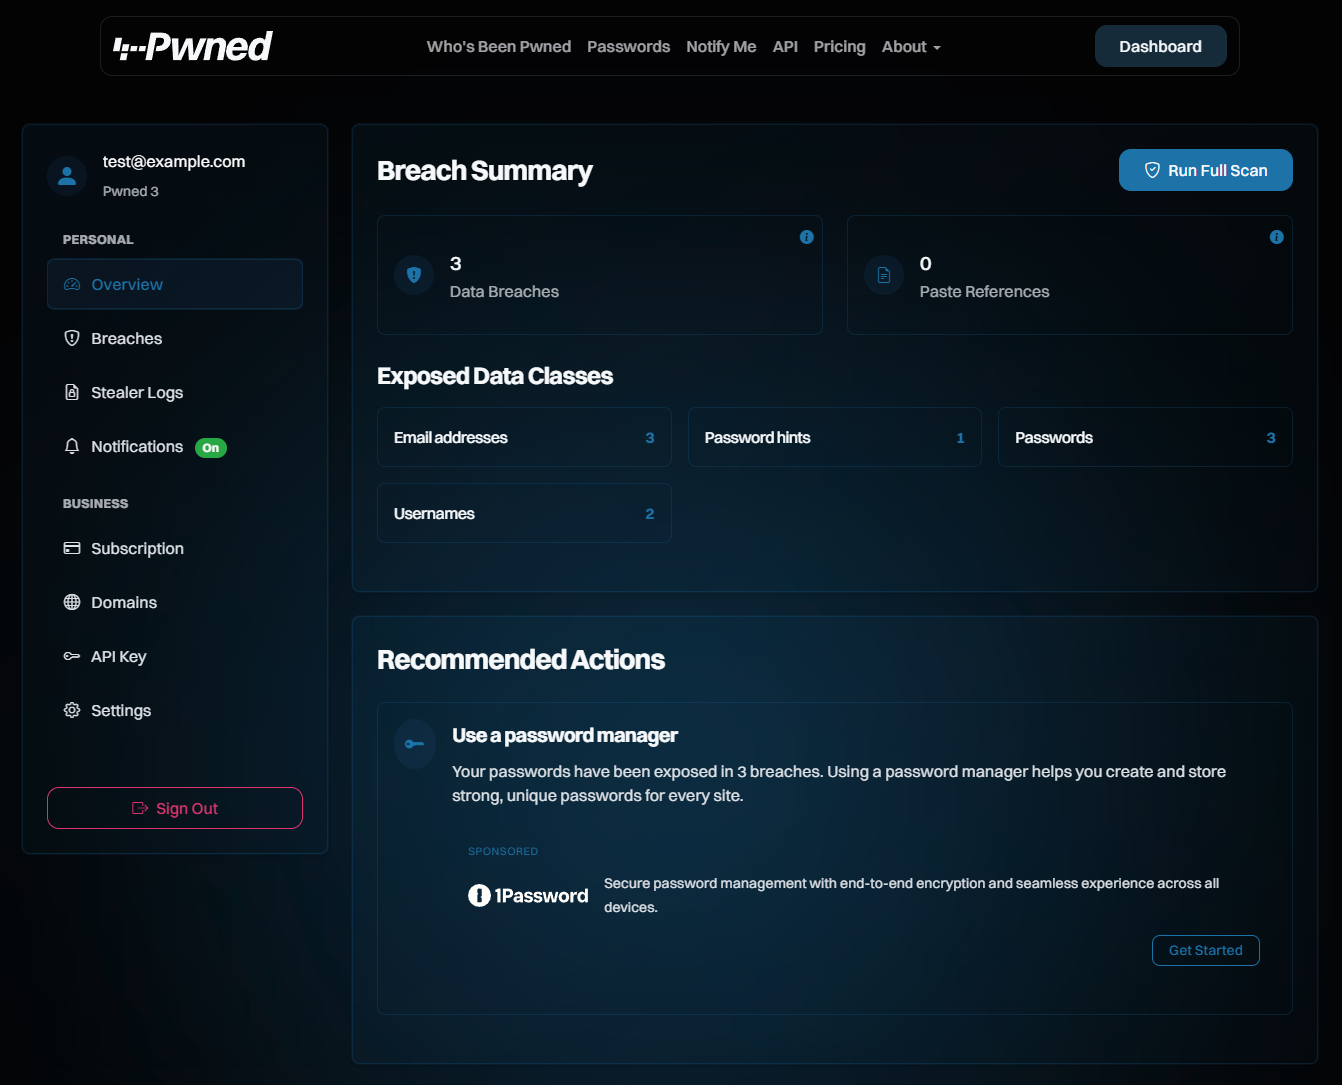
The new dashboard page (below) consolidates a user’s monitored email addresses and domain results into a single view, providing persistent visibility into breach activity without requiring a new search each time.
Source: troyhunt.com
Paying subscribers who manage and monitor multiple domains can view who within their organization has been impacted using the overhauled domain search experience.
Furthermore, Hunt discusses the rationale behind specific, smaller changes, such as the removal of username and phone number search support from the website. He explains that these features were initially introduced for specific incidents but were rarely utilized thereafter. The decision to remove them was based on factors like parsing difficulties, notification limitations, and user confusion.
With growing demand from both individuals and organizations – including those managing large sets of users and domains – automation, visibility, and responsible disclosure are seen as ongoing priorities for the application. InfoQ reached out to Troy Hunt to learn more about the motivations behind the release and where he sees HIBP evolving next.
InfoQ: Do you see HIBP evolving as authentication shifts toward passkeys, federated identity, and AI-driven security tooling?
Troy Hunt: These are all great steps forward, but don’t really change the likelihood of data breaches occurring. They do change the impact of them (i.e. passkeys instead of passwords means no reuse and account takeover due to a leaked password), but it won’t stop all your other PII from being exposed.
InfoQ: Now that the release is live, what capabilities or use cases are you most excited to explore next?
Hunt: This is going to sound really boring, but the next priority is to automate requests that we’re currently manually processing – namely enabling resellers to manage their customers and allowing our Director customers to create quotes without raising tickets for us. This has been a bit of an unfortunate reality with running a service that now has paying customers where we need to help them navigate corporate compliance and procurement regimes, and we want to delegate that work away to automated processes as fast as possible. I’m genuinely excited about now adding features such as the ability to enroll family members’ email addresses for people like me who play tech support for everyone else.
InfoQ: In your view, what areas of breach notification or data protection remain underserved and what innovations might we see in the next few years?
Hunt: This is a massive one for me and I’ve literally been travelling the world talking to governments and law enforcement agencies about this: Disclosure. So often, data breach victims simply aren’t told about their exposure and usually, that’s a completely legal position for the company to take. I wrote about it in depth in September: The Data Breach Disclosure Conundrum.
MMS • Matt Foster
HashiCorp has released the Terraform MCP Server, an open-source implementation of the Model Context Protocol designed to improve how large language models interact with infrastructure as code. By exposing real-time Terraform Registry data—such as module metadata, provider schemas, and resource definitions—in a structured format, the server enables AI systems to ground their suggestions in current, validated configuration patterns. This allows tools like Claude, Co-Pilot and ChatGPT to generate more accurate, context-aware Terraform code by prioritizing canonical sources over outdated or hallucinated examples from training data.
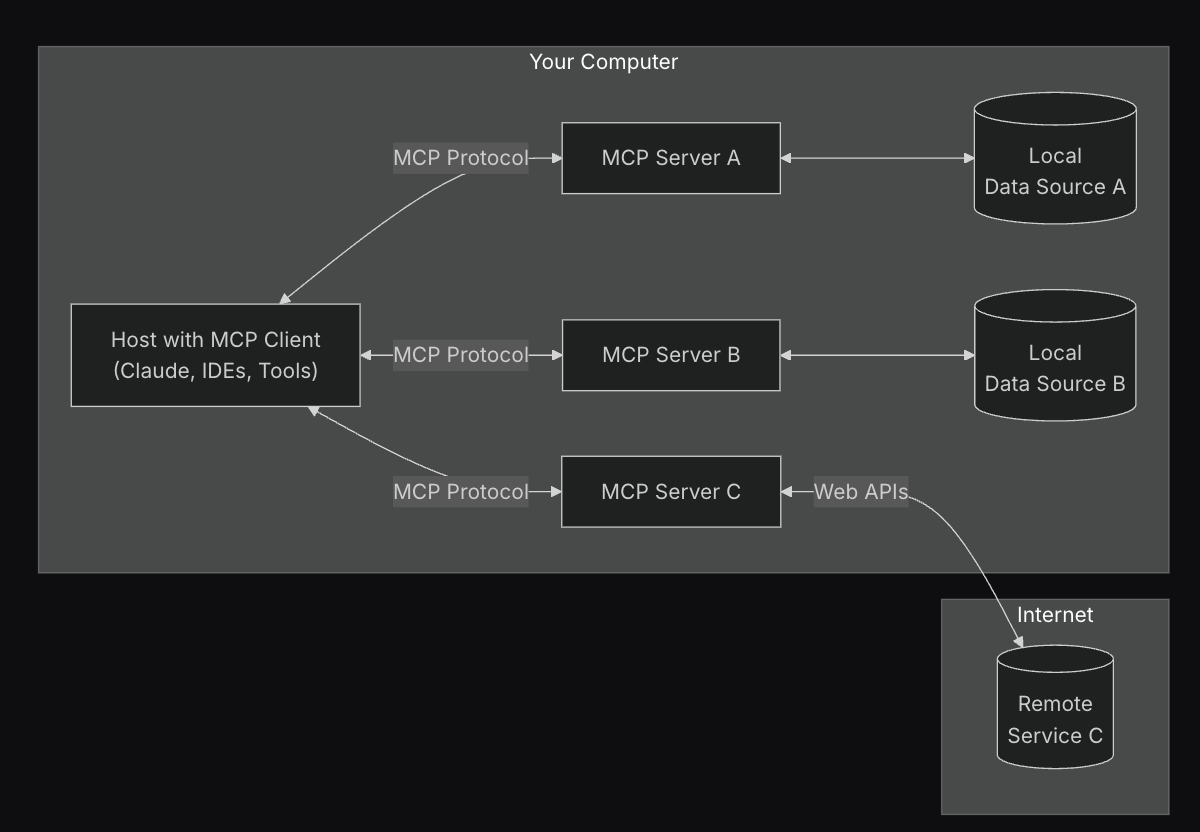
The Model Context Protocol (MCP) is a standard designed to help large language models retrieve structured, machine-readable data from external systems in real time. Rather than relying solely on static training data, AI tools can use MCP to query live sources via JSON-over-gRPC, enabling grounded, context-aware responses. In the Terraform MCP Server implementation, the protocol serves as a bridge between AI systems and the Terraform Registry, exposing data about modules, providers, resources, and their schemas.
This setup allows an AI model to retrieve up-to-date configuration details—such as input arguments for a provider, usage patterns for a popular module, or the latest available version—by issuing standardized queries to an MCP endpoint.
Source Hashicorp
Surfacing this data in a structured format, the server allows AI-assisted tools to align more closely with the latest Terraform standards and configurations. While HashiCorp does not claim specific accuracy improvements yet, it is fair to infer that this approach may help mitigate issues that arise when models rely on outdated or hardcoded infrastructure knowledge (hallucinations).
Although the Terraform MCP Server itself is still in early development, HashiCorp has already demonstrated its integration with GitHub Copilot at Microsoft Build 2025, allowing developers to retrieve context-aware Terraform recommendations grounded in live registry data directly from their IDEs.
Independent projects are also experimenting with the MCP protocol for Terraform: terraform-docs-mcp implements a Node.js-based MCP server to surface module metadata for AI assistants, offering a lightweight alternative for exposing registry data outside the Terraform ecosystem. Meanwhile, tfmcp explores a CLI-driven approach to managing Terraform workflows via LLMs like Claude, enabling tasks such as reading configuration files and analyzing plans through structured prompts. While these community efforts don’t rely on HashiCorp’s implementation, they signal growing interest in the MCP ecosystem as a machine-readable interface to infrastructure knowledge.
Together with other emerging efforts, Terraform MCP Server is another example of a broader pattern in AI-assisted tooling to unify developer workflows. While HashiCorp has not explicitly stated strategic intentions behind MCP, the adoption of such protocols suggests a shift from product-specific AI integrations toward interoperable interfaces designed to support a diverse ecosystem of assistants, clients, and automation workflows.
MMS • Matt Foster

Activision has cut build times for Call of Duty: Modern Warfare II (COD) in half by profiling and optimizing their C++ build system with MSVC Build Insights to uncover bottlenecks in their compilation pipeline.
The effort unblocked developers, accelerated delivery, and reduced idle time. Their success reflects a broader trend across the industry, with teams at Netflix, Canva, and Honeycomb investing in CI performance engineering as a way to improve both productivity and developer experience.
Activision observed that persistent build delays were eroding developer flow and limiting delivery velocity. In response, the Activision team collaborated with Microsoft’s Xbox Advanced Technology Group to instrument and streamline their compilation pipeline. By using MSVC (Microsoft Visual C++) Build Insights, a profiling tool for C++ builds, engineers identified a number of key inefficiencies in their build process. While these specific issues are rooted in C++, they reflect familiar challenges faced when working with large codebases and compute heavy builds.
Among the core inefficiencies, excessive inlining was inflating compile units, link-time optimizations were dragging due to complex initializations, and inefficient symbol resolution was creating CPU stalls during the final linking stage. Each issue contributed to delay in a different part of the process, and together they highlighted how localized inefficiencies – when multiplied across a large codebase – significantly extended build time.
These targeted optimizations led to a substantial reduction in build times – from approximately 28 minutes to 14 minutes. This improvement had significant implications for Activision’s development workflow. Faster builds meant more pull requests merged, more builds, less idle time and ultimately more frequent feature delivery.
But reducing build time isn’t just a technical improvement – it has measurable effects on the developer experience. Michael Vance, SVP and software engineer at Activision, noted that “slow builds create bottlenecks in our continuous integration pipelines, delaying the verification of every piece of code and content that goes into our games.” The team’s build time improvements were not just a performance win, but a way to unblock developers and maintain velocity in a tightly integrated workflow.
This aligns with broader industry findings that highlight developer experience as a key contributor to engineering throughput. Research from GitHub and Microsoft suggests that satisfaction with internal tooling, including CI/CD pipelines, correlates strongly with productivity metrics such as PR cycle time, deployment frequency, and time to resolve issues.
Activision’s experience is indicative of a broader shift in how organizations approach CI performance. As build and test pipelines grow in complexity, teams are applying similar discipline to their profiling and instrumentation as they are with the build artifacts. Netflix reported faster iteration cycles and improved efficiency for Android developers after tuning their Gradle builds. Canva reduced CI durations from over 80 minutes to under 30, improving release velocity and reducing developer frustration. Honeycomb set internal objectives to keep build times under 15 minutes, framing CI speed as a first-class developer productivity metric. In each case, pipeline performance improvements were directly tied to happier, more effective engineering teams.