Month: November 2026

MMS • RSS
Posted on mongodb google news. Visit mongodb google news
MongoDB公司(MDB-US)截至台北時間03日03:21股價下跌17.74美元,報335.22美元,跌幅5.03%,成交量789,978(股),盤中最高價352.06美元、最低價334.31美元。
美股指數盤中表現
- 道瓊指數:+0.63%
- S&P 500指數:-0.2%
- NASDAQ指數:-0.43%
- 費城半導體指數:-2.58%
MongoDB公司(MDB-US)歷史漲跌幅
- 近 1 週:-4.89%
- 近 1 月:+0.35%
- 近 3 月:+4.59%
- 近 6 月:+33.97%
- 今年以來:-15.9%
更多鉅亨報導
Article originally posted on mongodb google news. Visit mongodb google newsCloudflare, MongoDB, Datadog, JFrog, and Elastic shares plummet, what you need to know
MMS • RSS
Posted on mongodb google news. Visit mongodb google news

What happened?
A number of stocks fell in the morning session after software stocks extended the selloff from the previous session as investors continued to reprice valuations amid mounting artificial intelligence capital expenditure concerns and decelerating software bookings.
Oracle filed to raise $20 billion in debt and equity, reigniting concerns over soaring artificial intelligence spending and cash burn. The selloff deepened after quarterly reports from Alphabet and Amazon highlighted soaring data-center outlays that compressed free cash flows, as reported by Bloomberg. That spending concern triggered the tech-heavy Nasdaq’s drop the previous week, cementing its steepest monthly decline in over a year, according to The Wall Street Journal.
Investors are increasingly demanding clear evidence that massive infrastructure outlays will translate into sustainable profits and robust revenue growth. Without immediate monetization from enterprise adoption, concerns over elevated sector valuations have deepened, leading to broad-based selling pressure across chipmakers, hardware providers, and cloud service operators.
The stock market overreacts to news, and big price drops can present good opportunities to buy high-quality stocks.
Among others, the following stocks were impacted:
Zooming in on JFrog (FROG)
JFrog’s shares are extremely volatile and have had 45 moves greater than 5% over the last year. In that context, today’s move indicates the market considers this news meaningful but not something that would fundamentally change its perception of the business.
The previous big move we wrote about was 3 days ago when the stock dropped 8.8% on the news that underwhelming earnings reports from tech giants Amazon and Intel (after mediocre earnings reports from Alphabet and ServiceNow the previous day) sparked widespread investor anxiety regarding aggressive artificial intelligence spending and sustained cash burn. As reported by CNBC, disappointing quarterly reports from both companies triggered a broad slide across technology equities and hardware suppliers, overshadowing positive momentum in other areas of the market. Investors grew increasingly wary of the sector’s rising capital expenditures—the funds poured into long-term assets such as data centers and computing hardware. With both firms spending heavily to build out artificial intelligence infrastructure, market participants are questioning when these massive investments will translate into meaningful revenue and profit growth per CNBC. The steep drops in Amazon and Intel weighed heavily on market indices, showing how vulnerabilities among dominant technology leaders can rapidly dampen confidence across the broader industry.
JFrog is up 48.7% since the beginning of the year, but at $88.55 per share, it is still trading 14.9% below its 52-week high of $104.03 from August 2026. Investors who bought $1,000 worth of JFrog’s shares 5 years ago would now be looking at an investment worth $2,692.
WHILE YOU’RE HERE: The Next Palantir? One satellite company captures images of every point on Earth. Every single day. The Pentagon wants it. Hedge funds are using it to beat earnings. You’ve probably never heard of it.
This is what the early days of Palantir looked like before it became a giant. Same playbook. Different technology. If you missed Palantir, you need to see this. Claim The Stock Ticker for Free HERE.
Article originally posted on mongodb google news. Visit mongodb google news
MMS • RSS
Posted on mongodb google news. Visit mongodb google news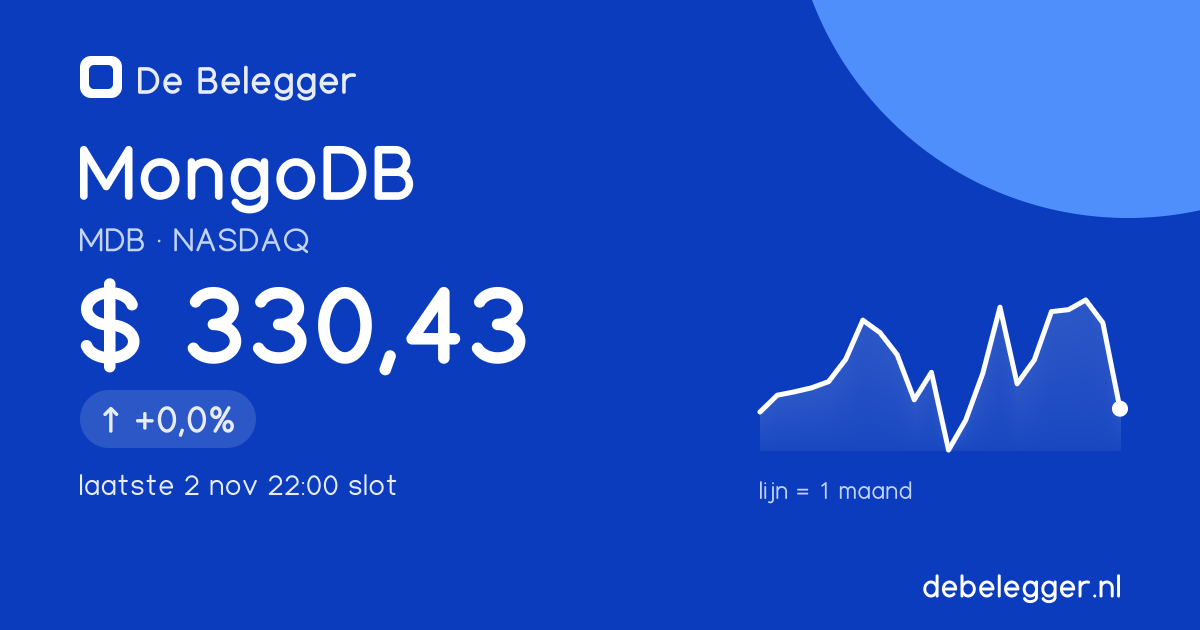
Article originally posted on mongodb google news. Visit mongodb google news
MDB · NASDAQ · Technology · United States · close · price as of 22:00
Updated on November 2, 2026 · price as of Nov 2 22:00 · figures from Nov 2, 2026 · latest article Oct 23, 2026
Latest price · MDB
close
MDB · MongoDB
$330.43
↑ +0.0% (close)
Nabeurs: koers even niet beschikbaar
NASDAQ · USD · closing prices with the source timestamp · line = 1 month
This listing · MDB
home listing · exchange, code, currency and trading hours
- Exchange
- Nasdaq (United States (NYSE and Nasdaq)), United States
- Code
- MDB.US
- Currency
- dollars (USD)
- Trading hours
- 09:30–16:00 local time (15:30–22:00 Dutch time)
- Price
- price as of Nov 2 22:00
- Type
- home listing
- Market cap in dollars
- $28.39B
The price shows the source timestamp. Information, not investment advice.
At a glance · MDB
rules of thumb, not advice
Quality score44 / 100weak · 6 of 8 yardsticks
Dividendno dividendthe return must come from the price
Revenue growth+30.5%last quarter, year over year · net margin 2.1%
More about quality ›More about value and growth ›More about dividend ›More about the figures ›All key figures ›More about the Belegger score ›
Frequently asked questions · MDB
answers from the facts and figures
What is the MongoDB (MDB) stock price today?
The last price of MongoDB is $330.43, as of Nov 2 22:00, on NASDAQ.
What is the MongoDB stock price in euro?
MongoDB also trades in euro, on Frankfurt (floor), under the code 526.F. The last price there is €296.40, as of Nov 2 21:55. That is the price of that listing itself, not a conversion at an exchange rate.
Where is MongoDB listed and what is its ticker?
MongoDB is listed on NASDAQ. The ticker code is MDB; on this page the listing is called MDB.US. MongoDB is also listed on Frankfurt (floor) with 526.F (in euro) and Börse Stuttgart with 526.STU (in euro).
Is MongoDB expensive?
Investors now pay 490.2 times the annual profit of MongoDB (price/earnings) and 47.4 times the expected profit. A historical middle of the price/earnings is not available for this stock. Not advice.
How much dividend does MongoDB pay?
MongoDB pays no dividend; the return must come from the price. Not advice.
How fast is MongoDB growing?
The revenue of MongoDB grew 30.5% in the last quarter compared with a year earlier; earnings per share rose 2.2%. Analysts expect 59.7% revenue growth per year. Not advice.
How strong is the balance sheet of MongoDB?
MongoDB has more cash than debt: $2.4B net cash. Not advice.
What is the Belegger score of MongoDB?
The Belegger score of MongoDB is 28 of 100 (weak) on the method of Buffett and Lynch: Buffett figure 42, Lynch figure 22. Strongest on management (45), weakest on what the price implies (0). Not advice.
What is the market cap of MongoDB?
The market cap of MongoDB is $28.4B. Not advice.
What are the 52-week high and low prices of MongoDB?
The highest price of MongoDB in the past 52 weeks is $473.10 and the lowest $215.68. Not advice.
The answers about the price, the exchange, the codes, the market cap and the 52 weeks reflect the facts on this page; the others are automatically compiled from the key figures using the same fixed rules of thumb as the tiles — no opinion, no forecast. This is not investment advice.
Price · MDB
Closing prices, adjusted for splits and dividends
Other listings of MongoDB
the same company on another exchange or in another currency
Key figures · MDB
ratios & quality
Price/earnings490.2
Forward P/E47.4
PEG ratio1.7
Price/revenue10.2
Price/book value9.5
EV/EBITDA225.8
Gross margin72.7%
Operating margin3.7%
Net margin2.1%
ROE2%
ROA−0.2%
Revenue growth (qtr, yoy)30.5%
Earnings growth (qtr, yoy)2.2%
Net debtnet cash$2.4B more cash than debt
Payout ratio0%
Earnings per share$0.72last 12 months
Market cap$28.4B
Beta1.7
52-week range$215.68 – $473.10
strong average weak — colors are rules of thumb, not advice.
Analysis in plain language · MDB
fixed rules of thumb
- Valuation: investors pay 490.2 times the annual profit (price/earnings) and 47.4 times the expected profit — on the high side according to the rules of thumb in the app.
- Growth: revenue is growing solidly — +30.5% in the last quarter compared with a year earlier; earnings per share +2.2%.
- Margins: of every euro of revenue, 2.1% remains as net profit — a thin margin (gross margin 72.7%).
- Debt: MongoDB has more cash than debt ($2.4B net cash).
- Dividend: MongoDB pays no dividend; the return must come from the price.
- 52 weeks: the price is in the middle of the past year ($215.68 – $473.10), at 45% of that range.
These sentences are automatically compiled from the key figures using the same rules of thumb as the tiles above — no opinion, no forecast. This is not investment advice.
Quality of the company · MDB
eight yardsticks, fixed weights
Quality score44 / 100weak · 6 of 8 yardsticks available
In one sentenceStrong on balance sheet and growth, weak on earnings consistency.
| Yardstick | Value | Sub-score | Weight | Thresholds |
|---|---|---|---|---|
| Revenue growth per year (5 years) (2021–2026) | 33.1% | 100 | 15 | 0% → 0 · 15% → 100 |
| Free cash flow growth per year (5 years) | not available (negative free cash flow at start or end) | – | 10 | 0% → 0 · 15% → 100 |
| Operating margin (last 12 months) | 3.7% | 15 | 15 | 0% → 0 · 25% → 100 |
| Free cash flow margin (average 3 years) (2024–2026) | 11.1% | 55 | 10 | 0% → 0 · 20% → 100 |
| Return on invested capital (last fiscal year) (tax rate 21% (default)) | -7.4% | 0 | 20 | 0% → 0 · 20% → 100 |
| Net debt to EBITDA (net cash) | net cash | 100 | 15 | 3× → 0 · 0× → 100 |
| Earnings consistency (years with profit and higher revenue, of the last 8) (0 of 8 years) | 0% | 0 | 10 | 50% → 0 · 100% → 100 |
| Change in number of shares per year (3 years) | not available (number of shares per fiscal year not in the figures) | – | 5 | 10% per year → 0 · 0% per year → 100 |
Each yardstick counts from 0 to 100, linearly between the two bounds; the score is the weighted average of what is available.
Rules of thumb, not advice. All yardsticks and weights are listed above.
Belegger score · MDB
Buffett and Lynch in one figure from 1 to 100
28weakof 100
Strongest on management (45), weakest on what the price implies (0).
Buffett42quality and balance sheet
Lynch22growth against the price
Lynch type: Turnaround — The last fiscal year (2026) closed with a net loss: in Peter Lynch’s classification a turnaround.
What the price implies
Price/revenue now10.2×market cap divided by annual revenue
Price/revenue over three years5.7×the assumption in the calculation, never higher than now
Revenue growth per year19.3%source: analysts, coming year
Expected return per year−1.8%threshold 10% per year
At 19.3% revenue growth per year (analysts, coming year) and a price/revenue of 5.7 over three years (median of 173 peers), this works out to about −1.8% per year; the price implies 33.6% revenue growth per year.
The checks
| Check | Value | Sub-score | Weight |
|---|---|---|---|
| Buffett — quality and balance sheet · lens 41 | |||
| Net debt to EBITDANet cash: the company has more money in cash than debt, sub-score 100. | net cash | 100 | 30 |
| Return on capitalReturn on invested capital −7.4% (ROIC, last fiscal year): at 0% the sub-score is 0, at 20% 100. | −7.4% | 0 | 25 |
| Operating marginOperating margin 3.7% of revenue: at 0% the sub-score is 0, at 25% 100. | 3.7% | 15 | 15 |
| Years with net profit (of the last 8)0 of the last 8 fiscal years with net profit: at 50% the sub-score is 0, at 100% 100. | 0% | 0 | 15 |
| Free cash flow margin (average 3 years)Free cash flow margin average 11.1% over 2024–2026: at 0% the sub-score is 0, at 20% 100. | 11.1% | 55 | 15 |
| Lynch — growth against the price · lens 43 | |||
| Revenue growth per year (3 fiscal years)Revenue growth 24.3% per year over 2023–2026: at 0% the sub-score is 0, at 20% 100. | 24.3% | 100 | 30 |
| Forward P/E divided by growth (PEG)Forward P/E 61.9 divided by 18.8% growth (analysts, coming year) gives a PEG of 3.3: at 3 times the sub-score is 0, at 0.5 times 100. | 3.3× | 0 | 40 |
| Net profit growth per year (3 fiscal years) | not available (net profit not positive at start or end) | – | 30 |
| Valuation — what the price implies · lens 0 | |||
| Expected return per year (inverse, three years)Expected return about −1.8% per year (revenue method): 0% gives sub-score 0, 10% gives 60, 15% gives 80, 20% or more gives 100. | −1.8% | 0 | 100 |
| Peers — compared with the group · lens 25 | |||
| Forward P/E versus peersForward P/E 61.9 versus a median of 22.6 (ratio 2.74): at 1.4 times the sub-score is 0, at 0.6 times 100. | 2.7× | 0 | 1 |
| Net debt/EBITDA versus peersNet debt/EBITDA 0 versus a median of 0 (difference 0): at 1 times the sub-score is 0, at −1 times 100. | 0× | 50 | 1 |
| Quality score versus peersQuality score 44 versus a median of 54 (difference −10): at −20 points the sub-score is 0, at 20 points 100. | −10 points | 25 | 1 |
| Management — founder at the helm, share buybacks · lens 45 | |||
| Founder at the helmProfessional management, no founder at the helm: sub-score 40. | no | 40 | 70 |
| Change in number of shares per year (3 years)The company bought back on average 0.4% of its market cap per year in its own shares (2024–2026, approximation from the cash flow): at 3% per year the sub-score is 0, at −3% per year 100. | −0.4% per year | 56 | 30 |
Each check counts from 0 to 100, linearly between the two bounds; per lens the weighted average of what is available. The lenses weigh: Buffett 35, valuation 30, Lynch 15, peers 10, management 10 — reweighted over what is available.
Peers
| Metric | This company | Group median |
|---|---|---|
| Forward P/E | 61.9× | 22.6× |
| Price/revenue | 10.2× | 5.7× |
| Net debt/EBITDA | net cash | net cash |
| Quality score | 44 | 54 |
| Revenue growth per year | 24.3% | 15.4% |
173 companies in the same industry (Technology), median of the group against this company. Compared with 173 companies in the same industry (Software – Infrastructure): forward P/E 61.9 versus 22.6, net debt/EBITDA 0 versus 0, quality score 44 versus 54.
Management
Founder at the helm: no, professional management. Management: Mr. Dev C. Ittycheria (Interim President & CEO and Director), Mr. Dwight A. Merriman (Co-Founder & Director), Mr. Michael J. Berry (CFO & Principal Financial Officer).
Number of shares: −0.4% per year over three years (sub-score 56).
Professional management, no founder at the helm; the company bought back on average 0.4% of its market cap per year in its own shares.
Only figures from the annual accounts and analyst forecasts. Not advice.
What is it worth? · MDB
worked example
Expected revenue growth+59.7%/yranalysts, average per year (2018–2019–2020)
Expected earnings growth per share+19.4%/yranalysts (2018–2019–2020)
Price target (average)$452.50+36.9% t.o.v. $330.43
Analysts4032 positive · 8 neutral · 0 negative (third-party opinion)
What if…
| Scenario | Growth/yr | Margin | K/W | Price in 3 yrs | Per year |
|---|---|---|---|---|---|
| Pessimistic | 54.7% | 1.1% | 37.9× | $49.99 | −46.7% |
| Base | 59.7% | 2.1% | 47.4× | $131.32 | −26.5% |
| Optimistic | 64.7% | 4.1% | 56.9× | $337.58 | +0.7% |
| Scenario | Growth/yr | Margin | K/W | Price in 5 yrs | Per year |
|---|---|---|---|---|---|
| Pessimistic | 54.7% | 1.1% | 37.9× | $119.64 | −18.4% |
| Base | 59.7% | 2.1% | 47.4× | $334.91 | +0.3% |
| Optimistic | 64.7% | 4.1% | 56.9× | $915.73 | +22.6% |
| Scenario | Growth/yr | Margin | K/W | Price in 10 yrs | Per year |
|---|---|---|---|---|---|
| Pessimistic | 54.7% | 1.1% | 37.9× | $1,060.08 | +12.4% |
| Base | 59.7% | 2.1% | 47.4× | $3,478.96 | +26.5% |
| Optimistic | 64.7% | 4.1% | 56.9× | $11,097.75 | +42.1% |
Starting values: revenue growth 59.7% (analyst forecast), net margin 2.1%, P/E 47.4×, dividend 0%. Pessimistic/Optimistic: growth ∓5 point, margin ∓2 point, P/E ×0.8/×1.2.
Worked example — no forecast, no advice; analyst forecasts come from third parties and may be wrong. Revenue × (1 + growth)^years × margin ÷ shares × price/earnings = price at the horizon; dividend adds to the annual return. In the app you edit all assumptions yourself.
- Dec 7, 2026Quarterly figures
Newsroom on MongoDB
the latest De Belegger articles about this company (in Dutch)
News · MDB
from the De Belegger newsroom
Kan de teruggekeerde CEO MongoDB door de AI-omslag loodsen?
Dev Ittycheria keerde op 28 september terug als interim-CEO. Een dag later presenteerde MongoDB Atlas Infinite, dat rekenkracht en opslag onafhankelijk schaalt. Beide stappen kunnen klanten helpen, maar beleggers hebben
Oct 21, 2026 · De Belegger
Winst volgens de boeken is bij MongoDB pas het begin
MongoDB boekte in het tweede kwartaal $28,4 miljoen GAAP-operationele winst tegenover $185,9 miljoen aangepaste winst. De verbetering is echt, maar bij $347,68 moet winst per aandeel nog jaren veel sneller groeien.
Oct 20, 2026 · De Belegger
MongoDB haalt Ittycheria binnen een jaar terug aan het roer
MongoDB meldde op 28 september dat CJ Desai direct vertrok en Dev Ittycheria tijdelijk terugkeerde als CEO. De jaarverwachting bleef staan, maar de onderneming zoekt opnieuw een vaste leider terwijl groei, marge en AI-pr
Oct 19, 2026 · De Belegger
MongoDB groeit buiten Atlas sneller dan in de cloud
MongoDB groeide in het tweede kwartaal 30% naar $771,8 miljoen omzet. Atlas groeide ongeveer 29%, terwijl Enterprise Advanced en overige omzet 36% stegen. Dat maakt de omzet robuuster, maar ook minder eenvoudig te waarde
Oct 17, 2026 · De Belegger
Press releases · MDB
automatically compiled from the company’s press releases
Together we own · MDB
members of De Belegger
In profit90%of the holders
Avg. return+35.2%per holder
Weighting4.6%avg. in portfolio
Of the company0.0146%of the outstanding shares
Percentages only, aggregated across all members — never amounts, never traceable to a single member.
Sector and exchange peers
stocks with a public page in the same sector or on the same exchange
All stocks on United States (NYSE and Nasdaq) › Sector Technology › A to Z ›
Share this stock
the public page, readable without logging in
Become a member of De Belegger
All prices include VAT. Choose once, everything open right away.
Honorary member
€1,500 one-off
- Unlimited access to columns, news, in-depth pieces and analysis on the very best stocks
- Real depth on the figures and the management
- The De Belegger portfolio, shared with commentary on every transaction
- Training courses that make you the very best investor, always in control
- Everything on the site and in the app
simply always access to everything
Featured
5 Year
€799 one-off
- Unlimited access to columns, news, in-depth pieces and analysis on the very best stocks
- Real depth on the figures and the management
- The De Belegger portfolio, shared with commentary on every transaction
- Training courses that make you the very best investor, always in control
- Everything on the site and in the app
expires automatically after 5 years, no subscription
We only want happy customers: not satisfied within 14 days, and you get your money back. Also possible per half year: €199 every 6 months.
More in the app. Members of De Belegger also see on this stock page their own position, the comparison with the other holders, the calendar with reporting dates and ex-dividend, their watchlist and the messages from other members about $MDB — and can embed every block on their own site.
Open $MDB in the app (log in)Free accountBecome a member of De Belegger
MMS • RSS
Posted on mongodb google news. Visit mongodb google news
Proposed sale
10,000 shares
Common stock listed for sale on November 2, 2026
Aggregate market value
$3,487,942.67
For the 10,000-share block listed for November 2, 2026
Proposed sale
3,000 shares
Common stock listed for sale on November 2, 2026
Aggregate market value
$1,050,505.91
For the 3,000-share block listed for November 2, 2026
Proposed sale
6,275 shares
Common stock listed for sale on November 2, 2026
Aggregate market value
$2,162,887.49
For the 6,275-share block listed for November 2, 2026
Article originally posted on mongodb google news. Visit mongodb google news
MMS • RSS

Proposed sale
10,000 shares
Common stock listed for sale on November 2, 2026
Aggregate market value
$3,487,942.67
For the 10,000-share block listed for November 2, 2026
Proposed sale
3,000 shares
Common stock listed for sale on November 2, 2026
Aggregate market value
$1,050,505.91
For the 3,000-share block listed for November 2, 2026
Proposed sale
6,275 shares
Common stock listed for sale on November 2, 2026
Aggregate market value
$2,162,887.49
For the 6,275-share block listed for November 2, 2026
MMS • Sergio De Simone
Article originally posted on InfoQ. Visit InfoQ
TorchTPU is an open-source project developed by Google in collaboration with Meta that provides a native PyTorch backend for Google TPUs. It enables PyTorch workloads to execute on TPU hardware with minimal code modifications, supporting eager and compiled execution, distributed computing, and hardware-specific optimizations.
Google began enabling PyTorch workloads to run on TPUs in 2020 through PyTorch/XLA, which leveraged JAX, XLA, and lazy tensors. According to Google, this approach had significant shortcomings:
Crucially, PyTorch/XLA required intrusive source-code modifications to explicitly define compilable regions, suffered from severe compile-time latency, lacked support for PyTorch’s native imperative (“eager”) execution mode, and lagged in supporting emerging distributed computing primitives within the PyTorch ecosystem.
TorchTPU takes a fundamentally different approach, making eager execution a top priority, and enabling existing PyTorch workloads to run out with minor code modifications.
Specifically, migrating from GPUs to TPUs involves replacing the cuda device with tpu and the nccl distributed backend with tpu_dist. Alternatively, developers can use the new torch.accelerator.current_accelerator API to identify the available accelerator, as shown in the following snippet.
import torch
import torch.distributed as dist

def main():
    device = torch.device("cuda") # -> device = torch.accelerator.current_accelerator
    dist.init_process_group(backend="nccl") # -> dist.init_process_group()
    rank = dist.get_rank()
    word_size = dist.get_world_size()
    ...
    model = model.to(device)
    ...
TorchTPU support three eager execution modes: strict, debug, and DeferAndFuse. The latter is a new hybrid eager/compiled execution mode that Google claims “can be 50% or more faster than Strict Eager while reducing peak HBM memory”.
To test TorchTPU’s ability to run existing PyTorch models with no modifications, Google built an integration pipeline to evaluate about 5,000 Hugging Face models across 500+ architectures in both eager and compiled modes on TPU hardware generations starting from v5e.
We use a robust testing methodology grounded in corpus stratification and balanced architectural selection. Our approach relies on a two-tiered selection process designed to balance real-world adoption with broad architectural diversity, avoiding redundant testing of minor variations while ensuring real production weights are thoroughly evaluated.
To validate TorchTPU’s performance, Google ran a 30-billion parameter Muse Glimmer model implemented in standard PyTorch. On a single TPUv7 chip, inference throughput reached 25.7k token/s at 5120 sequence length and 22.4k token/s at 10,240 sequence length. For training, using four TPUv7 chips, throughput reached 5.6k token/s and 4.6k token/s at 5120 and 10,240 sequence length, respectively.
Google also conducted experiments using Qwen3 MoE 235B for training workloads, scaling from 1,024 to 8,192 TPUv7 chips. For inference, Google reported competitive performance-per-dollar for large-scale MoE workloads using vLLM.
Commenting on the announcement, Hacker News user tingkuanpei observed:
Very interesting work. Google should have done this a long time ago. PyTorch’s ecosystem is just so rich.
Other users pointed out that beyond offering TPUs through GCP, Google sells them to “enterprise client for on premises deployments”, which include Anthropic and in Meta following potentially in the future.
TorchTPU is still at an early stage and therefore in continuous evolution. The project’s roadmap include work on dynamic shapes, compilation performance, operator coverage, reinforcement learning, and quantization. For further details, make sure to read the original announcement, which provides a more comprehensive view of TorchTPU’s architecture and scope.
Java News Roundup: TornadoVM 8.0, JNoSQL, Endive, JReleaser, JBang, LangChain4j, Quarkus Almanac
MMS • Michael Redlich
Article originally posted on InfoQ. Visit InfoQ
This week’s Java roundup for October 26th, 2026, features news highlighting: the GA release of TornadoVM 8.0; point releases of JNoSQL, Endive, JBang, JReleaser and LangChain4j; a maintenance release of JobRunr; beta releases of Hibernate ORM and Hibernate Reactive; and introducing the Quarkus Almanac.
JDK 28
Build 22 of the JDK 28 early-access builds was made available this past week featuring updates from Build 21 that include fixes for various issues. More details on this release may be found in the release notes.
For JDK 28, developers are encouraged to report bugs via the Java Bug Database.
TornadoVM
The release of TornadoVM 8.0.0 delivers their new pure-Java compiler, known as the TornadoVM Compiler (TC), that compiles Java kernels to CUDA C++, OpenCL C or Metal Shading Language. This replaces the Graal Compiler and Java-Level JVM Compiler Interface (JVMCI) that have been integral to TornadoVM for the past ten years. Developers won’t need to change their code with TC. Classes such as TaskGraph, TornadoExecutionPlan and KernelContext, and annotations such as @Parallel and @Reduce will work with TC.
TornadoVM now takes advantage of GraalVM Native Image and JEP 516, Ahead-of-Time Object Caching with Any GC, under the auspices of Project Leyden for improved startup time. Further details on this release may be found in the release notes.
Eclipse JNoSQL
The release of Eclipse JNoSQL 1.2.0, a compatible implementation of the Jakarta NoSQL and Jakarta Data specifications, ships with notable changes such as: a new VectorTemplate interface to support vector databases; integrations of the Milvus, Qdrant, and Weaviate vector databases for vector search; and new fluent temporal query operations for working with time-series data. More details on this release may be found in the release notes.
Endive
The release of Endive 1.2.0 provides bug fixes, dependency upgrades and new features such as: support for SIMD instructions, by default, in the interpreter on JDK 11+ without the need to add or configure; improvements to Redline, their experimental, ahead-of-time (AOT) compiler, for more GC-friendly native memory; and continuous improvement on the Endive Component Model, an implementation of the WebAssembly Component Model Design and Specification, to support the Endive runtime. Further details on this release may be found in the release notes.
JBang
The release of JBang 0.143.0 delivers bug fixes, documentation improvements and two new features: replace use of SDKMan with mise-en-place as the former does not support WindowsOS; and a new unified syntax to execute a specific version of an alias. More details on this release may be found in the release notes.
JReleaser
The release of JReleaser 1.27.0 ships with bug fixes, documentation improvements, dependency upgrades and new features such as: the ability for the support for the JReleaser Tool Provider to be invoked and/or loaded using Java Modules; improved generation of the changelog when GitHub issues are linked inside commit messages; and the removal of XPath to parse POM files as there were issues when packaging JReleaser as a native image. Further details on this release may be found in the release notes.
LangChain4j
The formal release (along with the thirty-third beta release) of LangChain4j 1.23.0 provides bug fixes, documentation improvements, dependency upgrades and new features such as: a new OllamaDecisionModel class to support decision models running in Ollama; and a new ConfidenceCascadePlanner class as a confidence cascade decision model-based agentic pattern. More details on this release may be found in the release notes.
Hibernate
The fourth beta release of Hibernate ORM 8.0.0 delivers bug fixes and notable changes such as: the ability to directly declare the @Filter and @SQLRestriction annotations on associations with the Jakarta Persistence @ManyToOne and @OneToOne annotations that include associations mapped using join tables; and a new @GeneratorOptimizer annotation that selects a “standard optimizer for sequence or table identifier generation directly on an identifier field or getter.“
The first and third beta releases of Hibernate Reactive 5.1.0 and 5.0.0, respectively, ship with bug fixes and notable changes such as: a new platform Bill of Materials that manages the versions of Hibernate Reactive, Hibernate ORM and Vert.x SQL clients; and a version check during bootstrap to ensure that Hibernate ORM and Vert.x SQL clients on the classpath aren’t older than the minimum versions it supports. Both of these versions are compatible with Hibernate ORM 8.0.0.Beta4.
JobRunr
The release of JobRunr 9.0.3 provides bug fixes, documentation improvements and dependency upgrades and one new feature that updates the JobHandler class that improves the log messaging from the JobZooKeeper class. Further details on this release may be found in the release notes.
Gradle
The first release candidate of Gradle 9.9.0 delivers notable changes such as: the ability for Kotlin DSL scripts to be incrementally compiled using the Kotlin Build Tools API for improved build performance; new test filters that may be applied to JUnit Platform tests that are not declared as methods; and improvements to the Problems API that provides a predefined hierarchy of problem groups from the Problems interface. More details on this release may be found in the release notes.
Quarkus Almanac
The Quarkus team has introduced the Quarkus Almanac, a utility for developers to compare changes between two releases. These changes include configuration properties, managed dependencies, extensions, and the API of the classes in the Quarkus jars. Developers can go as far back as November 2018 when Quarkus 0.0.1 was released.
MMS • RSS
Posted on mongodb google news. Visit mongodb google news
MongoDB公司(MDB-US)截至台北時間02日23:01股價下跌17.84美元,報335.13美元,跌幅5.05%,成交量176,509(股),盤中最高價352.06美元、最低價335.00美元。
美股指數盤中表現
- 道瓊指數:+0.97%
- S&P 500指數:+0.59%
- NASDAQ指數:+0.73%
- 費城半導體指數:+0.41%
MongoDB公司(MDB-US)歷史漲跌幅
- 近 1 週:-4.89%
- 近 1 月:+0.35%
- 近 3 月:+4.59%
- 近 6 月:+33.97%
- 今年以來:-15.9%
更多鉅亨報導
Article originally posted on mongodb google news. Visit mongodb google newsCloudflare, MongoDB, Datadog, JFrog, and Elastic shares plummet, what you need to know
MMS • RSS
Posted on mongodb google news. Visit mongodb google news
What happened?
A number of stocks fell in the morning session after software stocks extended the selloff from the previous session as investors continued to reprice valuations amid mounting artificial intelligence capital expenditure concerns and decelerating software bookings.
Oracle filed to raise $20 billion in debt and equity, reigniting concerns over soaring artificial intelligence spending and cash burn. The selloff deepened after quarterly reports from Alphabet and Amazon highlighted soaring data-center outlays that compressed free cash flows, as reported by Bloomberg. That spending concern triggered the tech-heavy Nasdaq’s drop the previous week, cementing its steepest monthly decline in over a year, according to The Wall Street Journal.
Investors are increasingly demanding clear evidence that massive infrastructure outlays will translate into sustainable profits and robust revenue growth. Without immediate monetization from enterprise adoption, concerns over elevated sector valuations have deepened, leading to broad-based selling pressure across chipmakers, hardware providers, and cloud service operators.
The stock market overreacts to news, and big price drops can present good opportunities to buy high-quality stocks.
Among others, the following stocks were impacted:
Zooming in on JFrog (FROG)
JFrog’s shares are extremely volatile and have had 45 moves greater than 5% over the last year. In that context, today’s move indicates the market considers this news meaningful but not something that would fundamentally change its perception of the business.
The previous big move we wrote about was 3 days ago when the stock dropped 8.8% on the news that underwhelming earnings reports from tech giants Amazon and Intel (after mediocre earnings reports from Alphabet and ServiceNow the previous day) sparked widespread investor anxiety regarding aggressive artificial intelligence spending and sustained cash burn. As reported by CNBC, disappointing quarterly reports from both companies triggered a broad slide across technology equities and hardware suppliers, overshadowing positive momentum in other areas of the market. Investors grew increasingly wary of the sector’s rising capital expenditures—the funds poured into long-term assets such as data centers and computing hardware. With both firms spending heavily to build out artificial intelligence infrastructure, market participants are questioning when these massive investments will translate into meaningful revenue and profit growth per CNBC. The steep drops in Amazon and Intel weighed heavily on market indices, showing how vulnerabilities among dominant technology leaders can rapidly dampen confidence across the broader industry.
JFrog is up 48.7% since the beginning of the year, but at $88.55 per share, it is still trading 14.9% below its 52-week high of $104.03 from August 2026. Investors who bought $1,000 worth of JFrog’s shares 5 years ago would now be looking at an investment worth $2,692.
WHILE YOU’RE HERE: The Next Palantir? One satellite company captures images of every point on Earth. Every single day. The Pentagon wants it. Hedge funds are using it to beat earnings. You’ve probably never heard of it.
This is what the early days of Palantir looked like before it became a giant. Same playbook. Different technology. If you missed Palantir, you need to see this. Claim The Stock Ticker for Free HERE.
Article originally posted on mongodb google news. Visit mongodb google news
MMS • Sergio De Simone

TorchTPU is an open-source project developed by Google in collaboration with Meta that provides a native PyTorch backend for Google TPUs. It enables PyTorch workloads to execute on TPU hardware with minimal code modifications, supporting eager and compiled execution, distributed computing, and hardware-specific optimizations.
Google began enabling PyTorch workloads to run on TPUs in 2020 through PyTorch/XLA, which leveraged JAX, XLA, and lazy tensors. According to Google, this approach had significant shortcomings:
Crucially, PyTorch/XLA required intrusive source-code modifications to explicitly define compilable regions, suffered from severe compile-time latency, lacked support for PyTorch’s native imperative (“eager”) execution mode, and lagged in supporting emerging distributed computing primitives within the PyTorch ecosystem.
TorchTPU takes a fundamentally different approach, making eager execution a top priority, and enabling existing PyTorch workloads to run out with minor code modifications.
Specifically, migrating from GPUs to TPUs involves replacing the cuda device with tpu and the nccl distributed backend with tpu_dist. Alternatively, developers can use the new torch.accelerator.current_accelerator API to identify the available accelerator, as shown in the following snippet.
import torch
import torch.distributed as dist

def main():
    device = torch.device("cuda") # -> device = torch.accelerator.current_accelerator
    dist.init_process_group(backend="nccl") # -> dist.init_process_group()
    rank = dist.get_rank()
    word_size = dist.get_world_size()
    ...
    model = model.to(device)
    ...
TorchTPU support three eager execution modes: strict, debug, and DeferAndFuse. The latter is a new hybrid eager/compiled execution mode that Google claims “can be 50% or more faster than Strict Eager while reducing peak HBM memory”.
To test TorchTPU’s ability to run existing PyTorch models with no modifications, Google built an integration pipeline to evaluate about 5,000 Hugging Face models across 500+ architectures in both eager and compiled modes on TPU hardware generations starting from v5e.
We use a robust testing methodology grounded in corpus stratification and balanced architectural selection. Our approach relies on a two-tiered selection process designed to balance real-world adoption with broad architectural diversity, avoiding redundant testing of minor variations while ensuring real production weights are thoroughly evaluated.
To validate TorchTPU’s performance, Google ran a 30-billion parameter Muse Glimmer model implemented in standard PyTorch. On a single TPUv7 chip, inference throughput reached 25.7k token/s at 5120 sequence length and 22.4k token/s at 10,240 sequence length. For training, using four TPUv7 chips, throughput reached 5.6k token/s and 4.6k token/s at 5120 and 10,240 sequence length, respectively.
Google also conducted experiments using Qwen3 MoE 235B for training workloads, scaling from 1,024 to 8,192 TPUv7 chips. For inference, Google reported competitive performance-per-dollar for large-scale MoE workloads using vLLM.
Commenting on the announcement, Hacker News user tingkuanpei observed:
Very interesting work. Google should have done this a long time ago. PyTorch’s ecosystem is just so rich.
Other users pointed out that beyond offering TPUs through GCP, Google sells them to “enterprise client for on premises deployments”, which include Anthropic and in Meta following potentially in the future.
TorchTPU is still at an early stage and therefore in continuous evolution. The project’s roadmap include work on dynamic shapes, compilation performance, operator coverage, reinforcement learning, and quantization. For further details, make sure to read the original announcement, which provides a more comprehensive view of TorchTPU’s architecture and scope.