AWS Makes it Simpler to Share ML Models and Notebooks with Amazon SageMaker JumpStart

MMS Founder
MMS Daniel Dominguez

Article originally posted on InfoQ. Visit InfoQ

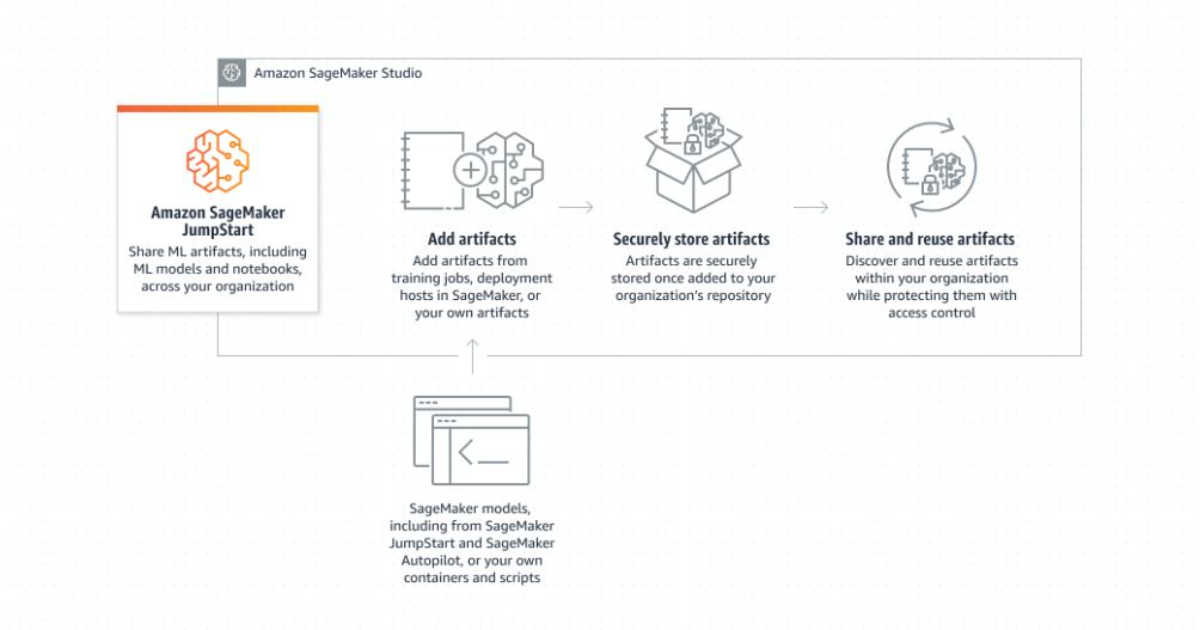
AWS announced that it is now easier to share machine learning artifacts like models and notebooks with other users using SageMaker JumpStart. Amazon SageMaker JumpStart is a machine learning hub that helps users accelerate their journey into the world of machine learning. It provides access to built-in algorithms and pre-trained models from popular model hubs, as well as pre-trained foundation models for tasks such as article summarization and image generation.

SageMaker JumpStart offers end-to-end solutions to solve common use cases in machine learning. One of the key features is the ability to share machine learning artifacts, such as models and notebooks, with other users within the same AWS account. This makes it easy for data scientists and other team members to collaborate and increase productivity, as well as for operations teams to put models into production.

A variety of built-in algorithms from model hubs like TensorFlow Hub, PyTorch Hub, HuggingFace, and MxNet GluonCV are available with SageMaker JumpStart. These algorithms address a range of machine learning applications, such as sentiment analysis and picture, text, and tabular data classification, and may be accessible using the SageMaker Python SDK.

To share machine learning artifacts using SageMaker JumpStart, users can simply go to the Models tab in SageMaker Studio and select the “Shared models” and “Shared by my organization” options. This allows users to discover and search for machine learning artifacts that have been shared within their AWS account by other users. Additionally, users can add and share their own models and notebooks that have been developed using SageMaker or other tools.

SageMaker JumpStart also provides access to large-scale machine learning models with billions of parameters, which can be used for tasks like article summarization and generating text, images, or videos. These pre-trained foundation models can help reduce training and infrastructure costs, as well as allowing for customization for a specific use case.

By sharing machine learning models and notebooks, users can centralize model artifacts, make them more discoverable, and increase the reuse of models within an organization. Sharing models and notebooks can help to streamline collaboration and improve the efficiency of machine learning workflows.

About the Author

Subscribe for MMS Newsletter

By signing up, you will receive updates about our latest information.

  • This field is for validation purposes and should be left unchanged.


Vercel Launches Edge Functions to Provide Compute at the Edge

MMS Founder
MMS Steef-Jan Wiggers

Article originally posted on InfoQ. Visit InfoQ

Recently, Vercel announced the general availability of Edge Functions, which are either JavaScript, TypeScript, or WebAssembly functions. According to the company, these functions are generally both less expensive and faster than traditional Serverless Functions.

Earlier, the company released Edge Functions as a public beta and improved performance by placing deployed functions into a specific region. In addition, it added other features such as support for WebAssembly and cache-control standard for function responses and the ability to express region preference.

By default, Edge Functions run in the region closest to the request for the lowest latency possible. In addition, these functions run after the cache and, therefore, can both cache and return responses. Next.js and many other frameworks like Nuxt, Astro, and SvelteKit natively support Edge Functions. Yet, developers can also create a standalone function using the Vercel CLI.


Source: https://vercel.com/docs/concepts/functions/edge-functions#how-edge-functions-work

Under the hood, Edge Functions use Vercel’s Edge Runtime, built upon the V8 engine used by the Chrome browser, and doesn’t run within a MicroVM. The benefit of the V8 engine is that Edge Functions run in an isolated environment and do not require a VM or container. It limits the runtime yet keeps it lightweight and requires fewer resources than a Vercel Serverless Function, effectively eliminating cold boot times and making them more cost-effective.

In the future, the company will continue to improve its compute products, Edge Functions, and Serverless Functions by improving the compatibility between Edge Functions and Serverless Functions. In a blog post, the company stated:

Our goal is for the Edge Runtime to be a proper subset of the Node.js API. We want users to be able to choose their execution environment based on performance and cost characteristics, not the API. 

Malte Ubl, CTO at Vercel, told InfoQ:

With Vercel Edge Functions, we’re enabling the seamless deployment of functions around the globe. Our latest offering will create unprecedented improvements in building performant web experiences at the edge, which is critical to end-users no matter their geography or device.

The Edge Functions offering from Vercel will compete with others like Cloudflare Workers, which feature 0 ms initialization time (i.e., no “cold starts”) and run at the edge (i.e., in a data center close to the users).

Ethan Arrowood, a senior software engineer at Vercel, tweeted in response as to whether to choose Cloudflare Workers over Edge Functions:

For me, the biggest value add is that it integrates seamlessly with existing Vercel project deployments.

Lastly, Edge Functions are billed in units of 50 ms CPU time per invocation, called execution units. Developers interested in trying out Edge Function can have 500,000 units per month through the hobby plan. In comparison, pro and enterprise teams have 1 million monthly Edge Function execution units included for free and can add on additional usage.

About the Author

Subscribe for MMS Newsletter

By signing up, you will receive updates about our latest information.

  • This field is for validation purposes and should be left unchanged.


Java News Roundup: GlassFish 7.0, Payara Platform, Apache NetBeans 16

MMS Founder
MMS Michael Redlich

Article originally posted on InfoQ. Visit InfoQ

This week’s Java roundup for December 12th, 2022 features news from OpenJDK, JDK 20, JDK 21, GlassFish 7.0, Spring Framework 6.0.3, Spring Cloud Data Flow 2.10 Spring for Apache Pulsar 0.1, Payara Platform, Quarkus 2.15, WildFly 27.0.1, Helidon 2.5.5, Piranha Cloud 22.12, NetBeans 16, Apache Camel, 3.14.7, JobRunr 5.3.2, JDKMon 17.0.43, Reactor 2022.0.1, JHipster Lite 0.24 and Ktor 2023 roadmap.

OpenJDK

Doug Simon, research director at Oracle has proposed the creation of a new project, named Galahan, with a primary goal to contribute Java-related GraalVM technologies to the OpenJDK Community and prepare them for possible incubation in a JDK main-line release. More details may be found in this more detailed InfoQ news story.

JDK 20

Build 28 of the JDK 20 early-access builds was made available this past week, featuring updates from Build 26 that include fixes to various issues. Further details on this build may be found in the release notes.

JDK 21

Build 2 of the JDK 21 early-access builds was also made available this past week featuring updates from Build 1 that include fixes to various issues. More details on this build may be found in the release updates.

For JDK 20 and JDK 21, developers are encouraged to report bugs via the Java Bug Database.

GlassFish

The Eclipse Foundation has released GlassFish 7.0 delivering support for the MicroProfile Config, MicroProfile JWT Propagation and Jakarta MVC 2.0 specifications. Other new features include: implementation of new Jakarta Authentication methods; update the Jakarta Standard Tag Library API and corresponding implementation to version 3.0; an update to the JSON components; and allow for tuning of the interval for monitoring concurrent tasks. GlassFish 7.0 is a compatible implementation of Jakarta EE 10 that requires JDK 11 as a minimal version, but also works on JDK 17.

Spring Framework

Spring Framework 6.0.3 has been released delivering bug fixes, improvements in documentation and new features such as: additional constructors in the MockClientHttpRequest and MockClientHttpResponse classes to align the mocks with the test fixtures; improve options to expose formatted errors in the MessageSource interface for a ProblemDetail response; and optimize object creation in the handleNoMatch() method defined in the RequestMappingHandlerMapping class. Further details on this release may be found in the release notes.

Spring Cloud Data Flow 2.10.0 has been released featuring dependency upgrades to Spring Boot 2.7.6, Spring Framework 5.3.24, Spring Cloud 2021.0.5 and Spring Shell 2.1.4. Also included in this release are scripts for: creating containers when running on an ARM platform; and the ability to launch a local Kuberenetes cluster and install Spring Cloud Data Flow with MariaDB and RabbitMQ or Kafka. More details on this release may be found in the release notes.

The first minor release of Spring for Apache Pulsar 0.1.0 features support for Reactive and GraalVM Native Image. Further details on this release may be found in the release notes.

Payara

Payara has released their December 2022 edition of the Payara Platform that includes Community Edition 6.2022.2, Community Edition 5.2022.5 and Enterprise Edition 5.46.0.

Payara 6 Community Edition provides bug fixes, security fixes, improvements and component upgrades such as: Jackson 2.13.4, Eclipse Payara Transformer 0.2.9, Felix Web Console 4.8.4 and OSGi Util Function 1.2.0. More details on this release may be found in the release notes.

Payara 5 Community Edition, the final release in the Payara 5 release train, provides bug fixes, security fixes, improvements and component upgrades such as: EclipseLink 2.7.11, MicroProfile JWT Propagation 1.2.2, Yasson 1.0.11 and JBoss Logging 3.4.3.Final. Further details on this release may be found in the release notes.

Payara 6 Edition provides bug fixes, security fixes and component upgrades such as: MicroProfile Config 2.0.1, MicroProfile Metrics 3.0.1, Hibernate Validator 6.2.5.Final and Weld 3.1.9.Final. More details on this release may be found in the release notes.

For all three editions, the security fixes are: an upgrade to Apache Commons Byte Code Engineering Library (BCEL) 6.6.1 that addresses CVE-2022-42920, Apache Commons BCEL Vulnerable to Out-of-Bounds Write, a vulnerability in which changing specific class characteristics may provide an attacker more control over the resulting bytecode than otherwise expected; and authorization constraints that were ignored when using a ./ path traversal after the Java Authorization Contract for Containers (JACC) authentication check had already occurred.

Quarkus

Red Hat has released Quarkus 2.15.0.Final that ships new features such as: support for AWS Lambda SnapStart; move gRPC extension to a new Vert.x gRPC implementation; support for Apollo Federation in SmallRye GraphQL; support for continuous testing in the CLI test command; add @ClientQueryParam annotation to Reactive REST Client; and use of the -XX:ArchiveClassesAtExit command line argument that simplifies the process of generating the AppCDS creation in JDK 17+. Further details on this release may be found in the changelog.

WildFly

Red Hat has also released Wildfly 27.0.1 featuring bug fixes and component upgrades such as: WildFly Core 19.0.1.Final, Bootable JAR 8.1.0.Final and RESTEasy Spring 3.0.0.Final. There were also upgrades to: Woodstox 6.4.0 that resolves CVE-2022-40152, a vulnerability in which a Denial of Service (DoS) attack is possible from parsing XML data if DTD is enabled; and Apache CXF 3.5.2-jbossorg-4 that resolves CVE-2022-46364, a vulnerability in which a Server-Side Request Forgery (SSRF) attack is possible from parsing the href attribute of XOP:Include in Message Transmission Optimization Mechanism (MTOM) requests.

New WildFly Source to Image (S2I) and runtime multi-arch images, designed for linux/arm64 and linux/amd64, were given a different naming convention that the regular WildFly images for improved handling of multiple versions of the JDK and to better align with tags used in the centos7 Docker images built on Eclipse Temurin. The new image names are:

  • quay.io/wildfly/wildfly-runtime: (runtime image)
  • quay.io/wildfly/wildfly-s2i: (S2I builder image)

It is important to note that the previous WildFly images are now deprecated and will no longer be updated.

Helidon

Oracle has released Helidon 2.5.5 that ships with bug fixes and improvements such as: media support methods with Supplier variants in the WebServer.Builder class; additional strategies defined in the @Retry annotation; use Hamcrest assertions instead of JUnit in the Config component; and provide support for MicroProfile Config in the application.yaml file.

Piranha

Piranha 22.12.0 has been released. Dubbed the “Welcome Spring Boot” edition for December 2022, this new release includes: add setting of HTTP server implementation, and port and contextPath variables for Spring Boot starter; and TCK fixes by upgrading to Jakarta Servlet 6.0.1. More details on this release may be found in their documentation and issue tracker.

Apache Software Foundation

The release of Apache NetBeans 16 delivers many improvements that support Gradle, Maven, Java, Groovy and C++, VS Code Extension and Language Server Protocol. Other new features in the editor and user interface include: fixes for when IllegalArgumentException and NullPointerException are thrown; improvements in support for YAML, Docker, TOML and ANTLR; and the ability to load custom FlatLaf properties from user configuration. Further details on this release may be found in the release notes.

Apache Camel 3.14.7 has been released featuring bug fixes and improvements to the camel-hdfs, camel-report-maven-plugin, camel-sql and camel-ldap modules. More details on this release may be found in the release notes.

The Apache Software Foundation has announced the end of life for Apache Tomcat 8.5.x scheduled for March 31, 2024. This means that after that date: releases from the 8.5 branch are highly unlikely; bugs affecting only the 8.5 branch will not be addressed; and security vulnerability reports will not be checked against the 8.5 branch. Then, after June 30, 2024: the 8.5 download pages will be removed; the latest 8.5 release will be removed from the CDN; the 8.5 branch will be made read-only; links to the 8.5 documentation will be removed from the Apache Tomcat website; and the bugzilla project for 8.5 will be made read-only.

JobRunr

JobRunr 5.3.2 has been released featuring: better handling of deadlocks in MySQL and MariaDB; a bug fix with serialization when using JSONB; and a bug fix when JobRunr is used in a shared cloud environment (e.g., Amazon ECS) and the JVM halts completely due to shifting the CPU to other processes.

JDKMon

Version 17.0.43 of JDKMon, a tool that monitors and updates installed JDKs, has been made available this past week. Created by Gerrit Grunwald, principal engineer at Azul, this new version ships with an updated scanning for vulnerabilities of GraalVM and JavaSE.

Project Reactor

The first maintenance release of Project Reactor 2022.0.1 provides dependency upgrades to reactor-core 3.5.1, reactor-netty 1.1.1, reactor-kafka 1.3.15 and reactor-kotlin-extensions 1.2.1.

JHipster

JHipster Lite 0.24.0 has been released featuring: bean validation error handler in Spring Boot; a Java module to add the Enums class in applications; and add JHipster Lite error messages.

JetBrains

JetBrains has published a 2023 roadmap for Ktor, the asynchronous framework for creating microservices and web applications. Developers can expect: a version 3.0; a new simplified routing API; a migration to Tomcat 11, Jetty 11 and an upgrade to Apache HttpClient 5; and an extraction of the IO functionality into a separate library.

About the Author

Subscribe for MMS Newsletter

By signing up, you will receive updates about our latest information.

  • This field is for validation purposes and should be left unchanged.


AWS Key Management Service Now Supports External Key Stores

MMS Founder
MMS Steef-Jan Wiggers

Article originally posted on InfoQ. Visit InfoQ

AWS recently announced the availability of AWS Key Management Service (AWS KMS) External Key Store (XKS), allowing organizations to store and manage their encryption keys outside the AWS KMS service.

AWS Key Management Service (KMS) is an Amazon Web Services (AWS) managed service. It allows organizations to easily create, manage and control the encryption keys to encrypt their data. The service now supports an external key store, which can be a third-party service or application that can be used to store and manage encryption keys.

When organizations configure AWS KMS External Key Store, they replace the KMS key hierarchy with a new external root of trust. The root keys are now all generated and stored inside an HSM they provide and operate – when AWS KMS needs to encrypt or decrypt a data key; it forwards the request to their vendor-specific HSM.

Sébastien Stormacq, a principal developer advocate at AWS, explains in an AWS News blog post:

All AWS KMS interactions with the external HSM are mediated by an external key store proxy (XKS proxy), a proxy that you provide and manage. The proxy translates generic AWS KMS requests into a format that the vendor-specific HSMs can understand. The HSMs that XKS communicates with is not located in AWS data centers.


Source: https://aws.amazon.com/blogs/aws/announcing-aws-kms-external-key-store-xks/

To provide customers with a broad range of external key manager options, the AWS KMS Team developed the XKS specification with feedback from several HSM, key management, and integration service providers, including Thales, Entrust, Salesforce, T-Systems, Atos, Fortanix, and HashiCorp. 

James Bayer, EVP of R&D at HashiCorp, tweeted:

AWS announced AWS KMS External Key Store. Now store your KMS root key outside of AWS infrastructure and @HashiCorp. Vault is a launch partner. Important for anyone worried about regulatory compliance and controls related to their encryption keys.

In addition, Faiyaz Shahpurwala, chief product and strategy officer at Fortanix, said in a press release:

We’re thrilled to work with AWS as they launch AWS KMS External Key Store to global enterprise customers that are subject to regulatory and compliance requirements. We believe this will give customers more choice and control over their key management lifecycle while leveraging the best-in-class benefits provided by AWS.

Lastly, pricing-wise, AWS KMS charges $1 per root key per month, no matter where the key material is stored, on KMS, on CloudHSM, or the organization’s own on-premises HSM. Furthermore, additional details about the external key store are available in the FAQs.

About the Author

Subscribe for MMS Newsletter

By signing up, you will receive updates about our latest information.

  • This field is for validation purposes and should be left unchanged.


NVIDIA Kubernetes Device Plug-in Brings Temporal GPU Concurrency

MMS Founder
MMS Sabri Bolkar

Article originally posted on InfoQ. Visit InfoQ

Starting from the v0.12 release, the NVIDIA device plug-in framework started supporting time-sliced GPU sharing between CUDA workloads for containers on Kubernetes. This feature aims to prevent under-utilization of GPU units and make it easier to scale applications by leveraging time-multiplexed CUDA contexts. Before the official release, a fork of the plug-in was enabling such temporal concurrency.

NVIDIA GPUs automatically serialize compute kernels (i.e. functions executed on the device) submitted by multiple CUDA contexts. CUDA stream API can be used as a concurrent abstraction, however, streams are only available within a single process. Therefore directly executing parallel jobs from multiple processes (e.g. multiple replicas of a server application) always results in insufficient consumption of GPU resources.

Within GPU workstations, CUDA API supports four types of concurrency for multi-process GPU workloads: CUDA Multi-Process Service (MPS), Multi-instance GPU (MIG), vGPU, and time-slicing. On Kubernetes, oversubscription of NVIDIA GPU devices is disallowed as scheduling API advertises them as discrete integer resources. This creates a scaling bottleneck for HPC and ML architectures especially when multiple CUDA contexts (i.e. multiple applications) are not able to share existing GPUs optimally. Although it is possible to allow any pod to use k8s GPUs by setting NVIDIA_VISIBLE_DEVICES environment variable to “all”, this configuration is not administered by the CUDA handlers and may cause unexpected results for the Ops teams.

As Kubernetes is becoming the de facto platform for scaling services, NVIDIA also started to incorporate the native concurrency mechanisms into the clusters via the device plug-in. For Ampere and later GPU models (e.g. A100), multi-instance GPU concurrency is already supported by the K8s device plug-in. The newest addition to the list comes with temporal concurrency via the time-slicing API. On the other hand, for Volta and later GPU architectures, MPS support is not yet developed by the plug-in team.

In effect, serialized execution of different CUDA contexts is temporally concurrent as they can be managed at the same time. Therefore, one may wonder why time-slicing API should be preferred. Launched independently from different host processes (CPU), scheduling of contexts is not computationally cheap. Also declaring the number of expected CUDA executions in advance may allow possible higher-level optimizations.

The time-slicing API is especially useful for ML-serving applications as companies exploit cost-effective lower-end GPUs for inference workloads. MPS and MIG are only available for GPUs starting from Volta and Ampere architectures respectively, hence common inference GPUs such as NVIDIA T4 cannot be used with MIG on Kubernetes. Time-slicing API will be critical for future libraries aiming to optimize accelerator usage.

Temporal concurrency can be easily enabled by adding an extra configuration to the manifest YAML file. For example, the below setting will increase the virtual time-shared device count by a factor of 5 (e.g. for 4 GPU devices, 20 will be available for sharing on Kubernetes):

version: v1
sharing:
  timeSlicing:
	resources:
	- name: nvidia.com/gpu
  	replicas: 5

AMD maintains a separate k8s device plug-in repository for its ROCm APIs. For instance, the ROCm OpenCL API allows hardware queues for the concurrent execution of kernels within the GPU workstation, but similar limitations exist on K8s as well. In the future, we may expect standardization attempts for the GPU-sharing mechanisms on the Kubernetes platform regardless of the vendor type.

More information about the concurrency mechanisms can be obtained from the official documentation, and a detailed overview of the time-slicing API can be reached from the plug-in documentation. An alternative MPS-based k8s vGPU implementation from AWS for Volta and Ampere architectures can also be seen in the official repository.

About the Author

Subscribe for MMS Newsletter

By signing up, you will receive updates about our latest information.

  • This field is for validation purposes and should be left unchanged.


OpenJDK Proposes Project Galahad to Merge GraalVM Native Compilation

MMS Founder
MMS Ben Evans

Article originally posted on InfoQ. Visit InfoQ

The OpenJDK project has proposed a new Project – codenamed Galahad – to merge some parts of the GraalVM Community Edition codebase into OpenJDK.

This is the latest development in a long-running effort to provide a capability to compile Java applications to machine code before program execution. On the face of it, this seems somewhat strange – after all, one of the first things that a new Java developer learns is that “Java doesn’t compile to machine code, but instead to JVM bytecode”.

This simple maxim has deeply far-reaching implications, the most basic of which is that the Java platform relies upon a powerful dynamic runtime – the JVM – for execution. This runtime enables dynamic runtime techniques, such as classloading and reflection, that do not really have analogues in ahead-of-time (AOT) compiled languages. In fact, this is the jumping-off point for so much that is powerful about Java – and what made it so groundbreaking when it arrived on the software scene, 25 or so years ago.

Despite this, there has always been interest in the possibility that Java programs could be directly compiled to machine code and execute standalone without a JVM. There are a few different reasons for this desire – whether it’s to reduce the warmup time for Java applications to reach peak performance, to reduce the memory requirements of Java apps, or even just a general desire to avoid using resources for runtime subsystems that an application may not need.

There have been several projects that attempted to realise this possibility. The most recent, and arguably the most successful to date, is the GraalVM project. This project emerged not from OpenJDK but instead from a research propject at Oracle Labs. The first production-grade release, GraalVM 19.0, arrived in May 2019.

Since then it has run as an independent project with a different release cycle and limited interaction with OpenJDK. Two of the few Java Enhancement Proposals (JEPs) that relate to GraalVM are:

Both of these JEPs arrived in Java 9 and, together, they introduced the Graal compiler into the OpenJDK codebase.

The Graal compiler is one of the primary components of GraalVM – it is a compiler that operates on Java bytecode and produces machine code. It can operate in either JIT or AOT mode.
In the former, it can be used in place of C2 (sometimes referred to as the “server compiler”). It is important to note that Graal is itself written in Java – unlike the other JIT compilers available to the JVM which are written in C++.

Graal was made available as an experimental Java-based JIT compiler in Java 10, as JEP 317. However, in Java 17 (released in September 2021), the experimental forms of both the AOT and JIT compilers were removed. Despite this, the experimental Java-level JVM compiler interface (JVMCI) was retained – so that it remains possible to use externally-built versions of the Graal compiler for JIT compilation.

The latest announcement will, if delivered as expected, mark the return of Graal to the OpenJDK codebase. However, what is perhaps more significant is the GraalVM process and project changes. Galahad will be run as an OpenJDK subproject and maintain a separate repo that periodically rebases on the mainline repo. When features are ready, they will then be migrated to the mainline repo. This is the same model that has been successfully used by long-running projects such as Loom and Lambda.

Galahad is targeting JDK 20 as the initial baseline. This is essentially a code and technical starting point, as JDK 20 has already entered Rampdown – so there is no possibility of any reintroduced Graal code shipping as part of Java until at least JDK 21 (expected September 2023). For now, Galahad will focus on contributing the latest version of the GraalVM JIT compiler and integrating it as an alternative to C2. Later, some necessary AOT compilation technology will be added in order to make the Graal JIT compiler available instantly on JVM start.

This is necessary because, as Graal is written in Java, it could suffer from a slow-start problem broadly similar to this:

  • Hotspot starts with the C1 compiler & Graal available
  • Graal is executed on Java interpreter threads and is initially slow until it compiles itself

Pre-compiling the Graal compiler to native code would be one possibility to solve this – an old Draft JEP points the way to this, but it is unknown at this time whether it will be revived or a new effort started.

It should be noted that not all of the GraalVM codebase will be committed – only the core JIT and AOT components, as well as the Native Image tooling. Oracle’s proprietary features present in GraalVM Enterprise Edititon are not expected to be donated to the project.

Galahad is starting with an impressive list of committers – not only from Oracle’s OpenJDK & GraalVM teams, but also many contributers from the wider OpenJDK community including Andrew Dinn and Dan Heidinga from Red Hat and Roman Kennke from AWS. The precise relationship between Galahad and Project Leyden (another OpenJDK project looking at AOT compilation and related technologies) is yet to become clear, but several of the listed contributors to Galahad have also been active in Leyden.

Despite it still being very early days for the project, many influential community members have welcomed Galahad as representing another important step forward in the quest to keep Java at the forefront of Cloud Native technology stacks.

About the Author

Subscribe for MMS Newsletter

By signing up, you will receive updates about our latest information.

  • This field is for validation purposes and should be left unchanged.


Spring Batch 5.0 Delivers JDK 17 Baseline and Support for Native Java

MMS Founder
MMS Shaaf Syed

Article originally posted on InfoQ. Visit InfoQ

VMware has released Spring Batch 5.0. Baselined to Java 17 and the latest Spring Framework 6.0, Spring Batch now supports GraalVM native image, a new Observation API, Java Records, and a long list of enhancements and fixes made by more than 50 contributors.

Spring Batch 5 depends on Spring Framework 6, Spring Integration 6, Spring Data 3, Spring AMQP 3, and Micrometer 1.10. Furthermore, import statements require a migration from the javax.* to jakarta.* namespaces for all usage of the Jakarta EE APIs since this version marks the migration to Jakarta EE 9. Spring Batch now also uses Hibernate 6 for cursor and paging item readers.

Spring Batch 5 introduces a new class, DefaultBatchConfiguration, as an alternative to the @EnableBatchProcessing annotation. It provides all infrastructure beans with default configuration, which users can customize. Users can now specify a transaction manager and can customize its transaction attributes using the JobExplorer interface. The latest release also provides enhancements to better leverage the Record API in the framework, as support for the Record API was first introduced in Spring Batch 4. Spring Batch also extends support for SAP HANA and full support for MariaDB.

The @EnableBatchProcessing annotation no longer exposes a transaction manager bean in the application context. This is good news for user-defined transaction managers as it avoids unconditional behavior as in previous versions. Users must manually configure the transaction manager on any tasklet step definition to avoid inconsistency between XML and Java configuration styles. The @EnableBatchProcessing annotation also configures a JDBC-based JobRepository interface. VMware recommends using embedded databases to work with in-memory job repositories.

Micrometer upgrades to version 1.10, allowing users to get Batch tracing and Batch metrics. Spring Batch now also creates a span for each job and step. The data is viewable in distributed tracing tools like Zipkin.

Another refreshing change is handling job parameters using the JobParameter class. This way, users are no longer restricted to the long, double, string, or date types as they were in version 4. This change has an impact on how parameters persist in the database.

Spring Batch 5 also removes support for SQLFire, JSR-352 (Batch Applications for the Java Platform), and GemFire.

About the Author

Subscribe for MMS Newsletter

By signing up, you will receive updates about our latest information.

  • This field is for validation purposes and should be left unchanged.


Podcast: Stop Having Meetings that Suck – Patricia Kong on Why Facilitation Should be a Core Competency

MMS Founder
MMS Patricia Kong

Article originally posted on InfoQ. Visit InfoQ

Subscribe on:


Transcript

Shane Hastie: Good day, folks. This is Shane Hastie for the InfoQ Engineering Culture podcast. Today, I’m sitting down with Patricia Kong. Patricia is the Product Owner for Enterprise Solutions and Learning Enablement at Scrum.org and has been a guest on the podcast before. Patricia, welcome. Thanks for taking the time to talk to us today.

Patricia Kong: Thanks for having me back, Shane.

Shane Hastie: As I said, you’ve been on the podcast before, but there’s a likelihood that some of our listeners haven’t heard that previous episode. Probably good starting point, give us a bit of background. Who’s Patricia?

Introductions [01:09]

Patricia Kong: Patricia Kong, which is me, is based in Boston in the United States. I’ve been a part of Scrum.org, which is the company of Ken Schwaber who co-created the Scrum framework. We’ve been together now for about 11 years, and prior to that, I actually come from a finance background, organizational behavior, and then basically moved from large companies into smaller companies, and I have all those scars. And so that’s why I’ve found this lovely home at Scrum.org, and a lot of what I’ve been focused on is thinking about the good things that we see at the teams. How do we help enterprises in terms of enterprise agility? And so this framework that I was talking about last time we were together is called evidence-based management, and the focus of that is really thinking about, “What evidence do you have or do we use to know that we’re doing well and how to progress toward our goals?”

Evidence based Management [02:07]

And so the focus really around that is around empiricism, and I think that that is actually, more than ever, so important when everybody is producing their own opinion of what is fact now. And so evidence-based management, especially when we get into things like Agile, is Agile working well for you, and how do we know if that’s the right direction that we should be moving in rather than just having the loudest person in the room saying what’s important. So that’s what I’ve been focused on for a while, and now here, what we’re going to talk today, is a little bit different in terms of why I’m thinking about individuals and how does that come into play with something like learning enablement.

Shane Hastie: Let’s explore first, isn’t Scrum old hat now? Aren’t we past Scrum? Isn’t there something post scrum that we’re all doing now?

The biggest threat to Scrum is Scrum itself [02:57]

Patricia Kong: Yeah, I think we’re all doing ScrumAnd or ScrumBut. So that’s a really good question, and I’ve always thought that the biggest threat to Scrum is Scrum itself. And for me, I think some of us may have found ways of working that are really great, and I think that a lot of us are still trying to get those things right. And for me, what that settles back into is not so much the dogma of the Scrum framework, which I can be dogmatic about, but the principles and the mindset that those things are really resting on. So I would say that I would not be one who would shy away from saying, “I think there’s too much overhead for us to use Scrum right now. This isn’t complex. We need to focus on the value of the company, and especially with those organizational alignment problems, let’s think about what’s most important to achieve our goals.” So if we can think about Scrum in those ways, I think that that might be interesting, but that means that you have to understand Scrum first.

Shane Hastie: “Easy to describe, but hard to master,” is how it’s often spoken about. That mastery is helping teams be effective, and you are working a lot in facilitation. Why should we care about facilitation?

Facilitation as a key skill [04:11]

Patricia Kong: It’s a good question. So when I was thinking about the enterprise and we’re trying to turn the Titanic. Literally, you’re not trying to do it that way. Don’t turn the Titanic if you’re trying to do business agility, but when you think about the company, those four walls will stay the same forever. So when we start to look at the teams, because if we believe that it’s the teams that create value, what can we do to help these individuals? I think if we say, “Hey, it’s a small self-organized team and they should be able to do all these different things and have these conversations by themselves,” let’s just leave it at that. What we’re really seeing in the market, and especially the need, is that people are looking to develop more skills that can make them more effective and that they can use to advance themselves in their careers, and that might be something like coaching, it might be something like facilitation.

But the reason that I’ve honed down on facilitation as a test of, “How can we help people develop their skills and really help them be more effective in their own lives?” is because I think a lot of times, and I don’t know what you’re seeing, Shane, is that there might be this conflict that exists in a team or in a group. And everybody goes, “Oh, there’s a big conflict problem. Oh, there’s a big conflict problem. There’s so much tension,” and a lot of times that can be solved with just a little bit of better facilitation, a little bit better focus on outcomes of what we’re trying to do together. Two other reasons, and then I’m focused on facilitation, is because one, there is this, I think, misunderstanding of stances.

So a lot of times people jump into a coaching stance. Everything needs a coaching stance, and coaching is really important and it should be applied correctly. Sometimes it’s not always the most effective thing to do for a team is not first jump into coaching. And the second reason is because I think there are a lot of great facilitation techniques that exist in the market becoming really popular, visual facilitation, liberating structures, all these different things, and I think they’re being used poorly. So what happens is that a lot of people come and they over facilitate and you border from having liberating structures to irritating structures because they’re just used so haphazardly, and so I want to help people be more effective with that and get the goodness that they’re trying to get.

Shane Hastie: For those that haven’t experienced a lot of good facilitation, what’s the difference between running a meeting and facilitating a meeting?

The difference between running a meeting and facilitating collaboration [06:36]

Patricia Kong: I think for effective facilitation, it’s easy. Let’s talk about something that’s a bad facilitation is, I think, many of us have gone to a meeting and don’t know why we’re there or that meeting lasts too long or that we are maybe in a retrospective and we agree on all these things that are important to work on. And then the things we decide, “Okay, these are the things that we need to improve,” and somebody else decides for us or worse, we just don’t care.

And so when you’re looking at effective facilitation, there’s something that’s really powerful that can happen when done correctly because what you’re trying to do is not only make sure that there’s purpose, it’s effective, but you are trying to let healthy conflict, diverse perspectives exist so that when you go through that, whether it, again, be it the retrospective or maybe it’s something around refinement planning, what we’re actually going to do, what our goals are, when we come to the decision of, “These are the things we’re going to pursue or this is the thing that we’re going to pursue,” that everybody has a shared understanding that that is the thing, and we all agree with it on why it is the thing.

And a lot of times that’s lost. And I think the other thing is just in terms of engagement, and I don’t mean a dog and pony show, but I do mean asking relevant questions, focusing on it. So for instance, in Scrum, when we have those events around planning or when you’re reviewing something or you’re planning something or we’re talking about how to improve, that is money on the table and those are timeboxed and they should be run effectively so that we can really progress.

Shane Hastie: Why is it so hard?

Patricia Kong: Effective facilitation?

Shane Hastie: Mm.

Why is effective facilitation so hard? [08:11]

Patricia Kong: Because of people. There’s something interesting I was reading is that during meetings, I actually have a blog about this, but during meetings, and especially I think in the remote world right now that we’re doing Zoom and all these things, is that 90% of people during are in meetings are daydreaming, and 73% of people are usually doing other work. It is really hard to maintain people’s focus, and I think the other thing is that a lot of people who are leading facilitation and leading events, they think that they’re doing it really well and, “We’ve read this thing,” “We’re trying that,” and it’s not, and so we have this effect.

Actually, here’s an interesting fact is that managers and executives, they think they’re doing a great job when they’re facilitating and leading an event, and that’s usually because they’re the ones that are just talking. Those kind of things can lead to really frustrating meetings. And so for us, and for me specifically, what’s important about facilitation is not just acquiring a bunch of techniques, but having some rigor around what we have as principles that really correlate with the Scrum values, but, “What are we trying to do?” And, “What are we trying to achieve?” Then reach into, “What is that technique that we need here?” Otherwise it’s like, “Oh, that was fun. Now what?” That’s the feeling that a lot of teams have often.

Shane Hastie: You touched there on remote and there are challenges today with, “Should we be remote?”, “Should we be in person?”, “What does this hybrid look like?” How does facilitation change when we are shifting through these various modes?

Facilitation is different when the participants are remote or hybrid [09:49]

Patricia Kong: I think it becomes even more important and to having an agreement of how we’re going to work together and what we’re working on, and so the purpose and the process of this becomes really important. The other balance of that is the openness and the health that we have in that environment. So people talk about, “Let’s all be remote,” or, “Let’s all be together,” and that creates a safer environment because you’re not worried about what’s going on and what opportunity you’re missing or not. If we’re on remote and we’re doing Zoom, maybe everybody’s back-channeling and you just agree with that thing. That doesn’t happen when you’re all in person. So there’s all these different experiences that you know the foundation for, and it’s really hard.

Something about hybrid has existed, and we’ve talked about this, all the time because teams are not all located in the same place, so you have to have that. But it’s something that I think that people have to really understand, an agreement of what that purpose is for. And I’ve seen a lot of companies recently, because we’re going through the pandemic saying, “We want people back,” and they’re saying, “Let’s get the kegs in. Let’s do this. Two days, whichever you want,” and what they see is they see a loss of talent. They see people moving into other places of working because they said, “We’ve proven that we can get stuff done. We can get good stuff done, so why are you trying to change this?” And those are the questions that management has to be prepared to answer.

Shane Hastie: When should we be in person?

Bring people together for events where they get value from the in-person interaction [11:21]

Patricia Kong: I think we should be in person for birthday parties and celebrations. What’s beneficial to me, and this is my opinion, is when we’re brainstorming, generating ideas, putting things together, and maybe when we’re trying to have conversations to retrospect on some things. That being said, I’ve done both of those things over the past two, three years now like this, just over my little laptop and it’s been okay. But for me, I really think that those deep conversations, trying to get to know people, those same interactions that I would value in person, are good. I think people who are thinking about those circumstances need to understand the different one, personality traits and preferences that people have, and also some mental health things.

I think during the past couple of years, I saw some people really get depressed because they could not do it. They could not look at a screen and talk more than a few minutes. Their attention’s elsewhere, and they needed to meet outside, their colleagues, in a park and all those things and able to feel a little bit better. So I think being aware of those things also. It might not be, “Here’s a purpose of, ‘We’re trying to plan, do this really creative thing and we’re going to do design thinking and all these things.'” It might just be like, “Hey, who wants to meet up?” and just see if that’s something that people raise their hand for to create a little bit more of morale.

Shane Hastie: Thinking of our audience, technical influencers, technical leaders in technical teams, these are probably not skills that they’ve inherently been developed or been trained in. How do we help?

Everyone on a team should build facilitation skills [12:57]

Patricia Kong: I think that we should remove the facade that these type of skills like facilitation or this interest in coaching or any of these different types of skills that can really help us develop people and teams should be left to, let’s say, Scrum Masters, Agile coaches, management leader, anything like that. I think that people who are in teams doing the work are great people to lead and facilitate conversations and have really great ideas about direction and strong planning that they can use to drive, I don’t want to even say drive, to guide conversations within their teams.

So particularly in a Scrum team, if we’re looking at the sprint review, I don’t think that it’s the product owner that has to lead the sprint review, and I don’t think that they should be doing it every time. I think that yes, the scrum master could do it, but a developer could also do it too to really pull out the different opinions and to structure a conversation about, “What’s the best value we can deliver?” I think deciding the environment and setting up the space of how a team wants to exist is something that the teams should be thinking about, and it doesn’t have to come from left field, right field, above. It can be really be held there so that we can not only focus on our outcomes that we’re trying to get toward, but also just stop having meetings that suck.

Shane Hastie: Stop having meetings that suck.

Stop having meetings that suck [14:25]

Patricia Kong: And I’ll add to that because you’re thinking about our audience are really strong willed people that are very smart. We have a fun icebreaker once? Okay. We have a fun icebreaker twice and we do these things. Okay. Third time, we’re not showing up. We’re disengaged. We don’t understand the purpose of it. We don’t know why we’re doing these things. So having a little experience on this can help that experience and process. But also just being able to facilitate conversations when things get tough. So for instance, when we have refinement and we’ve agreed to these things and we think there’s a sprint goal, and we come to planning, that is no longer the case. Everybody wants to work on things that are really far down the backlog. How do we facilitate that conversation? It could be great for a developer to chime in.

Shane Hastie: You have carefully not mentioned so far that scrum.org has a new training class around facilitation. So let’s do that, give you the opportunity to talk about that.

Scrum.org facilitation training [15:19]

Patricia Kong: Okay. So everything I’ve said up to this point is why we have this class and what we’re thinking about in terms of, “What skills can we develop to encourage and enable ourselves as teams?”, “What mindsets we need to adapt?” So facilitation, it’s called the Professional Scrum Facilitation Skills course, and it is a one-day experience. This can be virtual. It’s in person. What I like about it is that it introduces the notion of principles so that really, what you can do in this class is think about how you apply facilitation when you are in, specifically for us, these tough Scrum scenarios. So we walk people through that. We walk through a lot of scenarios that honestly look very familiar probably in our day-to-day lives, and we say, “If you are looking to facilitate this, what would you do?”

We give them the toolbox to do that, and also what we do is we have them think about how this is going to help them immediately the next day. So it’s not just, “Here’s a bunch of techniques. This is really fun. Go through it.” This is, “You are in this circumstance,” just very much like what I said. “What do you do? How does facilitation help you here so that you’re not stuck?” The course does, right now, have an assessment that goes along with it. It’s a shorter assessment and it is closely related to the course at this point. So there’s a certification assessment that goes along with it, but it’s really interesting. It’s an interesting course, and we’re really dipping heavy into the application of skills, and again, for us, it’s in that Scrum team environment.

Shane Hastie: Thank you so much. If people want to continue the conversation, where do they find you?

Patricia Kong: They can find me on the internet. On LinkedIn would be a great place to reach out to me, and I think there’s a lot more information if people want to learn on the scrum.org website around facilitation. We have our Professional Scrum competencies. There’s a bit about facilitation in there. What I’m trying to do is put out as much information as we can for people really to dip their toes and understand what it means to facilitate, “What could you be doing?”, “How to make things better?” And then when we have experienced trainers, people with experience like yourself, like our professional Scrum trainers, when we get into a workshop or a class with them, we are really talking at the professional level. We are really talking about, “How do we manage this?” and we’re thinking about different complex things. So really thinking about how to apply, and so there’s a lot of information that people can learn about and they’ll be seeing different webinars and opportunities to engage with me that way too.

Shane Hastie: Thank you so much.

Patricia Kong: Thank you, Shane.

Mentioned:

About the Author

.
From this page you also have access to our recorded show notes. They all have clickable links that will take you directly to that part of the audio.

Subscribe for MMS Newsletter

By signing up, you will receive updates about our latest information.

  • This field is for validation purposes and should be left unchanged.


Vite 4 Released, Replaces Babel with Faster Rust-Based SWC

MMS Founder
MMS Bruno Couriol

Article originally posted on InfoQ. Visit InfoQ

The team behind the Vite frontend build tool recently released Vite 4.0, 5 months after Vite 3.0. The new version is motivated by the breaking upgrade from Rollup 2.0 to 3.0. Vite 4.0 also adds support for SWC, a Rust-based bundler that claims order-or-magnitude speed improvement over Babel.

Vite 4.0 now uses Rollup 3.0 at build time. Rollup 3.0 was announced a few weeks before at ViteConf 2022. ViteConf 2022 gathered the main participants in the Vite ecosystem. Since Vite 2.0, Vite is a framework-agnostic build tool. As a result, many other developer tools, libraries, and frameworks started supporting Vite — e.g., Storybook, Astro, Nuxt, SvelteKit, Solid Start, Hydrogen, Laravel, Qwik City, and more. The Vite team mentioned:

With the help of our ecosystem partners, [we are] happy to announce the release of Vite 4, powered during build time by Rollup 3. We’ve worked with the ecosystem to ensure a smooth upgrade path for this new major.

While Rollup 3 is mostly compatible with Rollup 2, developers who use custom rollupOptions may encounter issues and should refer to the Rollup migration guide to upgrade their config.

Vite 4.0 also upgrades the versions of dotenv and dotenv-expand (see the dotenv and dotenv-expand changelog). The new version of dotenv carries over breaking changes that will require developers to wrap names that contain certain characters (e.g., backtick) with quotes:

-VITE_APP=ab#cd`ef
+VITE_APP="ab#cd`ef"

The recent release of Next,JS 13 included Turbopack, a new, still-in-alpha, Rust-based replacement to Webpack that claimed to be orders of magnitude faster than Vite. Study of that claim associated most of the speed improvements to the use by Turbopack of SWC, a Rust-based bundler that is still in alpha. SWC claims to be 20x times faster than Babel, which was used in Vite 3.0. Vite 4.0 now adds support for SWC, which should help close the gap. The Vite team explains:

SWC is now a mature replacement for Babel, especially in the context of React projects. SWC’s React Fast Refresh implementation is a lot faster than Babel, and for some projects, it is now a better alternative. From Vite 4, two plugins are available for React projects with different tradeoffs. We believe that both approaches are worth supporting at this point, and we’ll continue to explore improvements to both plugins in the future.

Developers may refer to the migration guide and the release note for the exhaustive list of changes associated with the new version. Vite is distributed under the MIT open-source license. Contributions are welcome and must follow Vite’s contributing guide.

About the Author

Subscribe for MMS Newsletter

By signing up, you will receive updates about our latest information.

  • This field is for validation purposes and should be left unchanged.


Presentation: An Observable Service with No Logs

MMS Founder
MMS Glen Mailer

Article originally posted on InfoQ. Visit InfoQ

Transcript

Mailer: My name is Glen. I work at a little company called Geckoboard. I’m going to be talking about some work that me and my team did at CircleCI. CircleCI is mostly made up of microservices, and they’re written in Clojure. They all share some common tooling using a shared library. That library is maintained by a separate team that tries to help act as an accelerator for all the other teams, and keeps that library up to date. Meanwhile, each CI build that runs on our platform defines its own CI environments. We run the infrastructure, but they get to decide what dependencies and so on are installed on the system. In order to power those builds, we needed to implement a build agent, a bit of code that can run anywhere on those customer defined machines. We implemented that in Go. My team was responsible for this agent written in Go, that build infrastructure that it runs on, and some of the microservices that it communicates with. We decided we needed to build a new service for an upcoming build agent related feature, and we decided that rather than Clojure, we were going to make a bit of a departure. We were going to also build that in Go. There were various tradeoffs involved in this decision. Overall, we were confident that this was a good choice.

I’m going to claim that this resulted in a fairly unusual situation, or certainly unusual to me. We had quite a large team of mostly experienced senior engineers. We had experience working together building software in Go, to build this build agent. We also had experience of building web services together in Clojure. Because of the choice to build this new service in Go, we’d left ourselves unable to use that shared library. All of the tooling and the patterns we had with writing a CLI tool, we didn’t have any of that scaffolding, that standard library stuff for building a web service. I think this was a relatively unusual situation. In particular, this situation is a real recipe for bikeshedding, for bickering and debating over people’s personal preferences for things that aren’t really that important. As well as the bikeshedding, I think it’s also a great opportunity for some experimentation, for some chances to try some things that we haven’t really tried before, try and mix things up a bit.

CircleCI’s Observability (2019)

A little bit more relevant background knowledge. I think this is quite relevant to the story is what CircleCI’s observability was like at the time. This story takes place sometime around summer 2019, possibly back then this was before the term observability had really started to get really heavy use. CircleCI had a two-pronged approach. Both prongs were really expensive. StatsD was the primary tool we used. We used metrics. We had lots of metrics, and we had lots of tags. The pricing model for StatsD and actually the underlying cost of the system itself is based around the unique combinations of tags that you use. The more tags you use, the more it’s going to cost you. We also had a rather expensive, self-hosted Elasticsearch system. That’s where all our structured logs went. That’s generally the thing we’re comfortable doing, adding logs to our system with occasionally some fields that we can query.

Honeycomb

Around this time, we’d started working with a new kid on the block, and that was Honeycomb. We’d had a period of database problems in the spring of 2019, and to help us uncover what was really going on there and get a bit more visibility into our system, we’d started exploring Honeycomb. It really opened our eyes to how our systems were behaving in production. We’d start to spot things that we hadn’t really appreciated before. I was hooked. I’d started looking at Honeycomb before even checking metrics or logs, even when we had only instrumented quite a small proportion of our overall stack at this point. We were also starting to see tweets like this floating around. This is Charity, one of the founders of Honeycomb. She’s railing against this concept of three pillars of observability: metrics, logs, and traces. She’s claiming they aren’t really a thing. I was starting to buy into this. I proposed an experiment. Given the situation, we’ve got a little bit of a blank slate. We know what we’re doing. We understand each other. We know how to work in a programming language. We’re not completely inventing everything from scratch. I proposed this experiment.

What If We Didn’t Have Any Logs?

I said, what if we didn’t have any logs? What does it mean to not have logs? We need a definition of logs in order to not have them I think. This is the definition I’m going with. Logs are text-first telemetry. Telemetry meaning the information our system emits in order to understand what’s going on. Text-first, meaning when you’re writing a logline into your code, you’re thinking about it in terms of the text it produces. Logs are intended to be human readable. You’re usually writing a log as a message to your future self, or some other operator. A little message in a bottle, as it were. If you’re lucky, the logs will have some structured data attached. Some key-value pairs to provide a bit more context about what’s going on that are queryable. If you’re less lucky, then that extra contextual information will be part of the human readable bit of a log, which will make it much harder to query against.

Logs are generally scattered across a code base. There isn’t a common pattern for exactly where a log should or shouldn’t go. You probably are trying to debug an issue and you realize there’s something you’d like to see that you can’t see, so you go back into the code, you add that logline, and then you ship it. Then now you’ve got a new logline and you’ve got that additional visibility. Logs are pretty much always visualized and explored as a stream. Sometimes there’s just text with grep, sometimes in visual logger creation tools, but even then they’re still usually thought of as a stream of text going past that you have some way of picking the lines that are most interesting to you within them. Logs also have this concept of a log level, so debug, info, warn, error. Some logs are more important than others. When we configure a system in production, we often disable debug logging. I’m sure many of you have been in a situation where you’ve had a production issue, you’d love to see what’s going on, and you’ve looked in the code. There is a logline that would tell you exactly what you need to know, but it’s disabled in production, because it’s just way too noisy. That’s logs.

An Event-First Approach

If we don’t have logs, what do we have instead? We’d have what I’d like to call an event-first approach. Not the catchiest name, but I think it’s a reasonable term. Again, we need a definition, what is an event-first approach? An event-first approach, as opposed to text-first telemetry, is data-first telemetry. We’re primarily thinking about describing what’s going on in our system as data. We do that via events. Each event has a unique name that identifies it within our code base, and describes the action that’s going on. All of the properties of that event are structured data. This is partially by virtue of it being new. Generally, now, if I’m writing a new logline, it will also all be structured data. When I’m creating an event now, the event name is just an identifier, and all of the data about that event goes into properties as structured data. We’re also going to wrap these events around units of work and mark the duration of that unit of work. When I say a unit of work, I mean something important that our system is doing. Rather than having a logline for like, yes, a thing started, yes, it’s still going. Ok, it’s finished now. With an event, I’m going to wrap that unit of work and I’m just going to emit an event when a piece of work is completed. Then it will have all the properties I require and it’ll know the duration of that chunk of work.

Events, we’re going to explore and visualize in multiple ways. That includes the stream that we get for logs. It will also allow us to do time-series queries and other types of ways of slicing and dicing that same bit of raw information. We’re not going to have log levels or any equivalent. Where in a logs based system we say certain events are more important than others, in an event system, we’re going to say all events are important in terms of the code level. If we’re struggling with volume, and we need to throw some away, we’re going to use dynamic sampling techniques.

These are quite similar lists of bullet points. Events and logs aren’t actually that different. Events are just good logs. There’s something I’ve been saying to myself at least for a number of years is I’m going to stop using the word just. There’s a lot of hidden meaning behind the word just. It implies a certain level of triviality, which I think is rarely the case. Even if events are just good logs, I think there’s an important philosophical difference there. In particular, I think new words can encourage new ways of thinking. Many of us take our logs for granted. We don’t put a lot of thought into what we’re writing in our loglines. We’ve been using logs for years, so we know how to do logs. Suddenly I say, we’re doing events now, and you go, that’s different. How do I do that? I think using new words, new terminologies, new APIs is an important tool in our toolbox. Because, ultimately, we’re building these systems for people, and so finding ways to change the way people think is an effective way to bring about change.

Example

Let’s see what these look like in practice. I’m going to show a bit of code now. Hopefully, you’re familiar enough to follow some Go. Even if not, I hope you can still appreciate how minimal these interfaces really are. We’ve defined our package with the trendy o11y name. We’ve got a StartSpan function. This is going to create a span with the span representing a unit of work, and it’s going to store it in the context. Context is Go’s equivalent of thread-local storage, but it’s explicit rather than implicit. We’re going to create our span. We’re going to give it a name. Then once we’ve got our span, there’s only two core operations we really need on a span. The first one is to add a field. This has a key and a value, where the key is the name of the data, and the value is anything we like. Then after a span has run for some time, we’ll call this end function on the span. That will record a duration from the start to the end and send it off to the backend. Fairly straightforward, I hope.

Then, when we write our application code, we’re going to sprinkle a little bit of the span code in throughout it to produce the telemetry. In this case here, we’re going to start our span and we’re going to name it DeleteEntity, to match up with the name of the unit of work that we’re performing. We’re going to use Go’s defer construct so that when this function ends, it captures the error and the span ends when the function ends. Then throughout the body of this function, we’re going to use a series of these AddField calls to add important context about what’s going on. Generally, domain specific information about what’s happening within this function, what work we’re performing right now.

Then when we do this throughout our code, we can send it off to Honeycomb, and we get to see these nice little trace waterfalls like this. If any of you have used some tracing tool, I don’t think this will be a revolutionary concept to you. You’ll have seen a lot of stuff like this. As we browse around the Honeycomb UI, and we click on these rows, all of that extra field data that we attach to our spans will be viewable in the little sidebar.

Some Patterns Emerged

We started from first principles. We had this really super minimal interface. Then as we worked on it over time, and built up this new system, we started to develop and extract some patterns. One of the first patterns that emerged is having a consistent way to capture errors when a span ends. There’s a little bit of sleight of hand here with named return values and pointers, and so on. The general idea here is that whenever this function ends with an early return, or whatever situation, the defer block will run, and we’re going to call the standard helper, this end function to end our span. This makes sure that every time this function ends, it goes through our helper. There’s another way to do the same concept, which will be to use a slightly more aspect oriented style, where we wrap our code with an observability layer that respects the same interface as the actual code. Of the two approaches, we much preferred this inline approach where we actually clutter our code with the observability code. The reason for that is generally when you’re coming to make a change to the code, because it’s right there in your face and in your way, then you’re much more likely to remember to update the observability code to match. Whereas if it’s off in a separate layer, it’s very easy for the two to fall out of sync.

Inside the body of this helper function, we’ve just got some really basic logic to ensure that we’ve got consistent storage fields. Every time there’s an error, we’re going to set the result field of the span to have a value error, so we can very easily find spans containing errors. We’ll also populate the error field with some details about what went wrong. In the real version of this, there’s a few more cases that handled for like timeouts, and so on. This is the core concept. When we send this off to Honeycomb, it’s able to highlight all of those errored spans and pull them out so we can see them clearly. If you’ve got a much longer trace and only one or two of those have errored, this is way more visually helpful. It also means we can do a time-series query on those same fields. Here, I’ve taken a single one of those names, and I’ve said, all the spans with a certain name, show me whether or not they errored. You can see there are some spikes here where clearly something went wrong and those error rates spiked up, and maybe that’s something worth looking into.

Another pattern that emerged is what I like to call medium cardinality span names. Cardinality is the number of unique values of a particular field. For example, earlier that results field has only got two or three possible values, that’s low cardinality. Whereas something like a customer ID is high cardinality. Hopefully, you got a lot of customers and there’s lots of possible values of a field like customer ID. Low cardinality values are really great for grouping events together. You can say, show me how many events failed versus passed. Really useful. Whereas if you say, show me group by customer ID, you just got loads of separate rows, not quite as useful for grouping. When you’re looking at single events, knowing exactly which customer affected is really effective. Medium cardinality is somewhere in between. I’ve often found that auto-instrumentation will default to quite low cardinality span names. For instance, something like, it might just say, HTTP request, or select query, or insert query. When you’re looking at a trace waterfall, and it says something like HTTP request, HTTP request, select query, insert query, it’s not entirely clear what’s going on. Whereas what I found was by using medium cardinality names, so in this case, the pattern we did was generally package method. Occasionally, we’d also prefix with the type. The examples I’ve got here are like a gRPC call, or a database query, just the extra little bit of context means that when you’re looking at a trace waterfall, or when you’re grouping by span name, you can immediately see what action is going on, rather than having to drill down into the individual spans and look at their fields. Generally just gives you a much quicker at-a-glance view of a trace.

Spans Are Cheap but They’re Not Free

Another thing we start to notice fairly early on was cost. We already had two very expensive telemetry backends, we didn’t really want a third expensive telemetry backend. I’m sure you can imagine, CircleCI is quite a high volume system, millions of builds a day, lots of RPC calls as part of those builds. Anything that multiplies per call gets very expensive very quickly. If you take a naive application of the approach I described above, where each layer gets wrapped with some spans to denote the unit of work, you can very easily end up with a trace like this one. I’ve got four different spans each representing a different layer of our code. Ultimately, there’s no other code happening in that request handler. All of these spans are mostly recording redundant information. When we start to see traces like this, we got a little bit more selective about which layers really benefited from being considered units of work, versus just being delegated down to the other layer. In this case, the top layer there is the HTTP handler, and the second layer down is the domain layer, which is the core of our application logic that’s separate from HTTP. We made some tweaks to how many of these spans were produced. That did save us actually, quite a bit.

Adding Lots of Domain-Specific Span Fields

When we’re throwing away spans like that, or reducing spans, we are losing a bit of information. We then developed a few patterns to try and get that information back, so generally, adding lots of domain specific fields onto spans. In Honeycomb, it doesn’t cost anything additional to add more fields to make a span wider. It generally tends to encourage you to do that. For example, in the previous trace there, there was an HTTP client that did retries. That was creating quite a deep trace. Whereas, instead of having a span for each retry attempt, you can just have a counter on the final one to say how many attempts were made. That way, you’re losing a bit of information, but you’re still overall capturing what’s going on. We’ve also found that in a microservice system, you’ve got loads of different storage backends, lots of different identifiers. It’s very helpful to add as many of those onto your spans as you can get away with. Then when you do have an issue, you can see exactly which customers it’s affecting, or even in many cases, which customer is causing that issue.

Isn’t This Just Instrumenting with Traces?

Anyone who spent some time instrumenting their code with modern tracing tools is probably mostly shrugging at this point. You’ll have come across many of these patterns in your own work. At this point, I’m just instrumenting with traces. There’s that word just again. So far, yes, I haven’t really done anything new apart from not introducing logs. I’m instrumenting with just traces. Actually, when I said no logs in the title, I was lying a little bit, or bending the truth, perhaps. When I first proposed these experiments, some of my colleagues were a little bit wary. They had quite reasonable questions like, what will we do if Honeycomb is down? How will we see what’s going on? We had this logging system that there were things we didn’t like about it, but we understood its operational constraints, we knew how to operate it. Switching entirely to a brand new approach can be a little bit scary. What we ended up implementing was a little tee inside the o11y library. As well as sending events to Honeycomb, we also converted them to JSON, and wrote them to stdout. That way, after sending to stdout, we then pumped off to our standard log aggregation system. This way, we’ve got a fallback. If Honeycomb is not working, we can just see our logs normally. We could also send these off to S3 or some other long term storage system if we wanted.

We’ve got some JSON logs out of our traces. These aren’t super usable. They’re not particularly readable. There’s just a big wall of text. Actually, we found ourselves using them. In particular, we found ourselves using them in local developments. Because we all have this habit, this pattern of when you’re working locally, you expect to see output from your process right there in your face. When you do things, you want to be able to see that immediate feedback loop. Because we started using these JSON logs, even though they were difficult to read, we made them easier to read. With a little bit of parsing and a little bit of color, we can immediately add a lot more information architecture. We can pull out the span name in color here. If there are any errors in span, we can tag those and make them really pop out. We can abbreviate things. We don’t need the 36-character trace ID in a stdout dev output. We can just take a few characters, enough to make it visually distinct and see what’s going on.

Actually, we found this was really most effective in tests. The Go’s test runner can capture stdout, and it will display it next to a failing test. You get test failure, you can see all of the traces, or all of the spans that happened during that test, in color, in text, right there next to the test failure. This was almost accidental, really, but this turned out to be one of the most effective changes. Because now if you’ve got a failing test, and you can’t tell why it’s failed, then that means your code is not observable enough. The solution to fixing that is not to go fire up your debugger and figure out what’s going on in this particular case. Because this same issue might also happen in production. The solution instead is to extend your tracing code to add new fields, to add new span so you can see what’s going on. Then the reason for the failure of your test is revealed, but also you’ve enriched your observability, you’ve enriched your telemetry, so that when this code makes it to production, you can see what’s going on. That turned out to be really, quite surprisingly effective.

How About Some Metrics?

We’ve got some logs back, what about metrics? What about our third pillar? It’s become a bit fashionable lately to really hate on metrics dashboards. I’ve used metrics dashboards for a lot of my career now. I know how to read them. I’m familiar with them. I think I’m still a big fan. What I especially like is a dashboard like this. For each and every service that we run, I like to have, it’s like headline dashboard. Is that service looking all right? How is it doing? What’s it up to? When we develop new features for that service, we also add them to the dashboard. We co-evolve them over time. It’s not just a static artifact. When I’m then deploying that service, I’ve got something that I build into my process as something to look at. I’ll always open up the dashboard. I’ll hit the deploy button. I’ll merge my pull request, or whatever the process is, and check that things look ok. I still think I’m slightly better at spotting patterns during a deployment than an automated regression system. Especially because that system is averaging everything over time, whereas I know what change I’ve just made, I know what might be likely to be affected. Currently, Honeycomb doesn’t really have a way to do something equivalent to this. It doesn’t have this, let me just have an overview. At CircleCI, we’re very familiar with the system we had. We didn’t necessarily want to throw that all away just because we liked this newer way of instrumenting our code.

I asked myself, could we derive our metrics from our spans? We’ve said there aren’t three pillars, metrics are just another way of looking at events. I really liked how simple and minimal the telemetry code we’d already added was. I didn’t want to clutter it up with an extra layer of metrics code over the top. I had a lot of play routes, and I found an approach that I quite liked. We take our simple span interface, and we add one additional method, the RecordMetric, and that takes a description of a metric to record. Then we have a series of factories that can create those metrics descriptions. Here, we’ve got a timing function that creates a timing metric, an increment function creates an increment metric, and so on.

Then when we want to use that, we take our existing span, and we tell it to record a metric. Then under the hood, the code will then derive the metric from the spans data. When we say a timing metric, the library knows to take the timing metric using the duration of the span. Then these extra fields on the end here, tell us which tags we want to attach to our metrics. We have to be selective about which fields get recorded as metrics tags, and that’s down to cost again. It’s really expensive to send a high cardinality field to the metric backend. While we want those fields in our spans, we have to pick a few of those as being safe for sending off to our metric. In this case, for an HTTP request, all we can really afford to keep is the status code and the results. I think maybe we’d take the path or something as well. We make the author explicitly choose which fields they want to associate with their metrics. Other than that, all of the values for these, the value of result, the value of status, and the value of duration, all come from the properties of the span. Much like logs, our observability abstraction is then able to tee these off to a StatsD daemon, and from there it goes along to the metrics visualization tool of your choice. By ensuring that the metrics and events both have the same source in the code, there shouldn’t be any discrepancies in the values between them.

We’ve got all of those three observability pillars, and only by adding really one set of instrumentation into our code, or one and a bit. If you’ve been researching observability over the last couple years, you’ll have seen many variations of this slide, the three pillars of observability. In fact, I’ve realized we’ve been looking at this pillars diagram all wrong. If you look at it from above, the pillars are hollow, and they’re all just windows into the events happening under the hood. If you think about this in terms of the execution model of what our code is even doing, it makes sense to me. Because ultimately, our code is executing a series of instructions with some arguments. The act of instrumenting code is deciding which of those instructions and arguments we think are worth recording. Those are events. Anything else we derive from that point is all from that same source.

Was This a Success?

At the start of this, I described this situation as an experiment. Was it a success? I think so. It wasn’t a definite success. Yes, there are some pluses or minuses. On the whole, yes, I think this was a success. I definitely learned a lot about what was really important to me when adding telemetry into my code. One thing that I think was a definite success was having only one source of telemetry in the code. Not having a logline here and a span here and a metric here, just being like, this is the telemetry code, and separately, I worry about how that gets off to the backend. That bit I can say, I’m definitely happy with. The trace-first mindset, I also thought worked really well. Training us all to think in a sense of, here is a unit of work that I’m instrumenting, here’s a unit of work that I’m wrapping with a span. I think that worked very well rather than having a logline at the start of something and a logline halfway down, and another log. Then a log at the end. It’s wrapped. It’s a unit of work. That part I think works great.

The bit that I think didn’t necessarily work as well or was arguably not as worth it, was the whole like, let’s burn everything to the ground and start again from scratch. The rethinking everything from first principles, a bit of a mixed bag. In the process of rediscovering everything, we spent a bunch of time bikeshedding, arguing over details, and it turned out to not be important, in the end, reinventing a bunch of wheels. Perhaps that process was still valuable, because in the process of having those discussions we built a much better understanding as a team of what was important to us. We also discovered what we needed to include and what we didn’t need to include in this library we built up.

The other thing that was a bit of a mixed bag was not having any auto-instrumentation available. Because we’ve just invented this new approach, it’s not like we can just grab something off the shelf that will automatically create all our spans for us when we make requests or database calls. The reason I call this one a mixed bag, and not just a straightforward negative is because I’ve had very mixed results with auto-instrumentation itself. I often find that the things that the person who wrote the library considers important might not align with the things that I consider important. Auto-instrumentation can be very chatty. I could be creating a lot of spans with details that I don’t actually care about. The cost-benefit might be off there. Effectively, by not having this available to us, we were forced to instrument everything ourselves. In 2022, all the instrumentation code out there is open source. If you want to instrument code in a new way, you can fork it, you can refer to the way it’s done elsewhere. It wasn’t a huge undertaking, but it did give us the opportunity to reevaluate, did we want this field? Did we care about this bit? How do we want things to work? Yes, a bit of a mixed bag there.

What Now?

What next? What should you do with this story? My recommendations for what to take away from this would be, first off, try a trace-first approach in your own code, regardless of the interfaces or how you’re actually plugging things into your code. When you’re writing new code, try and think about units of work and traces as the primary way of getting telemetry out of your code. Start from that first and then think about logs and metrics afterwards, maybe if you need them. I think that was very effective for us. I think, just that way of thinking even just helped us structure our code a little bit nicer.

I tentatively recommend this concept of a unified telemetry abstraction, having this one place to produce logs, metrics, and events. The reason I’m tentative on this is because people still found it a little bit weird. It wasn’t as intuitive. Maybe this isn’t an area you really need to innovate in. I think it was effective, so I would still say it’s a good approach, but it’s not enough better than the current approach maybe to consider ripping things up, but worth a try. Some of you right there might be hearing the word unified telemetry abstraction, and you may think about OpenTelemetry. OpenTelemetry is an open source project. It’s community led. It’s got a lot of vendors signed up to it. Its goal is to be a unified telemetry platform, so when you grab things off the shelf they come with instrumentation out of the box, they’ve got all that detail in there. It means that when you’re writing instrumentation in any language, you’ve got a standard way of doing it. It’s a really great project.

One thing that’s really different to OpenTelemetry, compared to what I’ve described, is that they still have this very strong distinction between traces, metrics, and logs as different APIs. I don’t know if they’re interested in trying to consolidate these. I haven’t asked them yet. OpenTelemetry, you take traces, metrics, and logs separately, and you put them into the OpenTelemetry box. Then, based on your application configuration, it sends them off to one or more backends, as required. I think if I was doing this experiment with OpenTelemetry, I think I’d still want that extra layer over the top, so that in my application code, at least, I only had that one bit of telemetry code that then teed off to the various different types.

Questions and Answers

Bangser: The first couple questions were about maybe the specifics of experience with logs, and how does that translate to this world with event-first. A really good example I often hear come up is what do you do with the exception handling? What did you all do with that? Were those also sent to Honeycomb?

Mailer: Partially, this story takes place in Go. Anyone who’s worked with Go will know it doesn’t have exceptions. Actually, out of the box, the traditional pattern with Go errors is it just passes them up, and they don’t get any context. There’s no stack with them. That was actually just really annoying is errors, you just get an error that says, file not found. Which file? Where from? Then, a few years ago, Go added this error wrapping feature, so each layer of your stack, you put a bit more context in the error as it travels up, and you end up building your own stack traces, which is not the greatest system in the world, but it works. We do include all the layers of the error, or as much information as we’ve got about any error in the Honeycomb event. The convention, like the field we had there, like the error field, that would be the string of an error which effectively included all that stack information. It did mean that in a single trace, if you get an error midway down, you would get this span with error, and the parent with error, with a bit more information in the parent, that with error with a bit more information and so on. Generally, if that error wasn’t handled in a way that turned into a non-error when it got all the way back up to the top, then that error would be the low error with all the extra detail and the full stack.

I have also done this approach in languages which do have stack traces. In those cases, I would have the error field be like the string version of the error, which is a bit shorter, and you can consume it. I would generally also add this full stack trace in another field. At my current job we use tools like Rollbar, Airbrake, and Sentry, and so on, like exception tracking tools. You can often pass the full stack of an error over to that and that handles grouping and those sorts of things. Then, basically make sure you include the trace ID when you send it to those tools, then you can link everything up and match things together.

Bangser: Of course, stack traces can get quite large, and no matter what tool you’re getting to use, there probably will be a limit of how many characters, how large those fields can get. They can often handle quite a lot. There’s some practicality there. Otherwise, yes, throw it all in, get it all included.

Mailer: When you’re exploring the data, as I showed in those examples, there’s multiple different modes of exploring the data. If you’re plotting a time-series, and you want to group by, you probably don’t want to group by a stack trace, because there’s enough difference. Then once you’ve clicked into a trace, and you’ve found a single error, you probably do want to see that stack trace. Having those both things available in different fields, I found has worked quite well.

Bangser: Different fields, but same UI, same tool.

Mailer: Exactly. You don’t have to go off and open up another tool and log in again, and go through your two factor auth code just to see a bit more detail of your error.

Bangser: You spoke a little bit about telemetry at scale, and so how you’ll use logging levels with logs, and you might use sampling with this event-first. There’s a question here around whether or not you send all service invocations to this event telemetry, or if you don’t trace all of them? How did you handle that?

Mailer: In the story here, we were building a service from scratch. Every time we added a new service or a new dependency to it, we would add the tracing straightaway. In other scenarios we’ve had an existing service that has a lot of dependencies already. Generally, we’d be driven a bit more by need, so we’d go back and add telemetry when we’re discovering a problem with that service. Actually, what I found when you do that piecemeal adoption, is that when you then look at a trace you go, there’s a gap there. Why is there a gap? That gives you that nudge to go and add that extra tracing. Once you get used to seeing these traces and everything linking together, as soon as you get a trace that’s got a bit missing, or a trace that like, “Somebody should have called me, where’s my parents?” You start to go around and add all these correlation headers and so on, so everything all links together nicely.

The way tracing decisions work in most modern tracing tools is you either keep a whole trace, or none of it. The more of stuff you link together, the more expensive it is to say, yes, I’m keeping one. When you start to do dynamic tracing, then the cost of keeping each individual trace increases. That cost, hopefully, is proportional to the value of the trace. Something I’ve been really wanting to experiment with for a while is what I like to think of as like horizontal sampling. Can I keep a slimmed down version of some traces? Maybe I’ll just keep the top level span from each service, but not the detailed spans on 9 out of 10. Then 1 out of 10, I’ll keep the rest, or always on errors. That’s not something I’ve had either enough of a need or the opportunity to explore yet. There’s definitely some stuff you can do that’s similar to log levels without quite being the same as log levels.

Bangser: That’s exactly what I was thinking of when you were describing, it’s almost like you can add a level to your sub spans that then you decide which one gets kept.

Mailer: Trying to have that dynamic tail sampling thing where you say, if it’s an error, capture more. I’ve worked on systems in the past, where there was a special header that was undocumented, but if you set an HTTP header in your browser, then it would turn on debug logging for that request. Those tools are really helpful for like, ok, if I can reproduce an issue, then I can run it in production with more logging.

Bangser: Some more questions around the usability of this, and developer experience. There’s a question here around the annoyance or level of friction in readability when you have to add those span and error calls across your stack. How does that work?

Mailer: Again, in our case, this was in Go, and all of the libraries and code we were using were quite modern in Go, so they all have this context parameter. Basically, the convention is to pass this around, and that’s where you stuff all your data in. That’s worked really well. I’ve had a different experience doing this in JavaScript and TypeScript, where the way the event loop works and the asynchronicity, sometimes the task can get lost. There are helper functions certainly in the Honeycomb instrumentation libraries, and I believe in the OpenTelemetry libraries as well, that basically let you give it hints when you lose that information. Most of the time, it just works and the spans and errors, everything links together.

Sometimes even in process, you have to give it a bit of a hint, to cross process boundaries. If you’re doing common RPC things like HTTP or gRPC, then usually out of the box, you get effectively headers, which match up the IDs and pass them across process boundaries. If you’re putting messages on RabbitMQ, or Kafka, or SQS, or queue based systems, then generally, at the moment, at least I’ve seen, you have to roll your own. You take the same headers that you would put in an HTTP request, and then you add them to the metadata of your queue system. Then you unpack them at the end if you want to link them up. There’s various tradeoffs about whether that should be the same trace or different traces. I think there is a bit to think about there. Each individual choice is actually quite cheap to make. They’re not really complicated things. Which is like, do I want to link this together? If so, I’ll do it. Ultimately, it’s just passing a couple of strings around. It’s not that difficult.

Bangser: I think that also touched on that next question around correlating logs and traces and metadata, and how you’re able to pass that through with things. Is there any other way in which you connect your event data with anything else? Viewing it in, as you said, the Elasticsearch that you had, and things like that, other than just trace IDs and things?

Mailer: Yes, not really. Some of the systems I’ve seen where we’ve added trace information to, already have a request ID concept within them. We add that to all of the various different backends. Generally, when I’m working on newer systems, they’ve never had that before, so the trace ID and the span IDs, those are treated as the things that tie everything together. When we send our errors off to Rollbar, we have a section for like, here’s the trace ID, and so we can match those things back up again, and so on. Likewise, even in the logs, we make sure it’s got the trace ID, it’s got the span ID. If, say you’re on a system where you’re keeping all of your logs, maybe sending them to S3, but you’re dynamically sampling your traces, you can still say, here’s the dynamic desampled ID. You can match that up to the user ID and so on.

Bangser: I think you went into great detail about how you are using this third party SaaS product, but also having a bit of realistic awareness that things go down, and what you need to do in those cases, and sending that to a second location? Have you pragmatically had to deal with that? Did you ever try and send traces out when Honeycomb was down or was experiencing issues? What happened with that? Do you lose those traces from that view, or was it just delayed? How did that work?

Mailer: For Honeycomb, I think they have had a handful of outages but nothing major, so far, touch wood. In those cases, we’re just a bit blind there, or we can log on to the box and have a look, or we can refer to our other backend. If Honeycomb is down, there’s a little background queue in the process which tries to send. If that errors, then it just drops them. I’ve had this same experience with [inaudible 00:45:19] log backends, when sometimes the logging backend goes down, and then you just lose logs with it, or worse. One time, the application was writing to syslog, and then syslog was forwarding, and then to a central that ended up on a box somewhere. Then that box ran out of disk. I don’t know if they’d thought about it, or this was just the out of the box defaults, but it had been configured with backpressure. What actually happened was the applications all crashed because one box filled up with logs. Of the two choices, I would always rather discard logs than take an outage when telemetry is down.

Bangser: Have to pick your priority sometimes. Hard decisions, but I think those make sense. Absolutely.

You ended that talk on a bit of an interesting balancing question of, what would you suggest around unified telemetry approach? You hedged a bit and said, I think I’d suggest it but maybe not. Often with these talks, we gain some more experience between when we deliver them and when we’re actually here for the Q&A. Has anything changed around that? Would you be more bullish in suggesting that unified telemetry approach?

Mailer: I don’t think things have hugely changed. The reasons I gave in the talk there, it was just a bit weird. Everyone looked at me like I was crazy, like, what are you doing? I’ve spoken to a few people that, “Yes, we started doing this. Actually, yes, it was great.” Once you start doing it, it’s like, yes, this feels fine. Just having to convince people over again, especially if you’re a growing organization, when someone comes in and says, “How do we log?” “We don’t do logging here.” They’re like, “What? Who are you? What are you doing?” Effectively, that’s the biggest cost, is getting people on board, getting people to believe that actually it’s fine. Don’t worry about it, this works. I think, effectively, there’s a chicken and egg problem there. Whereas if it becomes a more widespread practice, then the cost of convincing people goes down by quite a lot.

See more presentations with transcripts

Subscribe for MMS Newsletter

By signing up, you will receive updates about our latest information.

  • This field is for validation purposes and should be left unchanged.