Explore how the IOTA Foundation is tackling supply chain digitization in East Africa, including the role of open source distributed ledgers and NoSQL.
Jan 25th, 2023 11:55am by
Image via Pixabay.
The IOTA Foundation, the organization behind the IOTA open source distributed ledger technology built for the Internet of Things, envisions a future where every single trade item in the global supply chain is tracked and its provenance sourced using distributed ledgers. This vision is already becoming a reality in East Africa, thanks to the collaboration of the IOTA Foundation and TradeMark East Africa (TMEA). These organizations have teamed up to address the challenge of digitizing the export process for Kenya’s flower exporters, airlines and freight forwarders.
TMEA found that for just a single transaction, an African entrepreneur was completing an average of 200 communications, including 96 paper documents. The system developed by the IOTA Foundation and TMEA anchors the key trade documents on the Tangle, a new type of distributed ledger technology different from the traditional blockchain model, and shares them with customs in destination countries. This expedites the export process and makes African companies more competitive globally.
What’s behind this initiative from a technology perspective? That’s what José Manuel Cantera, technical analyst and project Lead at IOTA Foundation, recently shared. From a bird’s-eye view, it involves using:
- EPCIS 2.0 data serialization formats for data interoperability
- IOTA distributed ledgers to register every event happening within supply chains
- ScyllaDB NoSQL for scalable, resilient persistent storage
Let’s dive into the details with a close look at two specific use cases: cross-border trade and end-to-end supply chain traceability. But first, Cantera’s perspective on the technical challenges associated with supply chain digitization.
Cantera crafted this talk for ScyllaDB Summit, a virtual conference for exploring what’s needed to power instantaneous experiences with massive distributed datasets. Register now (free + virtual) to join us live for ScyllaDB Summit 2023 featuring experts from Discord, Hulu, Strava, Epic Games, ScyllaDB and more, plus industry leaders on the latest in WebAssembly, Rust, NoSQL, SQL and event streaming trends.
Supply Chain Digitization: Top Technical Challenges
Cantera began ins by introducing three of the most pressing technical challenges associated with supply chain digitization.
First, there are multiple actors and systems generating data and integrating data across the supply chain — and verifying the identity of each is critical. Suppliers, OEMs, food processors, brands, recycling agents, consumers, ports, carriers, ground transporters, inspectors/authorities, freight forwarders, customs, dealers, repairers, etc. are all involved, and all must be verified.
Second, there are multiple relationships across all these actors, and these relationships cross borders with no central anchor and no single source of truth. In addition to business-to-business and business-to-consumer, there are also business-to-government and government-to-government relationships.
Third, there are different functional needs related to maintaining trust between the different actors through verifiable data. Traceability is key here. It’s an enabler for compliance, product authenticity, transparency and provenance with a view to different kinds of applications. For example, traceability is essential for ethical sourcing, food safety and effective recalls.
Use Case 1: Cross-Border Trade
For his first example, Cantera turns to cross-border trade operations.
“This is a multilayered domain, and there are many different problems that have to be solved in different places,” he warns before sharing a diagram that reins in the enormous complexity of the situation:
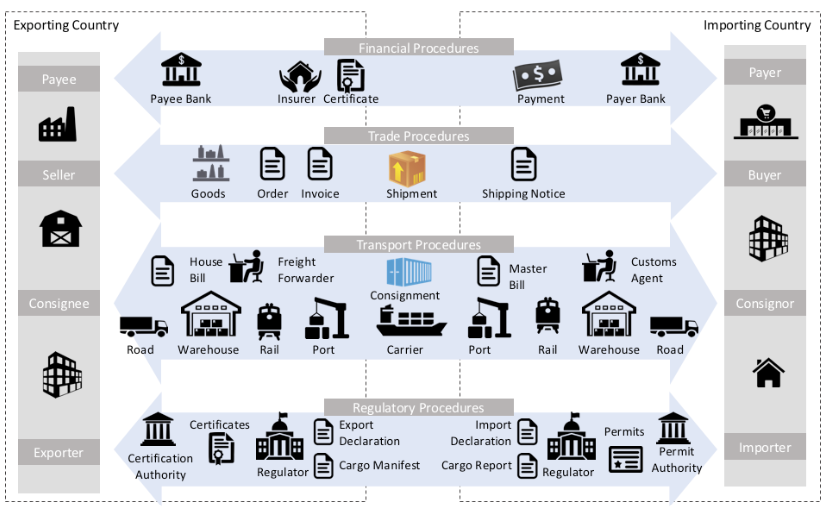
The key flows here are:
- Financial procedures: The pure financial transaction between the two parties
- Trade procedures: Any kind of document related to a commercial transaction
- Transportation procedures: All the details about transporting the goods
- Regulator procedures: The many different documents that must be exchanged between importers and exporters, as well with the public authorities in the business-to-government relationships
So how is the IOTA Foundation working to optimize this complex and multilayered domain? Cantera explains, “We are allowing different actors, different government agencies and the private actors (traders) to share documents and to verify documents in one shot. Whenever a consignment moves between East Africa and Europe, all the trade certificates, all the documents can be verified in one shot by the different actors, and the authenticity and the provenance of the documents can be traced properly. And as a result, the agility of the trade processes is improved. It’s more efficient and more effective.”
All the actors in the flow visualized above are sharing the documents through the infrastructure provided by the IOTA distributed ledger using an architecture that’s detailed after the second use case below.
Use Case 2: End-to-End Supply Chain Traceability
In addition to tackling document sharing and verification for cross-border trade, there’s another challenge: tracing the provenance of the trade items. Cantera emphasizes that when we think about traceability, we need to think about the definition of traceability given by the United Nations: “The ability to identify and trace the history, distribution, location and application of products, parts and materials, to ensure the reliability of sustainability claims, in the areas of human rights, labor (including health and safety), the environment and anti-corruption.”
In principle, traceability implies the ability to follow history. In the case of trade items, this means knowing what has been happening with that particular trade item — not only its transportation, but also its origin. If one of the parties involved in the supply chain is making a claim about sustainability, safety, etc., the validity of that claim must be verifiable.
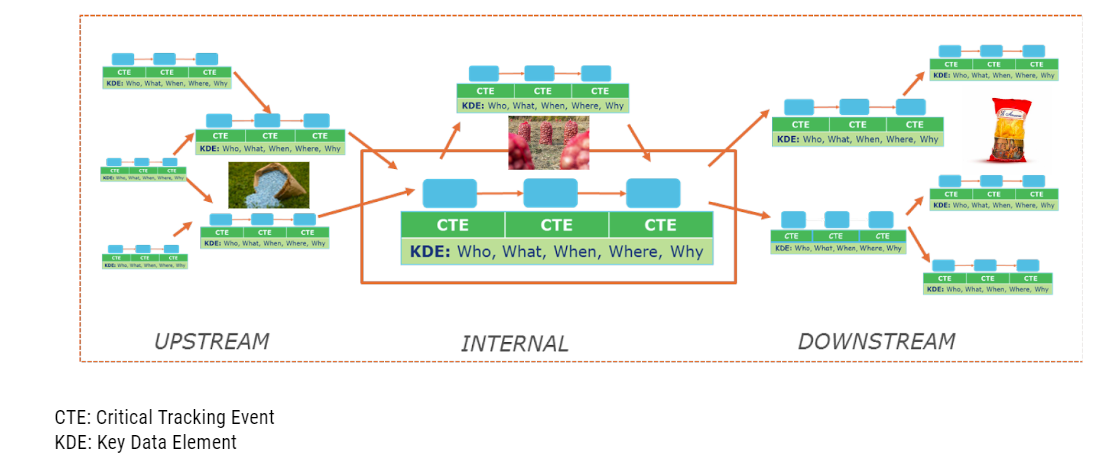
For example, consider a seemingly simple bag of potato chips. A farmer sells potatoes to a food processor, who turns the potatoes into a bag of potato chips. When growing the potatoes, the farmer used a fertilizer, which was produced by another manufacturer and contained raw materials from a different farmer. And when converting potatoes into potato chips, the food processor uses oils that stem from yet another source. And so on and so on. The history of all these things — the potatoes, the fertilizer, the oils, the bag containing the chips, and so on — needs to be known for traceability on that bag of potato chips.
All these details — from when the potatoes were harvested to the fertilizer used, where that fertilizer came from, and so forth — are all considered critical events. And each of these critical tracking events has key data elements that describe who, what, when, where, why and even how.
How IOTA Addressed the Top Technical Challenges
The IOTA Foundation applied several core technologies to address the top technical challenges across these use cases:
- Data interoperability
- Scalable data stores
- Scalable, permissionless, feeless distributed ledger technology
Data Interoperability
In these and similar use cases, many different actors need to exchange data, so that requires a standard syntax, with reference vocabularies, for semantic interoperability. Plus, it all needs to be extensible to accommodate the specialized needs of different industries (for instance, the automotive industry and the seafood industry have distinctly different nuances). Some of the key technologies used here include W3C with JSON-LD, GS1 with EPCIS 2.0 and UN/CEFACT which provides edi3 reference data models. IOTA also used sectoral standards for data interoperability; for example DCSA (maritime transportation), MOBI (connected vehicles and IoT commerce) and the Global Dialogue on Seafood Traceability to name a few.
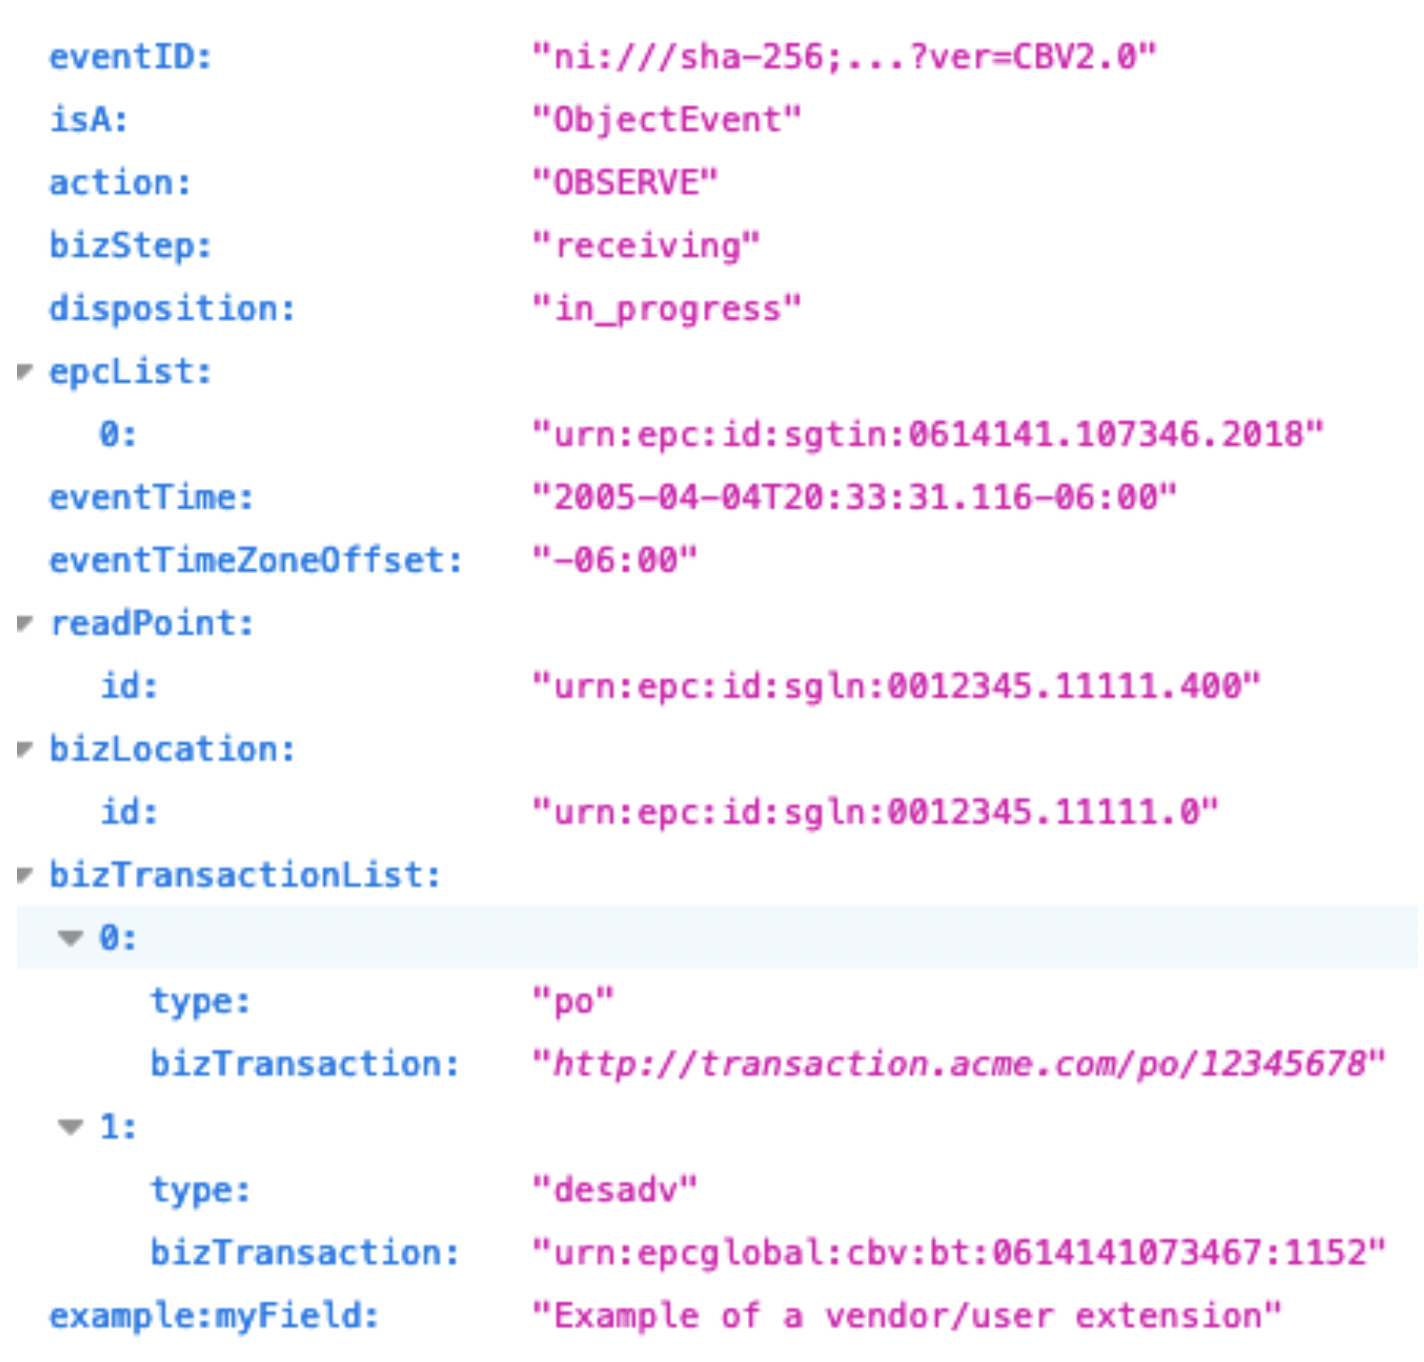
It’s worth noting that IOTA was deeply involved in the development of EPCIS 2.0, which is a vocabulary and data model (plus a JSON-based serialization format and accompanying REST APIs). It enables stakeholders to share transactional information regarding the movement and status of objects (physical or digital), identified by keys. Using this model, events are described as follows:

And that translates to JSON-LD in a format like this:
Scalable Data Stores with ScyllaDB NoSQL
Establishing a scalable data store for all the critical data associated with each supply chain event was another challenge. Cantera explained, “If we are tracking every single item in the supply chains, we need to store a lot of data, and this is a big data problem. And here, ScyllaDB provides many advantages. We can scale our data very easily. We can keep the data for a long period of time at a fine granularity level. Not only that, but we can also combine the best of the NoSQL and SQL worlds because we can have robust schemas for having robust data and trusted data.”
Cantera then continued to detail ScyllaDB’s role in this architecture, providing an example from the automotive supply chain. Consider an OEM with 10 million cars manufactured per year. Assume that:
- Each car has 3,000 trackable parts.
- Each part can have a lifetime of 10 years.
- Each part can generate 10 business events.
This translates to around 300 billion active business events to store in ScyllaDB. Another example: Consider a maritime transportation operator that’s moving 50 million containers per year. Given 10 events per container and five years of operation, Cantera estimates about 2,500,000 active events here — just from the EPCIS 2.0 events repository. But there are also additional layers that require this level of data scalability.
He closes his discussion of this challenge with a look at the many applications for ScyllaDB across this initiative:
- Events repository (EPCIS 2.0, DCSA, …)
- Item-level tracking
- Inventory
- Catalog
- Any DLT Layer 2 data storage
Scalable, Permissionless, Feeless Distributed Ledger Technology
Scalable, permissionless and feeless distributed ledger technology also played a key role in the solution that the IOTA Foundation architected. For this, it tapped the IOTA distributed ledger in combination with protected storages like IPFS to provide the functionalities around data and document verifiability, auditability and immutability within these peer-to-peer interactions.
For example, say you hire a particular transporter to move goods. When the activity begins, the transporter can generate an event that the trade items have started moving through the supply chain, and these events are committed to the IOTA distributed ledger. More specifically, the originator of the event generates a transaction on the distributed ledger, and that transaction can be later used by any participant in the supply chain to verify the authenticity of the event. And once the event is committed, the originator can no longer modify it. If the event was modified, the verification step would fail, and the supply chain partners might be understandably concerned.
Here’s how it all fits together:
Tip: For Cantera’s block-by-block tour of this reference architecture, see the video below, starting at 17:15.
Conclusions
Supply chain digitization is rife with technical challenges, so it’s not surprising that a nontraditional mix of technologies is required to meet the IOTA Foundation’s highly-specialized needs. Cantera sums it up nicely:
“It requires interoperability — which means it’s important to align with the open standards, EPCIS 2.0, the decentralized ID coming from W3C verifiable credentials. It requires a reference architecture to guarantee that semantic interoperability and some reusable building blocks are used. It requires decentralization, and decentralizing data requires distributed ledger technology — in particular, public, permissionless and feeless distributed layers like IOTA complemented with IPFS, and relying more and more on decentralized applications. It also requires data scalability and availability, and ScyllaDB is the perfect partner here. Last but not least, it requires trusted data sharing with technologies like decentralized IDs, distributed ledger technologies, and peer-to-peer.”
Created with Sketch.