Month: August 2024

MMS • RSS

NEW YORK (AP) — NEW YORK (AP) — MongoDB Inc. (MDB) on Thursday reported a loss of $54.5 million in its fiscal second quarter.
The New York-based company said it had a loss of 74 cents per share. Earnings, adjusted for one-time gains and costs, were 70 cents per share.
The results beat Wall Street expectations. The average estimate of nine analysts surveyed by Zacks Investment Research was for earnings of 48 cents per share.
The database platform posted revenue of $478.1 million in the period, also topping Street forecasts. Eight analysts surveyed by Zacks expected $462.9 million.
For the current quarter ending in October, MongoDB expects its per-share earnings to range from 65 cents to 68 cents.
The company said it expects revenue in the range of $493 million to $497 million for the fiscal third quarter.
MongoDB expects full-year earnings in the range of $2.33 to $2.47 per share, with revenue ranging from $1.92 billion to $1.93 billion.
_____
This story was generated by Automated Insights (http://automatedinsights.com/ap) using data from Zacks Investment Research. Access a Zacks stock report on MDB at https://www.zacks.com/ap/MDB
For copyright information, check with the distributor of this item, STATS Perform dba Automated Insights.
, source Associated Press News
MMS • Alan Elder

Transcript
Elder: The fastest code in the world, that is a bold claim. What do I mean by fast? How fast is fast? I come from the world of networking. In networking these days, 100 Gig NICs are really common. What does 100 Gig NIC actually mean? If you make some assumptions about packet sizes, 100 Gig NIC is about 10 million packets per second. Ten million packets per second, if you do a bit more math, you get to 100 nanoseconds.
One-hundred nanoseconds is your time budget for processing a packet. Let’s put that in perspective. A beam of light going from the stage, by the time it gets to the windows at the back of the room, you have to finish processing a packet. We’re at a tech conference, so let’s put it in clocks as well. We’ve got 300 clocks of our CPU per core, in order to do this processing. That’s what I mean by fast.
Outline, and Background
What are we going to talk about? We’re going to be looking at seven different techniques. We’re going to be taking a practical look. I’ve actually gone and written some code for this presentation. We’re going to be working through that code. We’re going to be looking at those optimizations that are making the changes to the code and seeing what effect it has. I’m Alan. How did I get here? Actually, how I got here, I’ve spent about 15 years working in the networking industry. I’m currently working for Microsoft, for Azure for Operators, where our mission is bringing the power of the cloud to network operators.
5G Packet Processing
Let’s make that real with a little bit of an example. Who has been using their phone and has actually got 5G connectivity? What actually happens, data from your phone, when you’ve got 5G, leaves your mobile phone, goes to the radio network, so a mobile tower somewhere around here. Then from that radio network, from lots of different access points in that radio network, it all gets aggregated in this thing called the 5G packet core. The 5G packet core, that is really the brains of the operation. That’s where all the smart stuff happens.
At least, that’s what someone who works in the 5G packet core will tell you. Let’s zoom in on the 5G packet core. What’s actually happening here? Data comes in from the radio network, and it’s encapsulated. The packet your phone is trying to get to the internet is that dark blue packet at the bottom, an IP packet, but it’s encapsulated in all these extra headers. What are they actually doing? They’re telling the packet core who this packet is from? Is this packet from Bob’s phone? Is it from Alice’s phone? What’s the session, and how should that packet be treated? All that information is in this GTP header. What the 5G packet core does is it’s going to match on all that information in the header.
Then it’s going to apply policy. All that policy might be things like applying quality of service, or it might be doing NAT, network address translation. It could even be doing something like lawful intercept. Finally, what it’s going to do once it’s decided how it’s going to treat that packet, it’s going to rewrite the headers, and then send that packet out to the internet. That’s how you’re browsing the BBC News, or whatever it is from your phone.
Attempt 0 – Start Simple
I’d love to do an example with a real 5G packet core, but it’s far too complicated. What we’re going to do is we’re going to use a really simplified version, and we’re going to look at the code. We’re going to keep iterating that code, adding in performance optimization techniques, and measuring what difference they make. Here’s my simplified example. I’m calling it a packet processing device, because I’m not in marketing. What we’re going to do is we’re going to match on the header. We’re going to, based on that match, apply a rewrite policy.
We’re going to rewrite parts of the header. You can see, I’ve colored in some parts of the header here and not other parts. What we’re doing there is some bits of the original header we want to keep, some bits we want to rewrite. Let’s start simple and actually look at some code. I’ve written all of this code in C. Hopefully, it’s pretty self-explanatory, that whatever language you work in, you can understand this. I’ve actually even written some comments, so it’s probably better than most code you’re used to looking at. This is the main function. This is the function that’s going to get called every time our device receives a packet. It’s actually really simple. We’re going to get a lookup key from the packet. All that data in the header, we’re going to build a lookup key from it. Next, we’re going to perform the lookup. I’m starting off really simple here.
I’m just using a standard unordered map from the C standard library. It’s going to be really simple. Based on the result of the lookup, we get a match structure. That match structure tells us how we need to rewrite the packet. Then we’re going to call out apply_rewrite function and actually rewrite the packet. That’s all there is to it. It’s really simple. How does this perform? I measured this in a microbenchmark that I wrote. It’s about 1000 clocks per packet. We’re spending 1000 clocks to process every single packet. If you remember back at the beginning, I said, first, there’s got to be at least 300 clocks per packet. I’m going to call this slow. That’s probably not unsurprising, because we haven’t done any work on it yet.
Attempt 1 – Inline Functions
Let’s now start trying to optimize that code, bringing in different techniques. We’re going to start really simple. We’re going to start with a nice easy one, something called an inline function. If we look at this process_packet function, this is a function that is going to be called an awful lot. We said about 10 million packets a second. Every second, we’re going to be calling this function 10 million times. What does calling that function actually look like? There’s the actual interesting work that we want that function to do, that’s the green box in the middle.
There’s a bunch of overhead that comes from that function call as well. For example, we’re going to have to push the arguments to the function onto the stack or onto registers. We’re going to have to put the return address onto the stack. We’re going to have to jump to the code that we want to execute. Then, we got to clean up as well. We’ve got to undo that function call. We’ve got to pop the address back off the stack. We got to jump back to where we want to execute. We’ve got to clean up those arguments we pushed onto the stack.
All of those blue boxes, they all cost you performance. If you inline a function, you can get rid of all those overheads, and you just do the interesting work that you care about. The good news is, it’s really easy in your code. It varies by language. In C, there’s the inline keyword. Then, for some reason that I’ve never figured out, that’s actually just a recommendation to the compiler. If you actually want your code to inline this function all the time, you need to use the always_inline attribute. Here we go, we add a little bit to our function definition, and we can improve the performance. It’s not much. We haven’t made a massive gain here, but we’re just getting started.
Attempt 2 – Let the Compiler Do the Work
At this point, as I was writing this code, I was a little surprised that I wasn’t getting better performance on this. That’s when I remembered that I really should have turned on compiler optimizations. Because the compiler is good at optimizing code, we should let it do the work. I would be astonished if everyone didn’t compile their code with -O3, at least their production code. Does anyone not use -O3? What about the target architecture? How many people set the target architecture for their code? Anyone not do that? What does this do? In this case, I was running my benchmark on my laptop there, it’s got a Skylake chip in it. I set the target architecture to Skylake. That allows the compiler to use some additional instructions.
The key ones I want to pull out from this list are the ones that start with AVX. The AVX instructions are the vector instructions. What I’m doing by specifying the target architecture, is I’m letting the compiler use those AVX instructions. We’re going to look at those in a bit more detail later, but they are really good for performance. I’ve got one more here, the mbranches-within-32B-boundaries. How many people use flags like these compiling their code? Some people? This is quite a specific one. There was a bug in Intel chips called Jump Conditional Code Erratum. Intel fixed that with a mitigation, but that mitigation causes the Decoded ICache to be flushed, if your branches are not aligned on 32-byte boundaries.
If your Decoded ICache gets flushed, that means you’re going to get more ICache misses, and the performance of your code is going to go down. In our case, on certain target architectures, this compiler flag gives about a 7% performance boost. I think the general point here though, is there’s all kinds of special compiler flags like this. If you really care about performance, have a look at what there is, and know what your system is, so you know what might be useful. Turns out the compiler is really good at optimizing code. We’re down to about 400 clocks per packet. We’ve made a really significant difference there, but we’re still not at our 300 clocks per packet. We can still go faster. Those of you who are observant will notice I’ve got lots of more space on this graph to fill in, so we’re going to keep going.
Attempt 3 – Vector Instructions (AVX)
I mentioned those vector instructions, as part of enabling the compiler to use them. We can also use vector instructions by hand. What is a vector instruction? A vector instruction is an example of Single Instruction, Multiple Data. It’s something that GPUs use, which is why they’re so good at training AI models. Let’s have a look at a quick example. Here’s a vector instruction called vpand. This is a vector instruction that does a logical and, on multiple bits of data at the same time. In this case, it operates on vectors.
These vectors in the case of AVX2 are 256 bits long. We can pack 8 integers into each of those vectors. We can do a logical and for 8 different integers all at the same time, with one instruction to get an answer. Again, we get the answer in a vector. How can we use these vector instructions in our code? Let’s go back to our code. This is the main function again, processing a packet. This apply_rewrite function, let’s have a look at what that actually looks like. You can see I’ve used the inline optimization there already. What we’re doing here is we’re going to loop over all the 32 bytes in the header. For each of those bytes, we’re going to and the data with a mask. That’s going to keep the bits in the header that we want to keep, and zero out the ones that we don’t want to keep. Then we’re going to or in the bits we want to rewrite.
The bits we want to overwrite on top, we aren’t going to put those in. Hopefully you can see here that this looks like something we could vectorize. We’re looping over lots of different bits of data, and we’re performing the same instruction each time. How can we use vector instructions to do this? The answer is we use something called Intel Intrinsics. Intel Intrinsics are just some functions that Intel provide, which makes it easier to use these low-level vector instructions.
What does the code look like now? The first time I saw this in code, it absolutely blew my mind. The first thing we’re going to do is we’re going to load the data from the packet, and we’re going to put it into a vector. Vector instructions operate on vectors, we need to get the memory into a vector. Then we’re going to use an and, a vpand instruction to and the data from the packet with the mask. We’re going to zero the bits we want to rewrite, and keep the bits we want to keep.
Then we’re going to do an or. This is where we or in the rewrite value for the bits we want to rewrite. Finally, the date we’ve got is in our vector still, so we need to put it back into the memory where the packet is. We have to store it. That was pretty good. That was using AVX2 instructions. We can actually do even slightly better using AVX-512. AVX-512 is the next iteration of vector instructions. They introduce something called ternary logic operations. A ternary logic operation lets you do binary logic between three arguments at the same time. In this case, the magic hex 96, means A and B or C. That will probably save us one clock per packet over the AVX2 version. It’s slightly better. We’ll go with that one.
How does that do for performance? I was hoping for a lot better than that. We did quite a lot of work there. What’s gone wrong? What’s gone wrong is the compiler is a lot smarter than us, it turns out, and the compiler is already using those vector instructions. Here’s the code from our rewrite packet function. This is the code from before we vectorized it. In the box here you can see the assembly that’s been produced. You can see the bold here. You can see, the compiler has already decided it’s going to implement this using a vpand, and a vpor. The compiler has already done the work for us, so we get hardly any performance improvement from these vector instructions. It’s not always going to be the case. In this example, we haven’t actually got any benefit from it.
Attempt 4 – Advanced Data Structures
We’re going to have to start working a bit harder now. Let’s look at our data structures. At the beginning, I said, we were just using a standard HashMap. There’s been loads of research done on different data structures to enable fast lookups. What we’re going to look at is a data structure called a Swiss Table that Google came up with. I’m going to give a really brief introduction here. How does a Swiss Table work? It’s a hash table. We’ve got a hash. What we do with that hash is we split it into two different bits, we’ve got an H1 value, which is the first part of the hash, and we’ve got an H2 value, which is the second part of the hash. What the H1 value does is it identifies a group. That group does two things. First of all, it tells us which bucket our entry is going to be in, the actual thing we want to find.
The second thing it does is it points us to a metadata array. This metadata array is one of the key things here, that contains the packed values of all the H2 hash values of the entries that we’ve put in to the bucket. What we do then with our H2 hash value, is we look in the metadata array, find which one matches, and then that lets us jump straight to our correct entry. Whenever you’re talking about a lookup, and someone says, jump straight to, that is a good thing.
Let’s have a little look at what’s going on, just simplified, because I’ve gone very quickly through that. What we’re doing here is, number one, we calculate a hash. Number two, we get the metadata array based on the value of H1. Number three, we go through that metadata array, comparing the H2 hash value with the different metadata values. Then, depending on which one matches, we jump straight to the entry. Why is this good? Why is this going to be more performant than our standard HashMap? First of all, it’s really cache efficient. In this implementation, we’ve only got two memory indirections.
We’ve got one memory indirection to find the metadata array, and then we’ve got one memory indirection to actually get the entry. That’s going to be significantly better than a standard HashMap. The second thing that’s good about this is we’re doing our probing of entries using these H2 hash values. In the mainline case, we don’t have to compare key values apart from for the final entry that we find. The other good thing about this is that packed metadata array, 16 entries in there, we’re doing the same operation with lots of different bits of data. We’ve already talked about vector instructions. You can do that comparison really efficiently by using vector instructions. You spend very little time probing your entries. Let’s look at the code. What does it look like? It actually looks really similar to the standard HashMap.
We’re going to extract the lookup key. I’ve got a slightly different format lookup key just because of the Swiss Table implementation I used. We’re then going to perform the lookup. I’m not cheating here, I’m using exactly the same hash function, which is a significant part of the cost. I’ve used the same hash function, so it’s all fair. Then we’re going to apply the rewrite exactly the same as before. Does this lookup do any better, though? The answer is, yes, it does. It does significantly better. We’re dropping from about 400 clocks per packet to about 300 clocks per packet. We’re getting a really good performance boost from using this new data structure.
Attempt 5 – Interleaved Processing
Moving on to the next one. We’re starting to have to work really hard now. Interleaved processing is the next thing. I talked a little bit on the Swiss Table about how cache efficiency was really important. With this interleaving technique, we’re going to look at that in more detail. When your program is getting memory, you can’t get that memory immediately. There’s a memory latency. The memory latency that you have depends on where you’re getting that memory from. If you get the memory from L1 cache, it’s really fast. L1 cache is tiny, you can’t put much stuff in there. If you get your memory from main RAM, it’s really slow. The 200 clocks there, approximately, is going to blow our budget of 300 clocks. RAM’s massive, you can keep loads of data in there. What we’re going to do with interleaving is look at how we can minimize the effects of this memory access latency.
Let’s look at an example. Our packet processing, what are we doing as we’re going through processing this packet? We’re going to process packet 1 for a bit. We’re then going to get to the point where we need a bit of memory, which we don’t have hot in cache. We’re going to stall for a bit, we call it a memory stall while waiting for the memory. Then we can carry on processing packet 1. Then we start processing the next packet. Now packet 2, and exactly the same thing happens. We get to the point where we need the memory, we don’t have, we have a memory stall. We wait for a bit, we get the memory, we can continue processing.
Now let’s look at this with interleaving applied. With interleaving, we’re going to start processing packet 1. We’re going to get to the point where we need some memory that we know is not going to be in cache. Instead of continuing processing packet 1, we’re instead going to issue a prefetch instruction for the memory. What this does is it goes and gets that memory and puts it into L1 cache. Instead of carrying on processing packet 1, we’re going to start on packet 2. Packet 2 is independent, we can start processing that.
Similarly to packet 1, once we get to the end of that first bit processing, when we get to the point we need some more memory, we’re going to prefetch that memory, and then we’re going to go stop and do something else. By this point, the memory that we need for packet 1 is going to have made it into L1 cache and it’s going to be nice and hot. We can just finish packet 1 processing now. We don’t have to wait. We don’t have that memory stall anymore. Then we can do exactly the same for packet 2, because while we were finishing processing packet 1, we’ve given time for the memory to get into L1 cache.
What that means is we end up saving significant amounts of time, because we’re not suffering these memory stalls. It’s worth saying, I’ve significantly simplified this picture. The execution unit is going to be doing a bunch of stuff to try and stop your program suffering memory stalls like this. It’s going to be using parallel instructions. It’s going to be using out-of-order execution. It’s going to be using pipelining. All those techniques that’s very similar to what we’re doing with interleaving. The thing is, with interleaving, we, the program writer, know exactly what our code is doing. We know the intent of it. Therefore, we can do an even better job than the execution unit can do.
Let’s have a look at what that looks like in the code. Our main function is now no longer process_packet, we’re now going to process a burst of packets. For this example, I’ve used a burst size of 20. We’re going to take 20 packets at a time and process 20 packets in a chunk. We’re going to loop over all the packets in that burst. We’re going to loop over those 20 packets. We’re going to start doing the processing in exactly the same way as we had for our previous bit of code.
We’re going to, number one, extract the lookup key. Then, number two, calculate the hash for the packet that we’re going to need. This is then where it changes. Instead of actually going and doing the lookup, this is the point where we know that memory that we need for the lookup is not going to be hot in cache. Instead of actually doing the lookup, we’re just going to prefetch it. This is actually prefetching that metadata array for the Swiss Table. Prefetch that metadata array, and then we’ll carry on. We’ll go through and process the other 19 packets in our burst.
Then we get to the next bit of code. The next bit of code, we’re going to start looping again. At this point, we’re going to actually do the lookup. This is where we actually do our lookup. If you think about packet number one in the burst, packet number one, we built the lookup key, calculated the hash value. We’ve then issued the instruction to get the memory we need for the lookup. In the meantime, we’ve gone and extracted a lookup key and calculated the hash value for the other 19 packets in that burst. By this point, our memory is going to be nice and hot in our warm cache. This lookup can be nice and fast. If only it stopped there, because the same idea keeps going throughout the code.
Now you can see, I’m not just going to move on to doing the rewrite next, what I’m going to do is I’m going to prefetch the next bit of data that I need. In this case, it’s the match structure, the thing that’s going to tell me how I’m going to rewrite, I’ll prefetch that. I’m not going to keep showing the rest of the code. The rest of the code keeps going in this pattern, where we just do a little bit of work on each packet, and then prefetch the memory need and then move on. You can see, this has an enormous impact on performance. We’ve gone from about 300 clocks per packet, which we thought was pretty good, we’re now at 80 clocks per packet. The key takeaway from this is that memory and accessing memory is expensive. If you want to speed up your code, techniques like a Swiss Table, which are cache efficient, and techniques that stop you having memory stalls are really powerful techniques for improving your performance.
Attempt 6 – Loop Unrolling
We could rest on our laurels here and stop. We’ve still got one more space to fill on our graph, so let’s keep going. We’re going to use a technique called loop unrolling next. Let’s have a quick look at what our code looks like now. After we did our interleaving, our code looks a lot like this. We have lots of these loops where we evaluate an end of loop condition, and then increment or decrement an index. All of that cost, we’re not getting that for free, we’ve got to do some work to do that. Loop unrolling looks at reducing the cost of these loop overheads. Instead of doing one big loop, where every time round, we’re processing the next packet, we’re going to do a smaller loop, where each time round, we’re going to do two packets, or three packets, or four packets.
What this does, in this case, I’ve loop unrolled to a factor of 2, so each time round, we’re going to process 2 packets. In the best case here, where we have an even number of packets, I’m going to have halved the costs of evaluating my end of loop condition, and incrementing or decrementing my index. The other good thing about loop unrolling is I’ve now got this bit of code in the middle where I’m doing an operation on packet 1, and then doing an operation on packet 2. Those operations are often going to be independent. Because I’ve now got them next to each other, the execution unit is going to be able to use parallel instructions to hopefully improve the performance of this even further.
Let’s have a look at what our code looks like. Quite frankly, it’s horrible. If you sent this to me for review, I’d probably send it back to you. Let’s have a look at it and see what it actually is doing. You can see here I’ve loop unrolled to a factor of 4. I’m doing 4 packets each time through the loop. Actually, the code is very similar to what we had before. We’re extracting the lookup key. All we’re doing is we’re extracting the lookup key four different times for 4 different packets. We’re then calculating the hash. Again, we’re calculating the hash 4 times for 4 different packets. Then, finally, we’re doing our prefetching of that Swiss Table memory that we need for 4 times through. I’m not going to show more of the code, because it carries on and it’s fine. The other thing to note though, is we can’t guarantee a burst has a multiple of 4 packets in.
We also have to write even more code, which is really a repeat of the previous code to handle if there was an odd number of packets in the burst. It does have a good effect on performance, so we’re now down to 65 clocks per packet. This looks really small on this graph. It looks like a really small difference, but this is going from 80 clocks to 65. When you’re only down to 80 clocks, gaining 15 is a really significant boost in performance. This is actually a big win here.
Tradeoffs
Let’s pause there, take a minute to look at what we’ve achieved. Sixteen times faster. From our starting point of 1000 clocks per packet, we’re now 16 times faster at just 65 clocks per packet. That’s all from applying these six different techniques. There’s a caveat. If you implement all those techniques, it might not always give you a performance boost. That’s because there are tradeoffs. I’ve kept things simple through this talk up until now. I haven’t talked about the tradeoffs. Let’s look at a few examples of that now, because these are things you need to be aware of, if you’re going to do this to your code. The first one is instruction cache misses. If you use techniques like inlining, or loop unrolling, they make your code bigger. Inlining, we’re putting that copy of the function in every place it’s called from.
Loop unrolling, we’ve seen how much more code we wrote for that. That increases the size of your program, that makes you more likely to get instruction cache misses. If you get instruction cache misses, it can slow your code down. As an example, in my team, we’ve actually removed most of the loop unrolling we used to have in our code, because we found it actually improved performance to get rid of most of it, because we think of the instruction cache. Another one, cache eviction. If you prefetch too much memory, that L1 cache is only really small. If you’re not careful, you can prefetch some memory, and then before you actually get around to using it, you’ve prefetched a load more memory, which has kicked it out. It’s not in cache anymore, but you did work to get there. That’s not going to be good for performance either.
Again, we’ve actually removed some of our prefetching and maybe just prefetched into L3 cache in order to tradeoff these benefits. AVX throttling, another one. When you use AVX-512 instructions, they can be really fast. We’ve seen how they can improve performance. If you use AVX-512 instructions heavily, it actually slows down your CPU clock speed. Slowing down your CPU clock speed is not good for performance. Finally, code maintainability. I just illustrate this with a quick snapshot of what the codes look like. On the simple code, that’s what we started with. Our main function had three function calls in it.
It was more comment than code. Interleaved blew that up significantly. Unrolling blew that up enormously. That unrolled code, it might be better in some languages, but in C, it’s absolutely horrible to maintain. I said seven techniques at the beginning, and I only talked about six in the previous slide. That brings me to the last technique, which is actually what we’ve been doing all the way through, which is benchmarking. If you care about performance, benchmarking is really important. You have to be measuring your performance, iterating on it, and then measuring it again in order to keep making those improvements.
What Can I Learn?
Everyone’s here to learn something. What can you learn from this session? Should you go and rewrite all of your code? I hope everyone has picked up some techniques that you might find useful. What I actually want to finish with is getting you to ask the question of whether you should use these techniques, or whether you shouldn’t. This is my attempt at a single slide to summarize, what can you learn from the fastest code in the world? What do we have here? We’ve got a graph, where on the left here, we’ve got techniques that are really simple to implement.
They don’t take much time, they’re relatively simple. On the right, it goes to complex techniques, things which are hard to implement, things which take time. They’re bad for maintainability. On the y axis, we’re going from low impact techniques at the bottom to high impact techniques that are the top things that have a really big impact on your performance. Let’s look at the different quadrants. This quadrant in the top left corner, these are things which are pretty easy to implement, and have a really high impact on performance. You should all just go and use these.
It’s a no-brainer. Might be a few people going, data structures, was that easy? That looked like you wrote a load of code in the background to implement the Swiss Table. You’re right, I did write a lot of code in the background to implement the Swiss Table, but actually, in most languages now you can use these data structures for free. I mentioned Google came up with this. If you write in C or C++, you can use the Abseil project which Google have open sourced. You can use a flat HashMap, which is a Swiss Table. For those of you who write in Rust, I found out the other day that the Rust default HashMap implementation actually uses a Swiss Table under the covers already. You may even be using some of these data structures without knowing it already.
Techniques that fall in these diagonal quadrants, so things which are easy, low impact, that are really simple to implement, or high impact, but quite hard, these are the ones you need to think about. These are the ones where it might be worth doing this, but it might not. Here, you have to think about efficiency in the broader sense. How much is it going to cost me to develop this? How much is it going to cost me to maintain this? How much is my code going to be deployed? Is this runtime performance benefit going to be worth the extra effort I put into developing it? Probably, you’re not going to use these unless you have an application that performance really matters, or where it’s really widely deployed.
Or maybe this is something where if you’re writing a greenfield project from scratch, you would try and use some of these, but you’re not going to go and rewrite all your existing code to try and add these in. Finally, there’s the stuff that is both relatively low impact and complex, quite frankly, you just shouldn’t ever bother with doing this.
Questions and Answers
Participant 1: What is your view on frameworks that will automatically generate all this highly optimized code, based on benchmarks that will run automatically for you.
Elder: I haven’t found any frameworks that will automatically generate this code that performs at this level that we’ve got to here.
Participant 2: I wanted to ask about the prefetch stuff, like how do you know that the prefetch is finished? Are you going through and actually counting instructions? Isn’t it fragile? A similar question for the cache thrashing problem. You have to tune some parameters to know whether you’re thrashing the cache or not, doesn’t it all get fragile when compilers change? How does that actually work?
Elder: Certainly, in our code, we don’t count the cycles. We essentially pipeline all of our code, so that we’re pretty sure that by the time we need the memory, it’s going to be there. There are some great tools out there, where if you are running performance benchmarks, you can get lots of information about whether you are seeing memory stalls. We use VTune. That’s a really powerful tool for telling you if you are hitting memory stalls, and then allowing you to iterate.
This really illustrates the point of performance benchmarking. If you don’t have regressable performance tests that run as part of your CI suite, then, yes, it’s very fragile, because you can regress performance really easily. One of the key things that we do is we invest heavily in that CI/CD performance regression. Every time any code goes into main, it’s running performance tests, and if they don’t pass, the code doesn’t go in.
Participant 3: The 7th mentioned technique was benchmarking. However, I believe there is a law in physics that says, if I’m measuring something, then I’m affecting it. What’s your point on that? How is it improving the performance instead of regressing it?
Elder: If we measure something, then we affect it. If we’re doing benchmarking, how do we know we’re not affecting performance?
You have to do lots of different types of benchmarking. In the example that I’ve gone through throughout this talk, we’ve really been doing a microbenchmarking. I built an infrastructure around the code, and counted the clock cycles for looping over lots of different times. We saw a really good performance improvement from loop unrolling. I think if you put that in a bigger application, you wouldn’t see the same performance improvement from loop unrolling, because you would start having problems with ICache.
When we’re just using our microbenchmark, you don’t have any problems with ICache, because it’s just a small program. If you measure things in different ways, so you have microbenchmarks where you can iterate quickly, and very quickly turn around performance changes and try things out. Then also have on the other end of the scale performance tests, where you’re testing really the whole solution, and seeing, does it work end-to-end? Then the combination of those can help mitigate some of those problems.
Participant 4: In high level programming languages, normally, I mostly use C#, you don’t have this level of control of the optimization. Which could be a good strategy if I have something that needs to be very performant?
Elder: If you’re using higher level languages, and you don’t have this level of control, what can you do about it?
I think it probably depends on which higher level language you use. Rust is something I use a little bit. I think Rust does actually have ways of calling Intel Intrinsics directly from Rust, for example. I’m not familiar with C#. I think probably when you start a project, you’ve got to make a decision about what language you use. If you’re really looking for something fast and efficient, you choose an appropriate language. You’re not going to use Java or C#.
Participant 5: You’ve put benchmarking part on the seven steps. As you said, in the end, you need to do microbenchmarking at every step. I think a warning can be added about premature optimization, because I see, in various projects, people start making optimizations without directly benchmarking. Then, in the end, it turns out that their optimization and time put into it is useless, because maybe the bottleneck was not in the place where they thought it would be, as notably in people trying to optimize instruction.
In the end, especially when people are using recursive algorithm, people think, I can do least recent chosen optimizations. In the end, it’s not what fast ends will work because, for example, in terms of recursion, loop unrolling could help much more.
Elder: It’s really easy to fall into the trap, even at the whiteboard stage of talking through all the potential problems and coming up with solutions. The earlier you can start benchmarking your code and see how it actually performs, the more you can avoid doing a lot of work that you don’t have to. Totally agree.
See more presentations with transcripts
MMS • Renato Losio

The inaugural European InfoQ Dev Summit is set to take place in less than a month at the Hilton Munich Park Hotel. Following the successful format of the recent InfoQ Dev Summit Boston, the two-day conference for senior software engineers, architects, and team leaders will be held in the Bavarian capital on September 26th and 27th.
Security standards and site reliability engineering will be two of the major themes at the conference, which coincides with the first week of the Oktoberfest festival. Mykhailo Brodskyi, principal software architect at PagoNxt, will discuss comprehensive approaches to software supply chain security:
Developing software in the highly regulated FinTech industry presents unique challenges due to the complexity and risks involved. Regulatory frameworks significantly impact architecture decisions, requiring attention to compliance and data security standards.
Kennedy Torkura, CTO and co-founder at Mitigant, will explain cloud attack emulation, a novel approach for continuously validating security posture by proactively testing the people, processes, and technology aspects of enterprise security strategies:
With cloud security mechanisms increasingly overwhelmed by the fast-evolving cyberattacks, organizations must adopt practical cyber resilience to move from preventing attacks to quick detection, response, and recovery.
Join us in Munich to learn how cloud configuration visibility can enhance an organization’s security posture. Danielle Sudai, security operations lead at Deliveroo, will explore the often-overlooked complexities of cloud configurations. Sudai explains:
Companies are heavily invested in CSPM and CNAPP solutions, revealing misconfiguration in their cloud-based infrastructure. My session will explain how those are identified and what the profit is in understanding our organizational threats to fine-tune detection rules and selecting SaaS/cloud-native tooling.
Michael Friedrich from GitLab will lead a session on building efficient AI workflows, focusing on practical prompts and advanced practices with custom LLMs, retrieval-augmented generation (RAG), and AI agents.
Local speakers from Munich, including practitioners from Nvidia and Siemens, will deliver various talks. In the two keynotes, Teena Idnani and Nischal HP will respectively delve into the dawn of quantum computing and AI in the age of climate change. Nischal HP explains:
I will be taking us on a journey to understanding climate change, what are the main contributors to it, focusing on agriculture and AI, and how this holds the key to changing for human kind.
Thanks to over 20 technical talks from senior software practitioners, the first InfoQ Dev Summit in Munich will offer actionable insights and practical advice on today’s developer priorities. As the chair of the InfoQ Dev Summit, I look forward to meeting you and your fellow senior software practitioners in Munich next month!
MMS • Ben Linders

According to Eb Ikonne, leaders should provide a motivating challenge or mission so that the software engineering team understands what success looks like. They can provide an enabling structure for effective teamwork, address things that negatively impact team success, and reduce or remove friction. Coaching can help people discover how to work effectively together.
At QCon London Eb Ikonne spoke about fostering high-performing work environments for software development.
In his talk, Ikonne referred to the five conditions outlined in J Richard Hackman’s book Leading Teams: Setting the Stage for Great Performances:
- The team must be a real team, rather than a team in name only
- A compelling direction for its work
- An enabling structure that facilitates teamwork
- The team operates within a supportive organizational context
- The team has expert teamwork coaching
The word “team” is often used pretty casually in the work setting, often to create a sense of camaraderie between people who have to collaborate in some form or fashion, Ikonne said. As a leader, you want to clarify who is on (and not on) the software engineering team. Everyone must know the people who might help the team occasionally but are not team members. This clarity is vital, he stated.
Ikonne mentioned that leaders must provide a motivating challenge or mission for the team. The software engineering team should understand what success looks like and what they need to do to achieve it:
As the leader, you need to express why the work matters. The direction serves as an enabling constraint for the team to choose between options on how they will go about doing their work.
Every person, in their role, e.g., architect, software engineer, etc, needs to understand how their work contributes to the whole, Ikonne said.
An enabling structure that facilitates teamwork is an important condition for effective teams that leaders often take for granted, Ikonne argued. You want to ensure the team has the right number of architects, software engineers, team leads, etc required to deliver software successfully.
Ikonne said that the broader organization (unknowingly) prevents teams from succeeding by implementing policies and practices that introduce unhealthy friction. We need to address factors that negatively impact team success and reduce or remove friction.
The supportive context needs to reinforce the importance of teams. However, rewards, incentives, and recognition often encourage a focus on individual interests over the interests of the collective, Ikonne explained:
As a leader, I need to ensure we have the right focus. It takes very little to encourage “hero coder” behavior on a team, which is something team leaders should work to avoid.
Ikonne mentioned that the team leader must provide the software engineering team with coaching or engage third-party professionals to help the team develop its technical and social skills. It’s often taken for granted that people will know how to work well together when this isn’t necessarily the case. The coaching required when forming a team will differ from coaching when the team has worked together for some time or when the team reflects on its work processes. As a leader, I’ve had to recognize and adapt the coaching needed to match the situation, Ikonne said.
As a leader, you must continually focus on and work on these conditions. Conditions will not always be perfect; however, you can only improve these essential conditions by working on them and improving them. That is part of leading teams, Ikonne concluded.
Azure Advisor Well-Architected Assessment in Public Preview to Optimize Cloud Infrastructure
MMS • Steef-Jan Wiggers
Microsoft Azure recently announced the public preview of the Advisor Well-Architected assessment. This self-guided questionnaire aims to provide tailored, actionable recommendations to optimize Azure resources while aligning with the Azure Well-Architected Framework (WAF) principles. The assessments are designed to enhance system performance, resiliency, security, and cost-efficiency while ensuring operational excellence.
The Azure Well-Architected Framework (WAF), which spans five pillars, including reliability, security, cost optimization, operational excellence, and performance efficiency, complements the FinOps framework by focusing on delivering business value and continually improving processes.
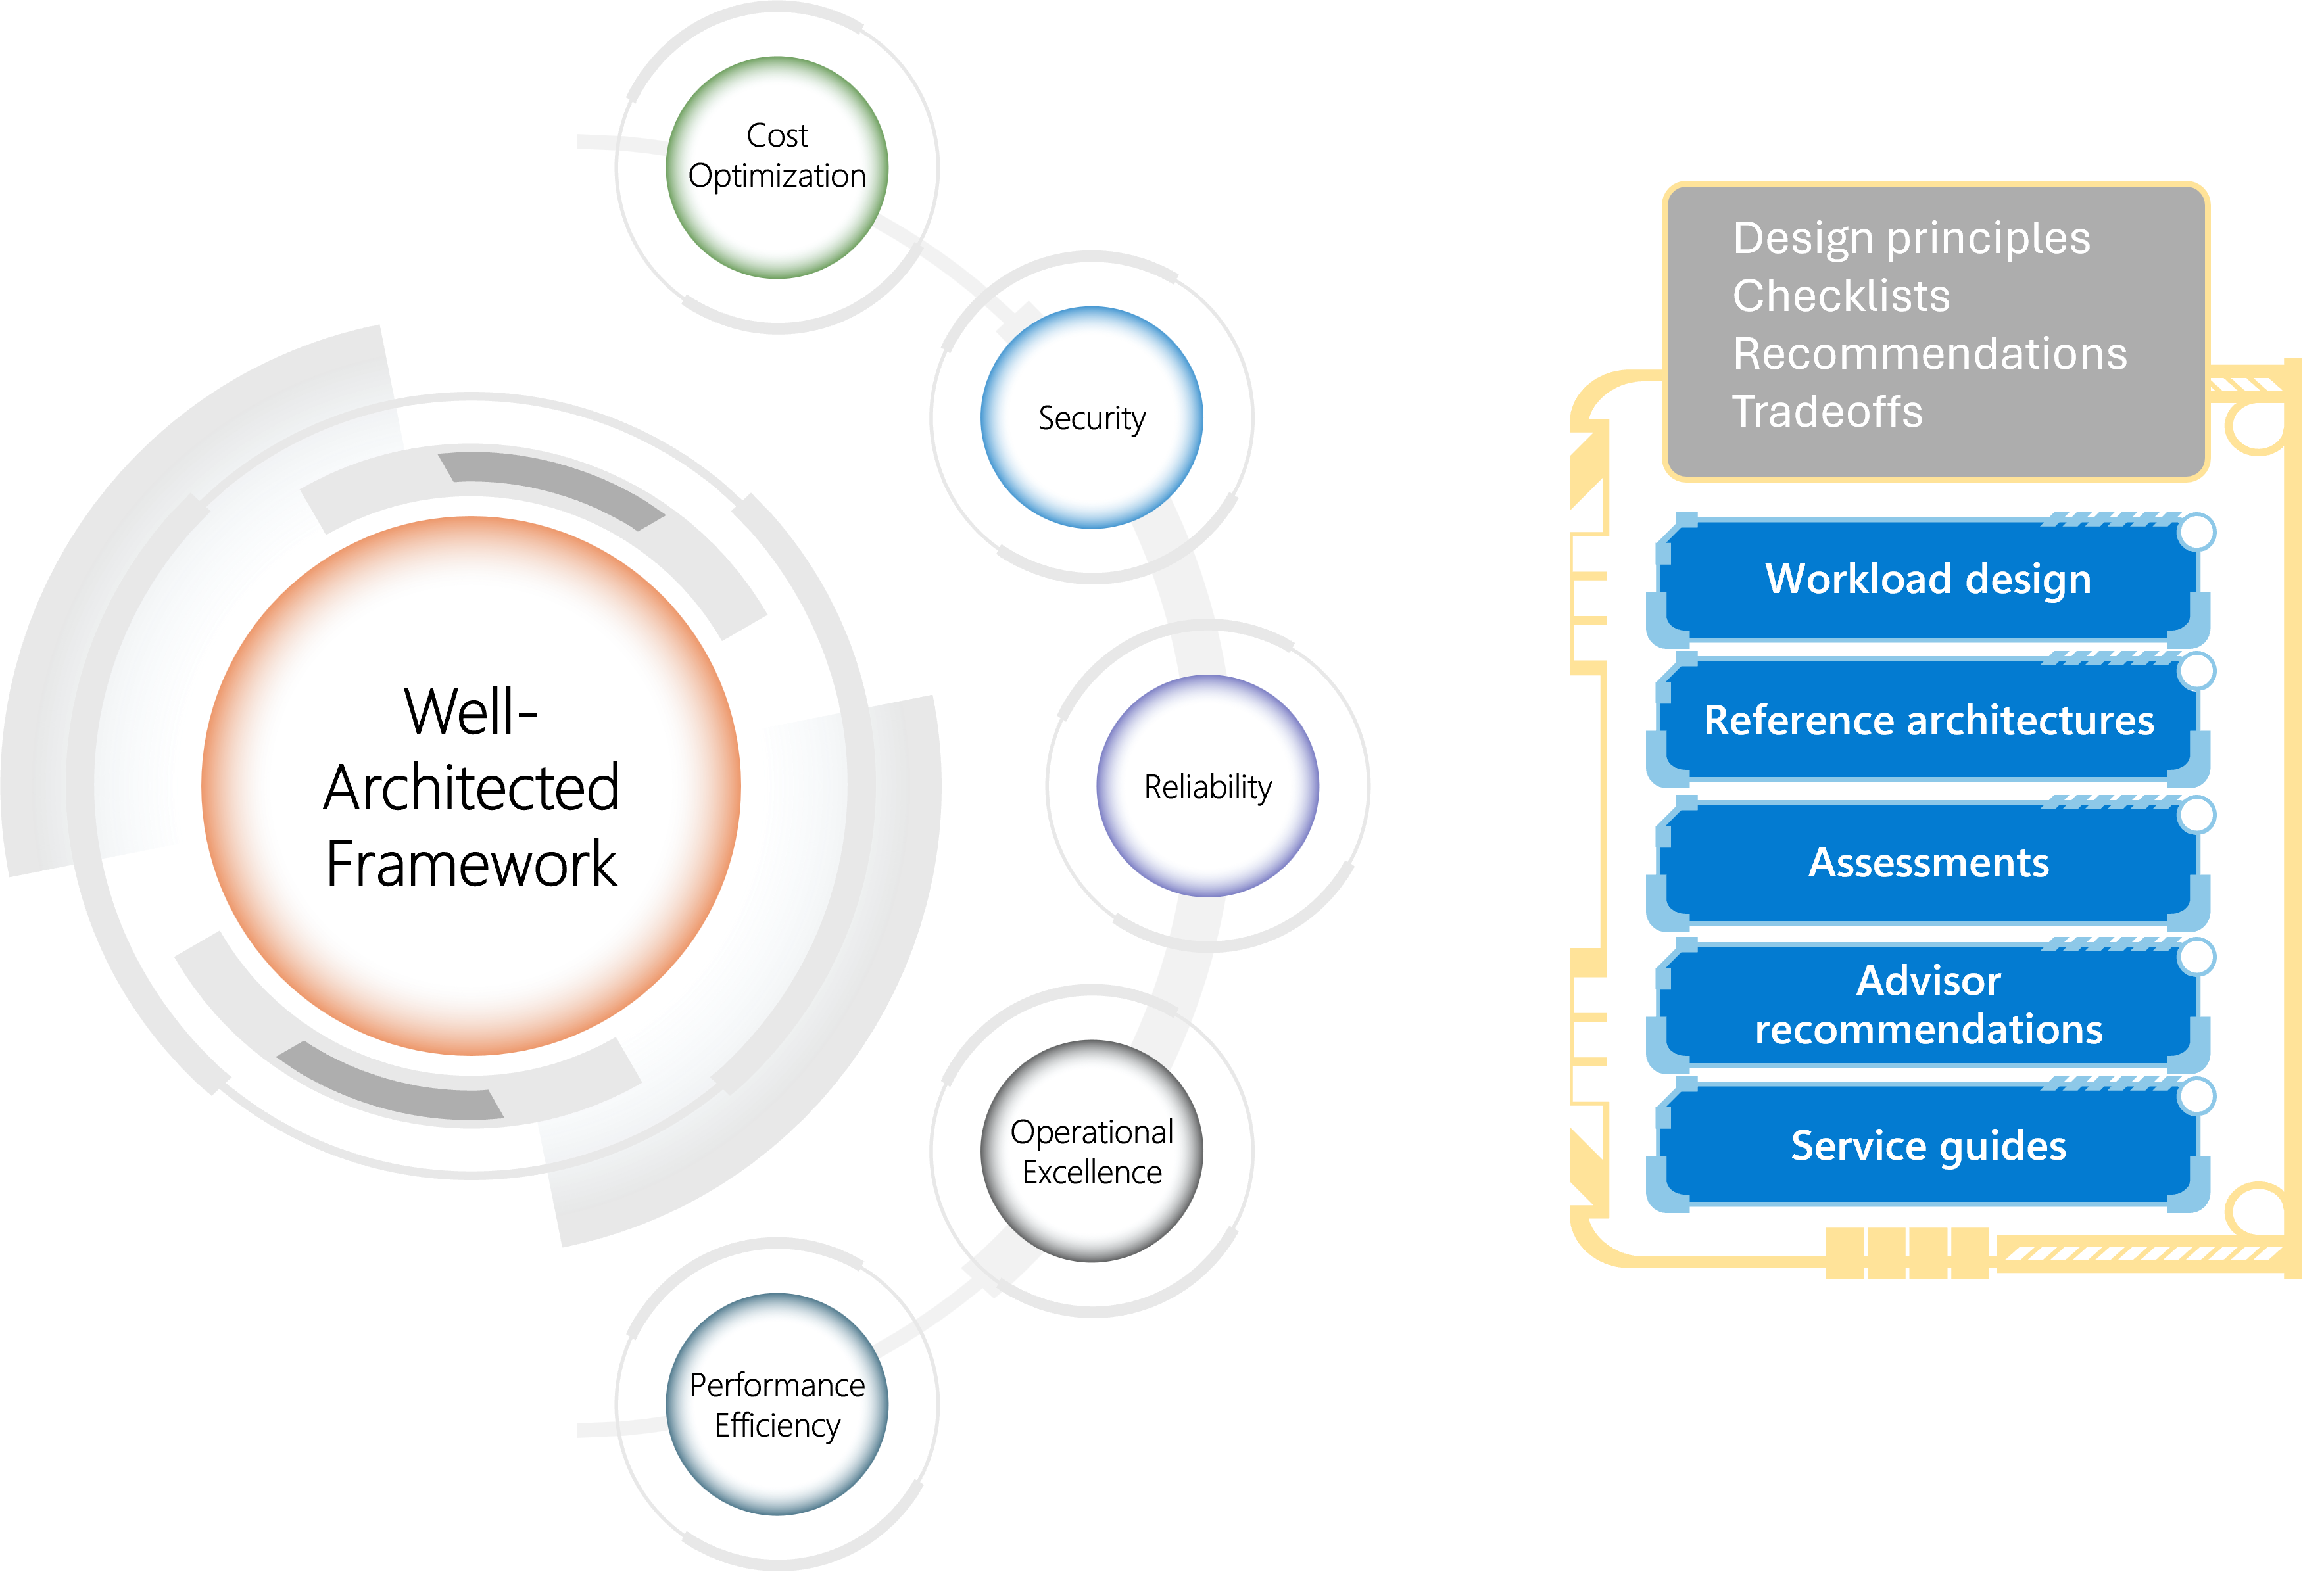
(Source: Azure Well-Architected Framework)
According to the company, the assessment experience is positioned as a companion in the journey toward excellence in cloud workload optimization. It aims to reduce unplanned outages, avoid bloated bills, maintain compliance with industry regulations, detect vulnerabilities, boost performance, and ensure operational excellence. Two new assessments are added with the preview release:
In the Azure Portal, users can select Advisor from any page and choose New Assessment from the Assessments page. Subsequently, they choose the subscription, workload (optional attribute), assessment type, and assessment name and enter a name for the assessment. By continuing with the steps, users will be redirected to the MS Learn platform, where they can complete the assessment.
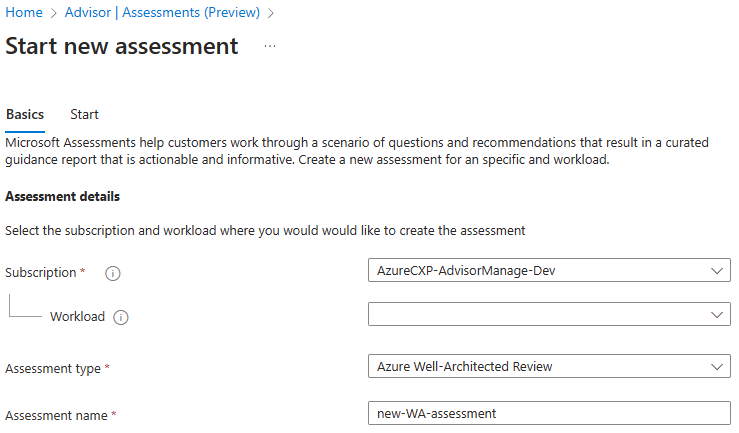
(Source: Microsoft Learn)
The Advisor Well-Architected assessment doesn’t just provide recommendations; it integrates them into operational processes, aligning with the workload’s software development lifecycle (SDLC) for ongoing improvements. This fosters a continuous improvement cycle, reassuring Azure customers that their workloads are regularly updated and optimized. The trade-offs within the Azure Well-Architected Framework encourage a comprehensive approach to designing and managing cloud workloads, equipping customers to make informed decisions that align with business objectives.
Wessel Beulink, a cloud architect at Rubicon, concluded in his blog post on the public preview of the Advisor Well-Architected assessment:
The Well-Architected Framework assessment on Azure Advisor is a tool for enhancing your cloud solutions. It’s a free service, reflecting Microsoft’s dedication to providing valuable tools for cloud management. Use this assessment to elevate your Azure architecture without incurring any costs.
Lastly, the Advisor Well-Architected assessment aligns with the FinOps framework—a set of best practices for optimizing cloud costs, enhancing operational efficiency, and driving business value. This alignment provides Azure customers with a secure foundation for their cloud solutions, enabling them to proactively identify cost-saving opportunities, avoid overspending, and ensure that their solutions are both technically sound and financially sustainable.
MMS • RSS

|
Listen to this story |
If you’re a techie, you’ve definitely heard of Docker – a tool for shipping and running applications. With all the attention it gets nowadays, developers and tech giants like Google are building services to support it.
Whether or not you have an immediate use case in mind for Docker, here’s a compiled list of 15 most popular Docker containers.
1. Alpine
It is a minimal image based on Alpine Linux with a package index. It is only 5 MB in size and built on musl libc and BusyBox. The image has access to a package repository much more complete than other BusyBox-based images. Alpine Linux is a great image base for utilities and production applications.
Read more about Alpine Linux here.
2. BusyBox
Coming in somewhere between 1 and 5 Mb in on-disk size (depending on the variant), BusyBox is a very good ingredient to craft space-efficient distributions. BusyBox combines many common UNIX utilities into a single small executable. The utilities have fewer options than full-featured GNU; however, the included options provide functionality and behave like their GNU counterparts. As a result, BusyBox provides a fairly complete environment for any small or embedded system.
3. Nginx
Nginx is an open-source reverse proxy server, a load balancer, and an origin server. It runs on Linux, BSD variants, Mac OS X, Solaris, AIX, HP-UX, and other *nix flavours. It also has a proof-of-concept port for Microsoft Windows.
If you are still determining your needs, you should use this one. It is designed to be a throwaway container and the base to build other images.
4. Ubuntu
Ubuntu is the world’s most popular operating system across public clouds and OpenStack clouds. In addition, the container platform can run your containers at scale quickly and securely.
5. Python
Python incorporates modules, exceptions, dynamic typing, high-level data types, and classes. It also works as an extension language for applications needing a programmable interface. It is portable and runs on many Unix variants, including Mac, Windows 2000 and later. For many simple, single-file projects, you may need help to write a complete Dockerfile. You can run a Python script using the Python Docker image in such cases.
6. PostGreSQL
PostgreSQL, often called “Postgres”, handles work ranging from single-machine applications to internet-facing applications with several users. The image uses many environment variables, which are easy to miss. The only variable required is POSTGRES_PASSWORD; the rest are optional.
Note: The Docker-specific variables will only affect if you start the container with an empty data directory; any pre-existing database will be left untouched on container startup.
Read more about PostGres here.
7. Redis
Redis is an open-source, networked data store with optional durability.
For easy access via Docker networking, the “Protected mode” is switched off by default. Hence, if you expose the port outside your host (e.g., via -p on docker run), it will be accessible to anyone without a password. Therefore, setting a password (by supplying a config file) is highly recommended.
8. Apache httpd
Apache is a Web server application that played an integral role in the initial growth of the internet. This image only contains Apache httpd with the defaults from upstream. No PHP is installed, but it should be easy to extend. On the other hand, if you want PHP with Apache httpd, see the PHP image and look at the -apache tags.
To run an HTML server, add a Dockerfile to the project where public-HTML/ is the directory containing all the HTML.
Read more about Apache httpd here.
9. Node
Node.js is a platform for server-side and networking applications. The applications written in Javascript can be run within the Node.js runtime on Mac OS X, Windows, and Linux without changes. Node.js contains a built-in, asynchronous I/O library for file, socket, and HTTP communication. The HTTP and socket support allows Node.js to act as a web server without additional software such as Apache.
10. MongoDB
MongoDB is an open-source database program which uses JSON-like documents with schemata. The MongoDB server in the image works on the standard MongoDB port, 27017, connecting via Docker networks, remaining the same as a remote mongod.
11. MySQL
MySQL has become a leading database for web-based applications, covering the entire range of personal projects and websites.
Starting a MySQL instance is simple:
$ docker run –name some-mysql -e MYSQL_ROOT_PASSWORD=my-secret-pw -d mysql:tag
12. Memcached
Memcached is a distributed memory caching system. Its APIs provide a large hash table across several machines. Older data is purged in the least recently used order when the table is full. Memcached applications usually layer requests as well as additions into RAM before retiring on a slower backing store.
Read more about Memcached here.
13. Traefik
Traefik is an HTTP reverse proxy and load balancer to easily deploy microservices. It automatically integrates with the existing Docker infrastructure and configures itself dynamically. Pointing Traefik to your orchestrator should be the sole configuration step.
14. MariaDB
MariaDB Server is a popular open-source database server made by MySQL developers. Starting a MariaDB instance with the latest version is simple:
$ docker run –detach –name some-mariadb –env MARIADB_USER=example-user –env MARIADB_PASSWORD=my_cool_secret –env MARIADB_ROOT_PASSWORD=my-secret-pw mariadb:latest
or:
$ docker network create some-network
$ docker run –detach –network some-network –name some-mariadb –env MARIADB_USER=example-user –env MA
15. RabbitMQ
RabbitMQ is open-source message broker software that implements the Advanced Message Queuing Protocol. It stores data based on the “Node Name”, which defaults to the hostname. For usage in Docker, we should specify -h/–hostname explicitly for each daemon so that the user doesn’t get a random hostname and can keep track of the data.
Read more about RabbitMQ here.
Related Posts
PRESSR: New Veeam Data Platform v12.2 extends #1 data resilience to more platforms and …
MMS • RSS

- Latest Veeam update broadens platform support including Nutanix Prism integration, Proxmox VE support, MongoDB and broader cloud support while giving customers the freedom to move to new platforms safely and securely
DUBAI, UAE – Veeam® Software, the #1 leader by market share in Data Resilience, today announced the release of Veeam Data Platform v12.2, broadening support for protecting data on an extensive range of new platforms while continuing to advance end-to-end cybersecurity capabilities. This latest release combines the most comprehensive data backup, recovery, and security capabilities with the ability to empower customers to migrate and secure data across new platforms. Veeam Data Platform v12.2 is a single, comprehensive solution that provides organizations with the freedom to maintain operational agility and security while safeguarding critical data against evolving cyber threats and unexpected industry changes.
“In a digital world, organizations face three critical challenges: they must protect their data and be able to rapidly recover it no matter what happens; they need the freedom to move to new platforms; and their data must be available where it’s needed, including AI,” said Anand Eswaran, CEO at Veeam. “At Veeam, we’re committed to supporting these critical capabilities for our 550,000 customers, and 12.2 is a major step forward. Veeam Data Platform provides a single platform that delivers data resilience across cloud, on-premises and hybrid platforms bringing together powerful data protection, secure migration, seamless cloud integration, and the industry’s most advanced end-to-end ransomware protection. Data is the lifeblood of every organization and Veeam Data Platform ensures that data is safe, secure and always available.”
With Veeam Data Platform v12.2, organizations have the freedom to choose their preferred infrastructure with scalable policy-driven protection. New integration with Nutanix Prism Central provides the best-in-class protection for enterprise needs. Additionally, the new Proxmox VE hypervisor support allows organizations to migrate and modernize on their terms. MongoDB backup is also included, offering immutability, centralized management, and high-speed recovery.
New Veeam Data Platform v12.2 helps accelerate organizations’ transformation to the cloud, new hypervisors, or HCI with support for Amazon FSx, Amazon RedShift, Azure Cosmos DB, and Azure Data Lake Storage. The platform offers full management of YARA rules, including RBAC, secure distribution, and orchestrated scanning of backups, allowing timely detection of issues and ensuring compliance rules are met.
Strengthening security posture and streamlining operations is made easy with Veeam Data Platform v12.2. Expanded health-check alarms help identify data integrity violations and collection gaps. Additionally, backups can be fast-tracked to archive storage, optimizing costs without compromising compliance.
New Veeam Data Platform v12.2 introduces several new features, including:
- Backup for Proxmox VE: Protect the native hypervisor without requiring the management or use of backup agents. Enjoy flexible recovery options, including VM restores from and to VMware, Hyper-V, Nutanix AHV, oVirt KVM, AWS, Azure and Google Cloud; as well as restores of physical server backups directly to Proxmox VE (for DR or virtualization/migration).
- Backup for MongoDB: Bolster your cyber resilience with ease by leveraging immutable backups, backup copies, and advanced storage capabilities.
- Enhanced Nutanix AHV integration: Protect critical Nutanix AHV data from replica nodes without impacting the production environment. Benefit from deep Nutanix Prism integration with policy-based backup jobs, increased backup security, and flexibility in network design.
- Expanded AWS support: Extend native resilience to Amazon FSx and Amazon Redshift through policy-based protection and fast, automated recovery.
- Expanded Microsoft Azure support: Extend native resilience to Azure Cosmos DB and Azure Data Lake Storage Gen2 for resilient protection and fast, automated recovery.
For more information about Veeam Data Platform v12.2 and its new features, visit https://www.veeam.com.
Learn more about the new Veeam Data Platform v12.2 and discover how organizations of all sizes can keep their data secure, protected, and accessible during VeeamON Data Resilience Summit, taking place virtually October 1 (AMER and EMEA) and October 2 (APJ). Register now for free: https://www.veeam.com/veeamon-data-resilience-summit.
Supporting Quotes
“The Futurum Group’s Cybersecurity Decision Maker IQ data indicates that improving the ability to meet RPO/RTO requirements, and the ability to improve cyber resiliency capabilities, are the top reasons that customers would consider replacing their existing data protection vendor. IT and Security teams express the need not only for confidence in the ability to recover as quickly as possible from a cyber-attack, but also to optimize their security posture and defenses, to prevent an attack to begin with. At the same time, we are seeing customers evaluate a vast array of hypervisor and cloud infrastructure options to optimize both cost and functionalities – making data mobility more important than ever before. Veeam Data Platform v12.2 is pinpointing this requirement, while continuing the company’s steady cadence of data resiliency-focused updates.” – Krista Case, Research Director at The Futurum Group
“We see Veeam’s support for the Proxmox VE hypervisor as a valuable addition for organizations seeking open-source flexibility and cost-effectiveness. It allows customers to stick with their preferred single platform for data backup and recovery while embracing the preferred hypervisor of their choice.” – Martin Maurer, CEO of Proxmox Server Solutions GmbH
“With the recent changes at VMware, we were forced to re-evaluate which hypervisor to choose for our data center – a situation nobody wants to be in. Veeam remains a critical partner for us as we look forward to being able to choose to move to Proxmox. Using Veeam’s trusted tools for data migration will provide us with the peace of mind we need during these tumultuous times.” – James Westendorf, Director of Technical Services, Lake Land College
-Ends-
Video about Veeam Data Platform v12.2: https://youtu.be/9uwT_-SezUY
About Veeam Software
Veeam®, the #1 global market leader in data resilience, believes every business should be able to bounce forward after a disruption with the confidence and control of all their data whenever and wherever they need it. Veeam calls this radical resilience, and we’re obsessed with creating innovative ways to help our customers achieve it.
Veeam solutions are purpose-built for powering data resilience by providing data backup, data recovery, data freedom, data security, and data intelligence. With Veeam, IT and security leaders rest easy knowing that their apps and data are protected and always available across their cloud, virtual, physical, SaaS, and Kubernetes environments.
Headquartered in Seattle with offices in more than 30 countries, Veeam protects over 550,000 customers worldwide, including 74% of the Global 2000, that trust Veeam to keep their businesses running. Radical resilience starts with Veeam. Learn more at www.veeam.com or follow Veeam on LinkedIn @veeam-software and X @veeam.
Send us your press releases to pressrelease.zawya@lseg.com
Disclaimer: The contents of this press release was provided from an external third party provider. This website is not responsible for, and does not control, such external content. This content is provided on an “as is” and “as available” basis and has not been edited in any way. Neither this website nor our affiliates guarantee the accuracy of or endorse the views or opinions expressed in this press release.
The press release is provided for informational purposes only. The content does not provide tax, legal or investment advice or opinion regarding the suitability, value or profitability of any particular security, portfolio or investment strategy. Neither this website nor our affiliates shall be liable for any errors or inaccuracies in the content, or for any actions taken by you in reliance thereon. You expressly agree that your use of the information within this article is at your sole risk.
To the fullest extent permitted by applicable law, this website, its parent company, its subsidiaries, its affiliates and the respective shareholders, directors, officers, employees, agents, advertisers, content providers and licensors will not be liable (jointly or severally) to you for any direct, indirect, consequential, special, incidental, punitive or exemplary damages, including without limitation, lost profits, lost savings and lost revenues, whether in negligence, tort, contract or any other theory of liability, even if the parties have been advised of the possibility or could have foreseen any such damages.
MMS • RSS
-
Do you, or did you, own shares of MongoDB, Inc. (NASDAQ: MDB)?
-
Did you purchase your shares between August 31, 2023 and May 30, 2024, inclusive?
-
Did you lose money in your investment in MongoDB, Inc.?
-
Do you want to discuss your rights?
NEW YORK, NY / ACCESSWIRE / August 29, 2024 / Bernstein Liebhard LLP, a nationally acclaimed investor rights law firm, reminds MongoDB, Inc. (“MongoDB” or the “Company”) (NASDAQ:MDB) investors of an upcoming deadline involving a securities fraud class action lawsuit commenced against the Company.

If you purchased or acquired MongoDB securities, and/or would like to discuss your legal rights and options please visit MongoDB, Inc. Shareholder Class Action Lawsuit or contact Investor Relations Manager Peter Allocco at (212) 951-2030 or [email protected].
A lawsuit was filed in the United States District Court for the Southern District of New York on behalf of investors who purchased or acquired the securities of MongoDB between August 31, 2023 and May 30, 2024, inclusive (the “Class Period”), alleging violations of the Securities Exchange Act of 1934 against the Company and certain of its officers.
If you wish to serve as lead plaintiff, you must move the Court no later than September 9, 2024. A lead plaintiff is a representative party acting on other class members’ behalf in directing the litigation. Your ability to share in any recovery doesn’t require that you serve as lead plaintiff. If you choose to take no action, you may remain an absent class member.
All representation is on a contingency fee basis. Shareholders pay no fees or expenses.
Since 1993, Bernstein Liebhard LLP has recovered over $3.5 billion for its clients. In addition to representing individual investors, the Firm has been retained by some of the largest public and private pension funds in the country to monitor their assets and pursue litigation on their behalf. As a result of its success litigating hundreds of class actions, the Firm has been named to The National Law Journal’s “Plaintiffs’ Hot List” thirteen times and listed in The Legal 500 for sixteen consecutive years.
ATTORNEY ADVERTISING. © 2024 Bernstein Liebhard LLP. The law firm responsible for this advertisement is Bernstein Liebhard LLP, 10 East 40th Street, New York, New York 10016, (212) 779-1414. Prior results do not guarantee or predict a similar outcome with respect to any future matter.
Contact Information:
Peter Allocco
Investor Relations Manager
Bernstein Liebhard LLP
https://www.bernlieb.com
(212) 951-2030
[email protected]
SOURCE: Bernstein Liebhard LLP
MMS • RSS

Earnings Before the Open:
• Pernod Ricard (EPA:PERP) SA (PRNDY): EPS N/A, Revenue $2.9B
• MCBC Holdings Inc (MCFT): EPS -$0.22, Revenue $63.16M
• Campbell Soup NAQ (NYSE:CPB): EPS $0.62, Revenue $2.32B
• Photronics (NASDAQ:PLAB): EPS $0.56, Revenue $225M
• Build-A-Bear Workshop Inc (NYSE:BBW): EPS $0.59, Revenue $109.62M
• Polestar (NASDAQ:PSNY) Automotive Holding Plc (PSNY): EPS -$0.17, Revenue $642.67M
• Gulf Keystone Petro (GUKYF): EPS N/A, Revenue N/A
• Cool Company NYQ (CLCO): EPS $0.4, Revenue $82.31M
• American Eagle Outfitters (NYSE:AEO): EPS $0.39, Revenue $1.31B
• Brown Forman Corp A (BFa): EPS $0.46, Revenue $995.21M
• Destination XL (DXLG): EPS $0.09, Revenue $132.97M
• Campbell Soup (CPB): EPS $0.62, Revenue $2.32B
• 1-800 FLOWERS.COM (FLWS): EPS -$0.27, Revenue $375.18M
• Brown Forman B (NYSE:BFb): EPS $0.46, Revenue $990.82M
• Malibu Boats Inc (NASDAQ:MBUU): EPS -$0.32, Revenue $157.54M
• Ollies Bargain Outlet Holdings Inc (OLLI): EPS $0.78, Revenue $561.08M
• Duluth Holdings Inc (NASDAQ:DLTH): EPS -$0.12, Revenue $129.97M
• Titan Machinery I (NASDAQ:TITN): EPS $0.35, Revenue $644.95M
• Dollar General Corp (NYSE:DG): EPS $1.79, Revenue $10.37B
• GMS Inc (NYSE:GMS): EPS $2.14, Revenue $1.48B
• Burlington Stor (NYSE:BURL): EPS $0.95, Revenue $2.41B
• Best Buy (NYSE:BBY): EPS $1.16, Revenue $9.24B
Earnings After the Close:
• Dell Inc (DELL): EPS $1.68, Revenue $24.14B
• Hashicorp Inc (HCP): EPS $0, Revenue $157.25M
• 3D Systems Corporation (NYSE:DDD): EPS -$0.05, Revenue $116.56M
• Amark Preci (AMRK): EPS $0.77, Revenue $2.72B
• Elastic (NYSE:ESTC): EPS $0.25, Revenue $344.66M
• Mesoblast-Exch (MEOBF): EPS -$0.03, Revenue $8.46M
• Lululemon Athletica (LULU): EPS $2.94, Revenue $2.41B
• MongoDB (MDB): EPS $0.49, Revenue $464.94M
• Ulta Salon Cosmetics & Fragrance (ULTA): EPS $5.47, Revenue $2.62B
• Gap.inc (GAP): EPS $0.4, Revenue $3.63B
• Marvell Technology Group Ltd (MRVL): EPS $0.3, Revenue $1.25B
• Domo Inc (NASDAQ:DOMO): EPS -$0.28, Revenue $76.6M
• Autodesk Inc (NASDAQ:ADSK): EPS $2, Revenue $1.48B
Be sure to check back daily for updates and insights into the earnings season and real-time results here and here. Do you want to trade the earnings of the biggest companies like a pro? Then get InvestingPro now and access over 1000 metrics that will give you a significant advantage in the shark tank that is Wall Street. Click here.
This article was generated with the support of AI and reviewed by an editor. For more information see our T&C.
MMS • RSS
New York, New York–(Newsfile Corp. – August 28, 2024) – WHY: Rosen Law Firm, a global investor rights law firm, reminds purchasers of securities of MongoDB, Inc. (NASDAQ: MDB) between August 31, 2023 and May 30, 2024, both dates inclusive (the “Class Period”), of the important September 9, 2024 lead plaintiff deadline.
SO WHAT: If you purchased MongoDB securities during the Class Period you may be entitled to compensation without payment of any out of pocket fees or costs through a contingency fee arrangement.
WHAT TO DO NEXT: To join the MongoDB class action, go to https://rosenlegal.com/submit-form/?case_id=27182 or call Phillip Kim, Esq. toll-free at 866-767-3653 or email case@rosenlegal.com for information on the class action. A class action lawsuit has already been filed. If you wish to serve as lead plaintiff, you must move the Court no later than September 9, 2024. A lead plaintiff is a representative party acting on behalf of other class members in directing the litigation.
WHY ROSEN LAW: We encourage investors to select qualified counsel with a track record of success in leadership roles. Often, firms issuing notices do not have comparable experience, resources or any meaningful peer recognition. Many of these firms do not actually litigate securities class actions, but are merely middlemen that refer clients or partner with law firms that actually litigate the cases. Be wise in selecting counsel. The Rosen Law Firm represents investors throughout the globe, concentrating its practice in securities class actions and shareholder derivative litigation. Rosen Law Firm has achieved the largest ever securities class action settlement against a Chinese Company. Rosen Law Firm was Ranked No. 1 by ISS Securities Class Action Services for number of securities class action settlements in 2017. The firm has been ranked in the top 4 each year since 2013 and has recovered hundreds of millions of dollars for investors. In 2019 alone the firm secured over $438 million for investors. In 2020, founding partner Laurence Rosen was named by law360 as a Titan of Plaintiffs’ Bar. Many of the firm’s attorneys have been recognized by Lawdragon and Super Lawyers.
DETAILS OF THE CASE: According to the lawsuit, throughout the Class Period, defendants created the false impression that they possessed reliable information pertaining to MongoDB’s projected revenue outlook and anticipated growth while also minimizing risk from seasonality and macroeconomic fluctuations. In truth, MongoDB’s sales force restructure, which prioritized reducing friction in the enrollment process, had resulted in complete loss of upfront commitments; a significant reduction in the information gathered by their sales force as to the trajectory for the new MongoDB Atlas enrollments; and reduced pressure on new enrollments to grow. Defendants misled investors by providing the public with materially flawed statements of confidence and growth projections which did not account for these variables. When the true details entered the market, the lawsuit claims that investors suffered damages.
To join the MongoDB class action, go to https://rosenlegal.com/submit-form/?case_id=27182 or call Phillip Kim, Esq. toll-free at 866-767-3653 or email case@rosenlegal.com for information on the class action.
No Class Has Been Certified. Until a class is certified, you are not represented by counsel unless you retain one. You may select counsel of your choice. You may also remain an absent class member and do nothing at this point. An investor’s ability to share in any potential future recovery is not dependent upon serving as lead plaintiff.
Follow us for updates on LinkedIn: https://www.linkedin.com/company/the-rosen-law-firm, on Twitter: https://twitter.com/rosen_firm or on Facebook: https://www.facebook.com/rosenlawfirm/.
Attorney Advertising. Prior results do not guarantee a similar outcome.
——————————-
![]()
To view the source version of this press release, please visit https://www.newsfilecorp.com/release/221412