Month: November 2022

MMS • Nahla Davies
Article originally posted on InfoQ. Visit InfoQ

Key Takeaways
- DevOps usage is snowballing, but organizations are having problems finding enough experienced personnel to build DevOps teams
- DevOps tools and workflows allow organizations to think beyond traditional staffing sources in building DevOps teams
- Low-code and no-code tools, in particular, let organizations integrate less experienced developers into their DevOps teams, effectively bridging the talent gap
- In one report, 72% of new low-code developers can build apps within the first three months of learning how to use the tools
- Low-code and no-code tools also free up existing developers by reducing the time spent on integrating and administering DevOps toolsets
The global DevOps market has expanded rapidly in recent years, reaching more than $7 billion in 2021. That number will grow to nearly $40 billion, a five-fold increase, by the end of the decade.
At the same time, the talent gap in the DevOps chain is also growing steadily. According to the U.S. Department of Labor, the global shortage of development engineers will reach more than 85 million by 2030. Annually, the demand for DevOps professionals will likely grow more than 20% for the rest of the decade.
These two conflicting trends place software and application companies in an extremely complicated position. On the one hand, they have an opportunity to substantially increase revenue by filling the growing demand for new and improved applications. But the increasing lack of ability to find the right people to build these products limits their ability to take advantage of that opportunity. So, what can companies do to compete effectively in the global market?
One potential solution is to integrate more low-code and no-code tools into the DevOps cycle. These tools provide DevOps teams with numerous benefits and efficiencies, from streamlining the work of existing DevOps professionals to allowing companies to look beyond traditional personnel sources for expanding their teams. Indeed, it is likely that organizations that fail to integrate these tools into the DevOps process will quickly fall behind their competitors.
The rise of DevOps
DevOps is a relatively recent phenomenon, only beginning to make itself known around 2008. But it is a trend that has quickly overtaken the software and application industry.
DevOps arose as a way to streamline the overall software development lifecycle. Before DevOps, the teams involved in the various stages of the lifecycle operated independently in very insulated silos. Communication between teams was often lacking and ineffective when it did occur.
Because one hand never knew what the other was doing, software development was often highly inefficient. Worse yet, the different teams frequently had different goals and objectives, and these objectives were often conflicting. Speed of release vs. functionality vs. quality assurance strained against each other, making the development teams compete with each other rather than working together towards the same goal – a quality product that reaches the end customer as quickly as possible.
DevOps offered a new, collaborative model. While the term DevOps comes from combining development and operations (i.e., deployment), as an overall philosophy, DevOps means much more. Amazon Web Services defines DevOps as:
DevOps is the combination of cultural philosophies, practices, and tools that increases an organization’s ability to deliver applications and services at high velocity: evolving and improving products at a faster pace than organizations using traditional software development and infrastructure management processes.
But DevOps is more than just better communication and integrated teams working towards common goals. Instead, the truly effective DevOps team extends beyond traditional development and deployment. It also tightly integrates monitoring (for example, Java logging), quality assurance, and security to ensure that customers receive the best product possible and one they can trust with their information.
DevOps also demands applying the right tools and workflows to achieve those goals. Indeed, the automation of workflows is one of the most essential practices of DevOps. And well-implemented automation further enhances the communication between parts of the DevOps team.
In the 15 years since organizations began applying DevOps, it has seen rapid adoption with excellent results. According to one recent survey, 61% of IT decision-makers said DevOps practices and methodologies helped them deliver better products to their customers. And 49% of companies relying on DevOps could reduce time to market for their products.
DevOps was not a perfect solution
DevOps was unquestionably a substantial improvement over traditional software development methodologies. In addition to removing communications obstacles throughout the development chain, DevOps provided benefits such as:
- Increased speed of development: Because all parts of the chain are working effectively together, they can resolve issues more quickly.
- Reduced time to market: Improved workflows and automation, including continuous integration (CI) and continuous delivery (CD), allow for more frequent and rapid distribution of products to consumers.
- Enhanced scalability: With many automated and robust testing and production environments in place, teams can more easily scale products to meet new demands.
- Built-in security: Many DevOps teams now employ processes such as policy-as-code that integrate security into the development process rather than having it be an afterthought.
Despite its clear advantages, DevOps was not without its issues. One of the most significant challenges facing organizations transitioning to DevOps was the need to create a new mindset focused on collaboration. Extensive cultural and philosophical shifts inevitably generate anxiety as team members move away from well-known and comfortable workflows.
But the move to DevOps requires more than just a cultural change. It also necessitates learning new governance structures, tools, and workflows. As anyone who has participated in the rollout of a new tool knows, it is never as simple as it sounds, especially when it involves letting go of legacy systems.
DevOps tools themselves compounded the difficulty of the transition, for many different reasons. Siloed development and operations teams typically had separate toolsets and they used them to facilitate different goals and metrics. Finding the right set of tools to bridge these differences can be challenging. And asking both teams to learn a new set of tools raises concerns about morale and the use of time.
All of this makes it doubly important to focus on cultural changes before toolset changes. Tell your development team that they have to take time away from their primary tasks to learn new tools, and more likely than not you will get disgruntled developers. But if you first show them how those new tools will make their lives easier not just now, but well into the future, you will more quickly develop buy-in. Low-code and no-code tools can do just that by allowing citizen developers to take more simple tasks off the developers’ plates, leaving them to focus on higher-end work.
Even with full buy-in, however, new tools can still pose problems. Until teams become comfortable with the new processes and structures, there is a danger of overreliance on tools, many of which seem to have features that can address any problem under the sun. And with the wide assortment of tools available, developers frequently spent more time making their tools work together than actually completing projects. Indeed, developers report spending up to 40% of their time on integration tasks.
Another major hurdle organizations face in today’s workplace is finding the right people to staff their DevOps teams. Although interest in information technology is expanding and more and more young people have a substantial amount of self-taught IT knowledge, the talent gap for developers remains problematic. According to a McKinsey study, 26% of organizations identified IT, mobile, and web design as their business area with the greatest shortage of personnel.
These are just a few of the challenges organizations face when moving to and becoming proficient in the DevOps environment. But organizations quickly discover that the benefits of DevOps are more than worth the time, money, and effort they invest in the change.
The case for integrating low-code and no-code tools in the DevOps cycle
Companies are looking outside the box to fill the talent gap, and one of the most successful approaches currently is upskilling their existing workforce. As a side benefit, upskilling improves employee satisfaction and retention, which is increasingly important as, according to recent surveys, 90% of the workforce reports being unsatisfied with their current work environment.
For DevOps, the starting point for upskilling is to train non-DevOps personnel to become effective members of the DevOps team. And this is where no-code and low-code DevOps tools come in. With no-code and low-code tools, even complete development novices can learn to build websites and applications. If someone has enough computer knowledge to drag-and-drop, they can probably learn no-code tools. And those with a little more computer savvy can put low-code tools to good use.
As their name suggests, no-code and low-code tools facilitate software and application development with minimal need for writing or understanding code. Instead of building code, developers rely on visual, drag-and-drop processes to piece together pre-made functionality. So instead of needing to understand the intricacies of specific programming languages, developers need only have a good feel for the business’s needs, the overall application architecture, and the application’s workflows.
These so-called ‘citizen developers’ fill a glaring need at a much lower cost than competing for the few available experienced developers on the market. And sometimes, they can be the only truly viable option.
While building a stable of citizen developers sounds good in theory, companies may wonder whether they can really gain development benefits from previously unskilled workers. The numbers, however, are impressive. According to studies of companies using low-code tools, 24% of their citizen developers had absolutely no programming experience before taking up low-code application development. Yet 72% of new low-code developers can build apps within the first three months of learning how to use the tools. Is it any wonder that 84% of organizations are now either actively using these tools or putting plans in place to implement them in the near future?
As the workforce gets younger, the likelihood that new employees will have little or no programming experience decreases. Many new employees are coming into the workplace having already built their own websites or blogs, and perhaps even their own e-commerce businesses and applications. And they probably did it using personal low-code and no-code tools like WordPress, Wix, or Square. Businesses should leverage this experience in filling their development needs.
But no-code and low-code tools also benefit more experienced developers and optimize developer time. Rather than spending a large part of their limited work hours on pipelines and integration, they can focus more fully on substantive development and delivery. And because low-code and no-code tools use pre-built and pre-tested modules, there is less need to chase down bugs and rewrite code, further easing the workload of already overburdened developers.
Another key benefit of low-code and no-code tools is that they can help businesses automate and simplify cybersecurity tasks. Many tools have built-in security features that are simple for even the most novice developers to put in place. And IT staff can use low-code and no-code tools to build security “playbooks” for development teams so that everyone is always on the same page when it comes to the critical issue of application and network security.
Both businesses and customers see substantial benefits from citizen developers using low-code and no-code tools. Deployment velocity increases quickly, as much as 17 times according to one study, so businesses can push new and improved products out to their customers more frequently. And customers are getting more and more functionality, along with more stable and reliable products.
While organizations of all sizes can (and should) put low-code and no-code tools into their development toolboxes, it is small and medium enterprises (SMEs) that stand to gain the most benefit. SMEs frequently have few IT staff and limited resources to compete for talent in the increasingly competitive IT labor market. But with low-code and no-code tools, SMEs can use existing staff to effectively fill the development talent gap.
What low-code and no-code tools are available?
The number of no-code and low-code tools is growing almost as rapidly as the DevOps market. And they cover every stage of the software development cycle, from building functionality to testing and quality assurance to security.
Consider Microsoft’s PowerPlatform, which includes the Power Apps, Power BI, and Power Automate products. Microsoft recently expanded the suite to include a new module called Power Pages. This product lets users build high-end business websites without having any coding expertise.
Although Power Pages is geared towards the citizen developer, more experienced developers can take the no-code development tool and optimize it as needed using their own DevOps tools. But with more people in the chain and experienced developers focused on the most critical parts of the delivery cycle, organizations will find themselves delivering better products far more quickly than before.
Low-code and no-code tools can do far more than just build websites. There are also tools geared towards developing internal applications to help employees be more efficient (e.g. Appian, Retool, SalesForce Lightning, Creatio). And some tools allow developers to build cross-platform applications, taking advantage of an ever-increasing demand for mobile applications that can work on any device no matter what the operating system (e.g. Zoho Creator).
Naturally, these are just a few examples. Major providers from Amazon (Honeycode) to IBM (Automation Workstation) to Oracle (APEX) and others also offer low-code and no-code tools for almost any application. It is not a matter of finding low-code and no-code tools; it is only a matter of finding the right ones for your organization.
Conclusion
If you aren’t a DevOps organization already, chances are you soon will be. And you will need as many qualified DevOps team members as you can get your hands on. No-code and low-code DevOps tools are an easy way to build your stable of developers while freeing up your existing developers to focus their time on getting quality products out the door.
MMS • Steef-Jan Wiggers
Article originally posted on InfoQ. Visit InfoQ
Google introduced the public preview of Cloud Workstations during its Cloud Next event, which provides fully-managed and integrated development environments on the Google Cloud Platform.
Brain Dorsey, a developer advocate at Google, explains in a Google Cloud Tech video what Cloud Workstations are exactly:
It is a web application hosted in the cloud console to create and manage container images, which are then used as templates to create development environments that run on a dedicated VM for each developer.
Google Workstation addresses two personas according to the company: developers and administrators. Developers can quickly access a secure, fast, and customizable development environment, while administrators can quickly provision, scale, and secure development environments.
Source: https://cloud.google.com/blog/products/application-development/introducing-cloud-workstations/
Under the hood, Cloud Workstations manage resources for the workstation, such as Compute Engine VMs and persistent disks (PDs). Workstations are contained in and managed by workstation clusters, each with a dedicated controller connected to a VPC in which workstations reside with Private Service Connect. In addition, it is also possible to enable a fully private gateway so that only endpoints inside a private network have access to Cloud Workstations.

Source: https://cloud.google.com/workstations/docs/architecture
The company states it focuses on three core areas with Google Workstations:
- Fast developer onboarding via consistent environments: organizations can set up one or more workstation configurations as their developer teams’ environment templates.
- Customizable development environments, providing developers flexibility with multi-IDE support such as VS Code, IntelliJ IDEA, and Rider. Google also partners with JetBrains. Furthermore, there is support for third-party tools like GitLab and Jenkins, and developers can customize the container images.
- Security controls and policy support, extending the same security policies and mechanisms organizations use for their production services in the cloud to their developer workstations. For example, running workstations on dedicated virtual machines and automatically applying Identity and Access management policies.
Max Golov, a principal technical instructor at MuleSoft, explained in a JetBrains blog post what the partnership with Google brings for developers:
Cloud Workstations provides preconfigured but customizable development environments available anywhere and anytime. With this partnership, Cloud Workstations now has support for the most popular IDEs, such as IntelliJ IDEA, PyCharm, Rider, and many more, allowing users to take advantage of managed and customizable developer environments in Google Cloud in their preferred IDEs.
Alsp next to Google, Microsoft and AWS offer development environments in the cloud. Microsoft offers CodeSpaces and Microsoft Dev Box as coding environments in the cloud. With CodeSpaces, developers can get a VM with VSCode quickly; similarly, with Microsoft Dev Box, they can get an entire preconfigured developer workstation in the cloud. And AWS offers Cloud9, allowing developers a cloud-based integrated development environment (IDE) in a browser to develop, run and debug code.
The question is whether developers will adopt the available cloud-based development environments or cloud-based Integrated Development Environments (IDEs). Corey Quinn, a cloud economist, concludes in his blog post on Cloud IDE adoption:
Unfortunately, the experience of cloud development, while periodically better on a variety of axes, hasn’t been a transformative breakthrough from the developer experience perspective so far. Until that changes, I suspect driving the adoption of cloud-based development environments is going to be an uphill battle.
In addition, Richard Seroter, a director of developer relations and outbound product management at Google Cloud, tweeted:
I’ve used @googlecloud Workstations a bit this week for coding, but not yet sure it’ll be my primary dev environment. It’s got promise!
Lastly, more details are available on the documentation landing page, and while in preview, the specifics on pricing can be found on the pricing page.
Java News Roundup: Payara Platform 6, Spring Updates and CVEs, Asynchronous Stack Trace VM API
MMS • Michael Redlich
Article originally posted on InfoQ. Visit InfoQ

This week’s Java roundup for October 31st, 2022 features news from OpenJDK, JDK 20, JavaFX 20, GZC 20, Spring Framework milestone, point and release candidates, Payara Platform 6, Micronaut 3.7.3, MicroProfile 6.0-RC2, Hibernate ORM point releases, Apache TomEE 9.0-RC1, Apache Camel 3.18.3, GraalVM Native Build Tools 0.9.17, JReleaser 1.3.1, JobRunr 5.3.1, JDKMon 17.0.39 and J-Fall 2022.
OpenJDK
JEP 435, Asynchronous Stack Trace VM API, was promoted from its Draft 8284289 to Candidate status this past week. This HotSpot JEP, proposes to define a well-tested, efficient and reliable API to asynchronously collect stack traces and include information on both Java and native stack frames.
JDK 20
Build 22 of the JDK 20 early-access builds was also made available this past week, featuring updates from Build 21 that include fixes to various issues. Further details on this build may be found in the release notes.
For JDK 20, developers are encouraged to report bugs via the Java Bug Database.
JavaFX 20
Build 6 and Build 5 of the JavaFX 20 early-access builds were made available to the Java community. Designed to work with the JDK 20 early-access builds, JavaFX application developers may build and test their applications with JavaFX 20 on JDK 20.
Generational ZGC
Build 20-genzgc+2-20 of the Generational ZGC early-access builds was also made available to the Java community and is based on an incomplete version of JDK 20.
Spring Framework
On the road to Spring Framework 6.0.0, the third release candidate was made available that delivers 22 bug fixes and improvements that include: support for @RequestPart arguments in the methods defined in the @HttpExchange annotation; introduce the SimpleValueStyler class for use with the ToStringCreator class; and provide AOT support for clients of the HttpServiceProxyFactory class. This is the last release candidate before the planned GA release in November 2022. More details on this release may be found in the release notes.
The second release candidate of Spring Data 2022.0.0, codenamed Turing, was made available featuring numerous bug fixes and a refined integration of observability through Micrometer for the Spring Data MongoDB, Spring Data Redis, and Spring Data for Apache Cassandra modules. All of the modules were also upgraded to their RC2 equivalents. Further details on this release may be found in the release notes.
Versions 5.7.5 and 5.6.9 of Spring Security have been released featuring fixes for: the AuthorizationFilter class incorrectly extending the OncePerRequestFilter class; and incorrect scope mapping. More details on this release may be found in the release notes for version 5.7.5 and version 5.6.9.
On the road to Spring Cloud 2022.0.0, the first release candidate was made available that ships with upgrades to the RC1 equivalents of all of the subprojects except Spring Cloud CLI, Spring Cloud for Cloud Foundry and Spring Cloud Sleuth which were removed from the release train. Further details on this release may be found in the release notes.
The first release candidate of Spring Authorization Server 1.0.0, was made available with new features that include: a requirement in which the @Configuration annotation in used in conjunction with the @EnableWebSecurity annotation; replace the loadContext() method with loadDeferredContext() method defined in the SecurityContextRepository interface; and merge enhancements from the 0.4 release train into main. More details on this release may be found in the release notes.
Similarly, the first release candidate of Spring Authorization Server 0.4.0 was made available featuring improvements to custom endpoints related to the OidcUserInfoEndpointFilter and OidcClientRegistration classes. Further details on this release may be found in the release notes.
On the road to Spring Modulith 0.1, the second milestone release delivers new features such as: the removal of the obsolete spring.factories property in the observability module; and ensuring that test autoconfiguration is ordered first. InfoQ will follow up with a more detailed news story on Spring Modulith that was introduced in late October 2022.
VMware has published three Common Vulnerabilities and Exposures (CVEs) this past week:
- CVE-2022-31691, Remote Code Execution via YAML editors in STS4 extensions for Eclipse and VSCode, a vulnerability reported for Spring Tools, would allow an attacker, under certain conditions, to potentially execute harmful remote code execution from within special YAML syntax.
- CVE-2022-31692, Authorization Rules Can Be Bypassed via Forward or Include Dispatcher Types in Spring Security, a vulnerability reported for Spring Security that affects the
AuthorizationFilterclass. - CVE-2022-31690, Privilege Escalation in spring-security-oauth2-client, a vulnerability also reported for Spring Security, would allow an attacker, under certain conditions, to can modify a request initiated by the the browser to the authorization server which can lead to a privilege escalation on the subsequent approval.
Developers are encouraged to upgrade to Spring Tools 4.16.1 and Spring Security versions 5.7.5 and 5.6.9.
Payara
Payara has released their November 2022 edition of the Payara Platform that introduced Payara Community 6.2022.1 as the first stable release of Payara 6 Community and serves as a compatible implementation for the Jakarta EE 10 Platform, Web Profile and Core Profile. Payara 6 will now serve as the updated, current version of Payara Platform Community. More details on this release may be found in the release notes.
Payara Community 5.2022.4 is the second-to-last release in Payara 5 Community. Further details on this release may be found in the release notes.
Payara Enterprise 5.45.0 delivers five bug fixes, one security fix and two improvements. More details on this release may be found in the release notes.
All these new versions address a zero-day vulnerability in which attackers can explore the contents of the WEB-INF and META-INF folders if an application is deployed to the root context.
Micronaut
The Micronaut Foundation has released Micronaut 3.7.3 featuring bug fixes and patch releases of Micronaut Test Resources, Micronaut Servlet, Micronaut Security, Micronaut Kafka, and Micronaut Redis. There were also dependency upgrades to SnakeYAML 1.33 and Netty 4.1.84. Further details on this release may be found in the release notes.
MicroProfile
On the road to MicroProfile 6.0, the MicroProfile Working Group has provided the second release candidate of MicroProfile 6.0 that delivers updates to all the specifications. It is also important to note that the MicroProfile OpenTracing specification has been replaced with the new MicroProfile Telemetry specification. The anticipated GA release of MicroProfile 6.0 is expected by late-November/early-December 2022.
Hibernate
A particular pattern of code that triggers a severe performance penalty on large multi-core servers has been identified by the Red Hat performance team. Many libraries, including Hibernate ORM, have been affected. The release of Hibernate ORM 6.1.5.Final ships with some patches as an initial step in mitigating this issue. The Hibernate team claims that early tests are promising.
Hibernate ORM 5.6.13.Final has been released featuring bug fixes and enhancements such as the access modifier of the getOp() method defined in the SimpleExpression class was changed from protected to public to assist developers in migrating from the legacy Criteria API. There were also dependency upgrades to ByteBuddy 1.12.18 and Byteman 4.0.20.
Shortly after the release of Hibernate ORM 5.6.13, a critical regression was discovered in which a ClasscastException was thrown via a check for an implementation of the Managed interface rather than an implementation of the ManagedEntity interface. Hibernate ORM 5.6.14.Final has been released to address this issue.
Apache Software Foundation
The release of Apache TomEE 9.0.0-RC1 ships with full compatibility with MicroProfile 5.0 and dependency upgrades such as: Eclipse Mojarra 3.0.2, HSQLDB 2.7.1, Hibernate 6.1.4.Final, Log4J2 2.18.0, Tomcat 10.0.27 and Jackson 2.13.4. More details on this release may be found in the release notes.
Apache Camel 3.18.3 has been released featuring 52 bug fixes, improvements and dependency upgrades that include: Spring Boot 2.7.5, camel-hbase 2.5.0 and kamelets 0.9.0 in the camel-jbang module. Further details on this release may be found in the release notes.
GraalVM Native Build Tools
On the road to version 1.0, Oracle Labs has released version 0.9.17 of Native Build Tools, a GraalVM project consisting of plugins for interoperability with GraalVM Native Image. This latest release provides improvements such as: a new requiredVersion property to check for a minimal version of GraalVM; and make the GraalVM installation check lazy. More details on this release may be found in the changelog.
JReleaser
Version 1.3.1 of JReleaser, a Java utility that streamlines creating project releases, has been released featuring a fix of the Nexus2 query status after close/release/drop operations were not reported if those remote operations failed. Further details on this release may be found in the release notes.
JobRunr
JobRunr 5.3.1 has been released featuring fixes for: JobRunr does not fail on null values for an instance of the MDC class; DB Migration is applied multiple times if the time to execute the first run takes an excessive amount of time; and inheritance in background jobs not always working.
JDKMon
Version 17.0.39 of JDKMon, a tool that monitors and updates installed JDKs, has been made available this past week. Created by Gerrit Grunwald, principal engineer at Azul, this new version ships with a CVE detection tool for builds of GraalVM in which the CVEs are sorted by severity.
J-Fall Conference
J-Fall 2022, sponsored by the Nederlandse Java User Group (NLJUG), was held at the Pathé Ede in Ede, Netherlands this past week featuring speakers from the Java community who presented keynotes, technical sessions, workshops and hands-on labs.
Kubernetes 1.24 Released with Network Policy Status, Contextual Logging, and Subresource Support
MMS • Mostafa Radwan
Article originally posted on InfoQ. Visit InfoQ

The Cloud Native Computing Foundation (CNCF) released Kubernetes 1.24 in May by the name Stargazer. The release has new features such as Network Policy Status, Contextual Logging, and signing release artifacts, generally available or stable features such as PodOverhead, CSI volume expansion, and CSR duration, beta features such as OpenAPI v3, gRPC probes, volume populator, and deprecated features such as DynamicKubeletConfig. In version 1.24, dockershim is removed.
In the new release,kubectl, the command-line tool to run commands against clusters, includes a new subresource flag to fetch and update subresources. The new subcommand makes it easier to update subresources instead of using curl commands.
Contextual logging is introduced to make log output more useful so that libraries are passed a logger instance by their caller and use that for logging instead of accessing a global logger.
To increase supply chain security, container images pertaining release artifacts can now be signed and verified using cosign, one of signstore’s tools to sign, verify, and protect software.
In version 1.24, a status subresource has been added to network policies to make it easier to troubleshoot network-related issues since network policies are implemented differently by the different CNIs.
OpenAPI v3 support moved to beta in version 1.24 and it’s turned on by default. Such a feature allows the kube-apiserver, the server that validates and configures data for the API objects which include pods, services,…etc, to serve objects in OpenAPI v3 format.
In addition, mixed protocols in services with the type LoadBalancer are turned on by default in beta. This allows a service of type LoadBalancer to serve different protocols (i.e: TCP and UDP) on the same port.
Graceful node shutdown was first introduced in version 1.21 and now it’s in beta. Such a feature allows distinction between the termination of regular pods and critical pods running on the node and provides pods with extra time to stop.
CSI volume expansion became generally available in this release and enabled by default. This feature can dynamically resize persistent volumes whenever the underlying CSI driver supports volume expansion.
Also, PodOverhead became stable in this release and enabled by default. This allows Kubernetes when scheduling a pod to account for the pod infrastructure on top of the container requests and limits. A Runtime class that defines the overhead field is required to utilize such a feature.
Storage capacity tracking moved to stable in version 1.24 allowing the Kubernetes scheduler to make sure there’s enough capacity on a node’s associated storage before placing a pod. That way, it minimizes multiple scheduling attempts by filtering out nodes that do not have enough storage.
Kubernetes is an open-source production-grade orchestration system for deploying, scaling, and managing application containers.
According to the release notes, Kubernetes version 1.24 has 46 enhancements including 13 new, 13 becoming generally available or stable, and 15 moving to beta. In addition, six features have been deprecated.
CNCF held a webinar on May 24, 2022, to review the major features and answer questions.
Amazon EC2 Introduces Replace Root Volume to Patch Guest Operating System and Applications
MMS • Renato Losio
Article originally posted on InfoQ. Visit InfoQ

AWS recently introduced the ability to replace the root volume of EC2 instances using an updated AMI without stopping them. The Replace Root Volume helps patch the guest operating system and applications but still triggers a reboot of the instance.
The Replace Root Volume option allows developers to patch software quickly without having to perform instance store data backups or replication. Changing the AMI of a running instance will update applications and the operating system but will retain the instance store data, networking, and IAM configuration. An improvement on replacing root volumes using a snapshot, the new option can help developers with stateful workloads, simplifying the operating system’s patching and improving the deployment’s security.
Frank Fioretti, principal infrastructure architect at Huron Consulting Group, tweets:
This seems more like orchestration/automation than anything new really (…) For those using an Instance Store I can see the benefit in the event they want to swap out their root volume and maintain the instance store data.
One option of the new API is to restore a root volume to its launch state, with the replacement volume automatically restored from the snapshot that was used to create the initial volume during the launch. The replacement volume gets the same type, size, and delete on termination attributes as the original root volume. Jason Axley, principal security engineer at Amazon, tweets:
This makes using D.I.E. (Distributed Immutable Ephemeral) paradigm for cloud security way easier for legacy EC2: replace root volume by reverting to launch state.
According to the documentation, the EC2 remains on the same physical host, retaining its public and private IP addresses and DNS name. All network interfaces remain associated with the instance and all pending network traffic is flushed when the instance becomes available.
Corey Quinn, cloud economist at The Duckbill Group, comments in his newsletter:
Okay, this is awesome for a number of use cases. Sadly, it requires the instance to reboot quickly, but other than that it’s way more streamlined. Some people are going to hate this because it’s treating an instance as a pet instead of cattle, but… well, my development instance is a pet just as your laptop probably is to you.
A successful replacement task transitions through the following three states: pending, when the replacement volume is being created, in-progress, when the original volume is being detached and the replacement volume attached, and succeeded when the process completes and the instance is again available.
Replacing a root volume using an AMI will not change the encryption status of the root volume. If the AMI has multiple block device mappings, only the root volume of the AMI is used and the other volumes are ignored. If the instance supports the Nitro Trusted Platform Module (NitroTPM), the NitroTPM data for the instance is reset and new keys are generated.
The Replace Root Volume API is available in all AWS regions using the console, CLI, or SDKs. If performed using the AWS console, the new functionality is available in the new console only.
MMS • Sergio De Simone
Article originally posted on InfoQ. Visit InfoQ

In a rather detailed article, Slack engineers Ahmed Eid and Arpita Patel provided an interesting peek into the processes they adopted along the years to improve developer experience in a number of distinct areas and the tools they used to that aim.
Developer experience at Slack is catered for by a dedicated team of eight people, which formed to provide the answer to growing costs as the organization and its development team grew. Among the areas of the development process that caused the most cost, Slack engineers focused on merge conflicts, long-running CI jobs, flaky tests, and CI infrastructure failures.
While developers can learn to resolve some of these issues, the time spent and the cost incurred is not justifiable as the team grows. Having a dedicated team that can focus on these problem areas and identifying ways to make the developer teams more efficient will ensure that developers can maintain an intense product focus.
Estimated at $2,400,000 yearly cost per 100 developers, merge conflicts were the single most expensive pain point. This resulted out of Xcode project merge conflicts, concurrent merges to main, and longer pull request review process.
Xcode project are notoriously hard to merge without incurring in multiple conflicts. To address this problem, Slack engineers used Xcodegen to generate .xcodeproj files from a YAML file, a much more forbearing format.
Multiple concurrent merges to main bring an increased risk of merge conflicts, halting the merging of additional PRs until the conflict is resolved. For this, Slack adopted Aviator to queue all PRs and process them one by one. Instead of merging a PR into main directly, Aviator attempts to merge main into a developer branch. It that step breaks main, the PR is rejected and the author notified.
Finally, to speed up the pull request lifecycle, Slack engineers found it useful to introduce timed alerts for PR assignments, comments, approvals, and direct messages for successful builds including the option to merge the PR without leaving Slack. To accomplish all of this, they created their own GitHub bot, called MergeBot.
Mergebot has helped shorten the pull request review process and keep developers in flow. This is yet another example of how saving just five minutes of developer time saved ~$240,000 for a 100-developer team in a year.
Luckily, GitHub supports a similar feature, called scheduled reminder, albeit it does not provide one-click merge from the message itself.
Improving the PR/merge process was not the only action taken at Slack to improve dev experience. Another area which incurred high costs was testing and failures in their CI infrastructure. On the first count, the solution was parallel test execution along with a strategy to only run the tests strictly required for a given PR based on the PR diff. On the second count, BuildKite proved effective to increase CI-infrastructure reliability.
According to Slack, improving developer experience both made developers happier and reduced the overall development costs. If you are interested in the full detail about how Slack achieved that, do not miss the original article.
MMS • Rafael de Elvira Tellez
Article originally posted on InfoQ. Visit InfoQ

Transcript
Tellez: In this presentation, we are going to talk about Slack’s DNSSEC rollout and a very interesting outage that we had on September 30th last year. My name is Rafael de Elvira. I’m a senior software engineer on the traffic team at Slack. Our team looks after ingress load balancing, TLS, DNS, CDNs, and DDoS protection at Slack, among other things.
What’s DNSSEC?
What is DNSSEC? DNSSEC is a suite of extensions intended for securing data exchanged by the DNS protocol. This protocol provides cryptographic authentication of data, authenticate the denial of existence, and data integrity, but not availability or confidentiality. These are the record and key types used by DNSSEC, which I will be referencing later on. The first one is the DS record. This is the delegation signer. It’s used to secure delegations between nameservers. We also reference to this record as the chain of trust. Then we have the DNS key record, which holds the public key that resolvers can use to verify the DNSSEC signatures in the RRSIG records. These RRSIG records hold the DNSSEC signature for record set. Resolvers can verify the signature with a public key stored in the DNS key record that we just mentioned. Then we have NSEC and NSEC3 records. This can be used by resolvers to verify the nonexistence of a record name and type. Then in terms of keys, we have the Zone Signing Key, which is the private portion of the key. This key just digitally signs each record set in the zone while the public portion DNS key verifies the signature itself. Then the Key Signing Key will sign the public key exclusively, which is the DNS key, creating an RRSIG record for it.
Here’s a successful DNS record request sequence, where the user will make a request to the recursive resolver. Then the recursive resolver will attempt to track down the DNS record that the user just requested. It does this by making a series of requests until it reaches the authoritative DNS nameserver for the requested record, which is like the common use case. This is a very basic interpretation of a DNS record request. Then the sequence is the same one. The resolver does DNSSEC validation. The only difference is that the additional records requested are returned to perform this validation. Let’s keep in mind that DNSSEC only validates the DNS responses received up to the recursive resolver. It just ensures that the request, like it hasn’t been tampered with in transit, and is legitimately what the authoritative nameserver has. Bad actors can still man in the middle between the recursive resolver and the end user.
The DNSSEC Journey at Slack
Now that we’ve briefly touched base on DNSSEC, let’s go through our DNSSEC journey at Slack. Back in May last year, we started off by doing a proof of concept, where we replicated most of our DNS use cases on a controlled and isolated environment. In this environment, we carried multiple tests and gained knowledge on how to operate DNSSEC. Once our proof of concept was successfully completed, we worked on an internal RFC that outlined all the necessary work to enable DNSSEC signing on all Slack domains. Then prior to starting the work to enable DNSSEC signing on any of these domains, we spent significant time simplifying our DNS setup and making some necessary zone changes in preparation for DNSSEC.
Once we deemed our zones to be ready for DNSSEC, we started with the actual rollout plan. By design, DNSSEC can only be enabled on a per domain basis, making it impossible to enable DNSSEC on a per subdomain or subzone basis. This design choice significantly increases the risk of DNSSEC rollouts. To overcome this, we categorized all our domains by the risk basically. We have low, medium, and high, in this way in the case of failed attempt, or like any bugs in the early stages, we would only impact domains that are used for things like monitoring or other non-critical or less impactful Slack features. For each of these domains, we follow the same extensive testing and validation steps, making sure that all these domains were still resolving correctly after DNSSEC signing was enabled.
Third Time’s the Outage
At this point, you must be thinking, yes, but how did it all go wrong? Slack.com was the last domain on our DNSSEC rollout. Prior to slack.com, we rolled out DNSSEC to all other Slack public domains successfully, with no internal or customer impact. Obviously, slack.com had to be different. In this section, we’re going to cover the three times we failed to roll out DNSSEC to slack.com. First, on September 7th, last year, we did our first attempt to enable DNSSEC signing on slack.com. However, prior to publishing the slack.com DS record at the DNS register, which is the last step of a DNSSEC rollout, a large ISP in the U.S. had an outage, and many of our customers reported being unable to access Slack as a result. Early in that incident, and before we were even aware of this ISP issue, we decided to roll back the slack.com zone changes as a precaution.
One day later, on September 7th, we enabled DNSSEC signing on slack.com following the same procedure as on the previous attempt. Again, prior to publishing the DS record, our customer experience team noticed a small number of users reporting DNS resolution problems. We started investigating and we realized most of the affected users were accessing Slack through a VPN provider. Once again, we decided to roll back signing in slack.com zones as a precaution. Then after further investigation, it turned out that some resolvers become more strict when DNSSEC signing is enabled as the authoritative nameservers, even before the DS records are published to the .com nameservers in this case. This strict DNS spec enforcement will reject the CNAME record at the apex of a zone, included the apex of a subzone, which was our case. This was the reason that customers using VPN providers were disproportionately affected as many VPN providers use resolvers with this behavior. To overcome this problem, all our sub-delegated zones were updated to alias records rather than CNAMEs.
Then, after migrating all the CNAMEs at the apex of subzones, we were ready for another attempt. On September 30th, and after careful planning, we made our third attempt to enable DNSSEC signing on slack.com. We started off by first enabling signing on the authoritative nameservers and the delegated subzones as the last two changes. We left a soak time prior to publishing the DS record at the register as we had some issues on the previous two attempts. Then after a 3-hour soak time and successful validations, we were pretty confident to publish that slack.com DS record at the register. This basically instructed resolvers to start validating DNS requests for slack.com. At this point, we had fully enabled DNSSEC signing for slack.com.
Everything looked great for a while on our tests, our external probes, our monitoring were looking good, and we were so happy to have completed the last domain on our DNSSEC rollout. Then after a little while, things started to look a bit less idyllic. Our customer experience team again, started getting reports from users seeing DNS resolution errors in their Slack clients. To give you some context, Slack applications are based on Chromium, and they integrate away to export a NetLog capture. This NetLog capture is an event logging mechanism for Chrome’s network stack to help debug problems and analyze performance. NetLogs are extensively used at Slack. On the left, you will find the DNS configuration of a client available inside the NetLog capture. On the right, you will see an attempt to resolve app.slack.com with all the relevant information. During our initial investigation, all the reports were caused by NODATA or empty DNS responses from some DNS recursive resolvers. Most of which were from a large customer using a private corporate resolver and from Google public resolver, so that’s Quad8. We were both surprised and confused by this as Google DNS failing to resolve slack.com should mean a much larger impact than our monitoring and customer reports indicated.
Given the data we had at the time, we decided to roll back our changes for slack.com. Then we attempted to do so by pulling the DS record from the DNS register effectively removing the slack.com DS record at the .com zone to basically stop the bleeding, so we could lay our focus on the NODATA DNS responses reported by the customers. After nearly an hour, there were no signs of improvement and the error rates remained stable. Our traffic team was confident that reverting the DS record at the register was sufficient to eventually mitigate the DNS resolution problems. As things were not getting any better, and given the severity of the incident, we decided to roll back one step further. This was a bad idea. We rolled back DNSSEC signing in our slack.com authoritative and delegated zones, wanting to recover our DNS configuration to the last previous healthy state, allowing us to completely rule out DNSSEC as a problem during the incident. We had this false sense of trust in running back the zone signing changes due to the previous two attempts, where we had done this successfully, with the slight difference of publishing the DS record at the register this time. As soon as the rollback was pushed out, things got much worse.
This is an example DNS resolution alert that paged our traffic team. That was me that day. It basically said that slack.com was failing to resolve for multiple resolvers and probes around the world. This is not a page you want to get. Our understanding at the time, and what we expected was that the DS records at the .com zone were never cached, so pulling it from the register would cause resolvers to immediately stop performing DNS validation. Then this assumption turned out to be somewhat untrue as the .com zone will ask resolvers to cache the slack.com DS record for 24 hours by default. When you stop signing the authoritative zone, it’s a high risk operation unless the DS record is not published anymore. However, the assumption of no cache DS records at the .com zone made us think we were in the same state as the previous two rollbacks, having the same end result. However, unlike our previous attempts, this time resolvers had cached the DS record for up to 24 hours once the rollback was completed. At this point, all validating resolvers that had recently cached this DS record started returning serve fails for slack.com lookups.
We quickly realized the mistake we had just made, and we started contacting major ISPs and operators that were on public DNS resolvers, asking them to flush all the cache records for slack.com. Additionally, we practically flushed caches for resolvers that offer a public site like Google Quad8, or Cloudflare Quad1. As resolvers flushed their caches, we slowly saw signs of improvement on our internal monitoring. Slack clients send their telemetry to a different domain called Slack B. Thanks to this isolation, we were still able to receive client metrics that helped us quantify the impact of this outage. Ironically, Slack B had DNSSEC enabled successfully prior to this incident.
Throughout the incident, we considered resigning the slack.com zone without publishing again the DS record at the .com zone, as restoring would slightly improve the situation for some users, but it wouldn’t have solved the issue with all the users that were initially getting these NODATA responses after signing was enabled. For us to restore signing, we would have had to recover the key signing key that had been deleted when we rolled back the changes to the slack.com zone. In Route 53, the key signing key is managed by AWS KMS key. KMS is an AWS service to store key security basically. This KMS key was recoverable as per our configuration, meaning that the key signing key would be the same. We were uncertain if the zone signing key would have been the same or different, as the zone signing key is fully managed by AWS and we have no visibility into it.
After the incident, Amazon’s Route 53 team confirmed that the zone signing key will indeed have been different, as when re-enabling signing on the zone, the zone signing key will be generated with a new key pair, meaning that all DNSSEC validating resolvers would have continued failing to validate at least until the DNS key TTL expired. During the incident, we decided not to restore signing due to lack of confidence. We now know it wouldn’t have helped. At this point and some hours into the incident we were in a situation where Slack was resolving correctly for the vast majority of customers, but a long tail of users of smaller DNS resolvers which had not flushed the slack.com DS records were still impacted. Then as public resolvers caches were flushed and the 24 hour TTL on slack.com expired, the error rates went back to normal. At this point, all we had left was a mystery to solve.
Chasing the Root Cause
Once the impact to Slack customers was mitigated, we aimed to determine the root cause of this outage. Prior to attempting DNSSEC on slack.com, our team had successfully enabled DNSSEC on all our Slack public domains. We had a lot of questions. How was slack.com different? Why did we not see any issues with any of their previous domains? Why did this only impact some customer, or like corporate internal DNS resolvers and some of Google’s public DNS lookups, but not all of it?
To understand what happened, we replicated the Route steps using a test zone setup, which was set up identical to slack.com, using a resolver that we knew had problems during the outage. Surprisingly, all our attempts to reproduce this behavior were unsuccessful. At this point, we were like, let’s go back to the NetLogs that we have received from the customers during the outage and see, what can we get from them. Here’s where we found an extremely interesting clue. Clients were able to resolve slack.com successfully during the incident, but they failed to resolve app.slack.com. Why? This indicated that there was likely a problem with the star.slack.com wildcard record, to which we thought, none of the other zones where we’ve done DNSSEC in the past contained a wildcard record, this is the only one. This was clearly an oversight that we did not test the domain with a wildcard record before attempting it in slack.com.
We collected evidence, and we reached out to the Amazon Route 53 team who jumped on a call with us to figure it out. After walking them through the evidence we had, they quickly correlated this behavior to an issue with NSEC responses that Route 53 generated on wildcard records. When a request is made to a DNSSEC enabled domain for a wildcard record which type does not exist, for example, a AAAA record type. The answer is a signed NSEC record confirming that while the domain name exists, the requested type does not. This signed NSEC response can include some additional information, specifically designed to not break wildcard records, but Route 53 was not returning this additional information.
Then what this means is that when a client does a AAAA lookup for app.slack.com, it would correctly return a signed NSEC saying there is no record for that. This is correct, since we don’t publish any AAAA records in this zone. The expected client behavior then is to fall back to requesting an A record. Since Route 53 isn’t returning that extra information, some public resolvers take that response to mean no other record type exist for this record name, so there’s no need to query for an A record again. This NSEC response comes with a TTL, so it will be cached by resolvers, meaning that impacted DNS resolvers were being unintentionally cache poisoned by clients innocently checking for the existence of AAAA records. Luckily, this cache poisoning would only affect the regional cache, which means only users of an impacted regional cache for one of these resolvers would be affected while other regional caches would not. Once we knew this, and we were able to reproduce this issue against our test zone using Google DNS, but not using Cloudflare DNS, for example. We had a second mystery, which was whether or not one of these major public resolvers was out of spec. We went back to reading the DNS RFCs, and we found out it is protocol compliant we use a cached NSEC record to decide our subsequent response. This is called aggressive NSEC. It’s an optional spec that Google DNS implements. In the end, we concluded that both options were acceptable and the only real way to avoid being in this ambiguous situation is for your authoritative nameserver to correctly return existing record types in the NSEC bitmap.
Our mystery was finally solved, and after a bit of time, the Route 53 team fixed this NSEC type bug described above, together with a fix to allow recovering the same zone singing key if you re-enable signing on a zone within the timeframe. We’re very sorry for the impact this outage had on everyone who uses Slack, and we hope that this talk will shed some light on some of the corner cases with DNSSEC, and maybe this will prevent someone else from having a similar issue in the future.
The Final Attempt
There’s more. Once all the postings and work was completed, where we did things like writing an extensive internal review, figuring out incident remediation items, and we worked closely with Route 53 to fix the bug. We spent some time writing a blog post for our engineering blog, where we explained what happened and some of the key takeaways for us from the incident. After all of this, we started planning for the next attempt. We collected all the learnings from the incident, and we started to figure out what had to happen for us to be comfortable doing another attempt, hopefully one last attempt. This is the last status update in the DNSSEC project channel a few days prior to attempt number four, where we finally enabled DNSSEC on slack.com, with no issues whatsoever. I think this list is quite interesting, as we had various focuses. The first one is documentation and testing. We focused a lot on runbooks, improving the runbooks and making sure they were really solid and they contained all the necessary steps for doing all operations related to DNSSEC. We tested zone signing key restore, after the Route 53 feature. Then we tested the key signing key restore, testing that the DNS key RRSIG is the same after re-enabling or restoring this key.
Then the second focus is observability. We did some work to have additional logging of DNS traffic, so we have interesting metrics like top resolvers, traffic patterns when resolvers start asking for DS records serve fails and stuff like that. We did a dashboard with all this DNS traffic and other Slack key metrics, and we keep this dashboard in the monitor refreshing constantly during the rollout. In these additional metrics, there are nothing other than Route 53 logs, so we basically enable the logs on the zone, and we ingest them into our logs pipeline. We make sure that we can keep track of all these metrics to use as part of the rollout.
Then the third focus is comms. We communicated heavily, both internally at Slack and within Salesforce. We communicated with the Route 53 team vastly, and then with the NANOG and the DNS-OARC groups. The NANOG is the North American Network Operators Group, and the DNS-OARC is a community of DNS operators, both of which contain a lot of like network and DNS operators that can transmit, what are they seeing in their networks, in their resolvers to us? We can reach out to them if we need help, in case of another failed attempt. Then the fourth, but not least, is the rollout plan. We agreed on running the rollout during the lowest traffic time in the week. We did some zone changes before enabling signing to reduce the impact time if things go wrong. Then the last one is basically stick to the runbook during the rollout, like just follow the runbook precisely and stick to that.
The fourth attempt was the charm. Today slack.com has had DNSSEC enabled for two months without any issues. This is a great accomplishment for us.
Questions and Answers
Bangser: You mentioned that you spent a fairly significant time doing what I’ve heard described as pre-factory, doing some work before you go into the change in order to make the architecture more friendly to the change. How did you go about scoping this out and estimating this and advocating for it within the organization, because I find people can often struggle to do that.
Tellez: Most of the work is simplifying our DNS zones, like we work with two vendors at the moment, one of which is Route 53, and the other one is NS1. We had this very convoluted environment where we’ve delegated many zones to NS1, because we really liked some of the features that they offer for some specific Slack features. The thing is, we had many other domains, which were just delegated to NS1, and were no longer using these features. Then we had like this very complicated setup, where we had to keep another link in the chain of trust to have a successful DNSSEC setup. What we did is, we went and did an analysis on all the zones we look after, and we outlined how many of them need to be migrated back to their authoritative Route 53. We just built up a plan, we factored that in into the RFC document, and we just got signoff from key stakeholders saying, yes, this is what we should do. It’s actually extra work, but that extra work will save us time in the future, both in operating DNSSEC and possible outages coming out of like human error, having to do with not establishing that chain of trust well, and things like that. The less delegations we have in this case, it’s the best for us.
Bangser: It sounds like it also gave you a little bit more alignment over your zones so that your rollout could be a bit simpler, you could reuse some of the same across the zones, which is good.
Tellez: Yes, exactly. We had some interesting things happening there. Some of the migrations required us to build up temporary zones and shifting traffic between zones, because we had to rebuild some of them in NS1, specifically. We couldn’t just create the zone, have the traffic shifting there, because it takes a while to populate all the records. We had to create empty temporary zones that were not getting any traffic, then shift traffic there. Then perform the operations that we were doing on that zone, specifically, and then shift traffic back. It was a fair bit of work that we had to do prior to actually getting hands-on with DNSSEC in prod.
Bangser: I think that this in-prod theme that we’re talking about across the whole track, and that you touched on is really interesting, and where that phrase that everyone’s testing in production, just some people are paying attention to the results or focusing on that. This rollout to slack.com is a great example of that. You’d done all the pre-work. You’d done all the testing that you could have thought of. You weren’t skimping and assuming you could monitor for results. Yet it was still a surprise when you ran into things. You mentioned that before you went through, I think it was the fourth and final successful rollout that you added some more monitoring to it, some more logging, some more observability and telemetry. Are these things that were short-term adds, or do you still find yourself using that data, and finding yourself expanding in other ways?
Tellez: They’re like more long-term things. Like for some zones, we figured, it’s not always useful to have the logs enabled all the time. For critical zones to us, I think it’s really important that we have that visibility always available. In the example of Route 53 logs, those are really important for us, and we have built dashboards around them. Whenever we need to do any DNS operations, or we have any network type outage, we can quickly pinpoint if there’s a specific resolver that’s having their traffic dip. Or we can even see a map of traffic divided by the client EDNS subnet, so we know where our customers are and which point of presence they’re reaching, and all this kind of thing. It’s not only figuring out the errors on the requests. It’s also additional data that helps us figure out when’s the best time to do certain things or where should we invest in a new POP if we want to do that, and those kind of things.
Bangser: I think for a lot of us, I’ve been across the infra side and the software service side as well. I think for a lot of people, each side is a bit of a black box. It’s like, how do you debug DNS? What does observability even look like when you’re talking about something that is as distributed as DNS, and has many dependencies? Do you feel like there’s any learnings that you’ve either brought in from the software observability experiences, if you have any, into trying to bring observability to DNS? Or vice versa, your experiences in this infrastructure and DNS side of things that you feel like could enable software service owners to get even more insight into their services?
Tellez: I think it’s more of the former. I was able to bring more software type of doing things into the DNS world in this case. Because typically, operating DNS is just like doing changes in the zone, rather than actively monitoring the traffic and all those things. Thanks to this way of thinking, like the software development lifecycle, and all the metrics that we have on our clients, or the Slack clients, we were able to get really valuable data. Like this Slack B thing that we were mentioning, that was critical to us, because we actually get the telemetry from the clients into what’s going on. The fact that it goes to a separate domain, it’s perfect, because any impact to our primary domains, like our production domains, is not affecting this Slack B domain where we get the telemetry. We can rely on this separate ingestion pipeline to make decisions while you’re in an incident. Some of the metrics that we were seeing during this incident, in particular, were like everything was stable, and everything looked good. It’s because the customers that were reaching us were fine, but the ones that were not fine were not even reaching us. We didn’t have that observability at the level of Slack’s infrastructure, but we had it on this Slack B portion of the observability spec.
Bangser: I think there’s always those realizations at the wrong time when your status page is being hosted by the same infrastructure that your app is, and all of a sudden, you can’t even report your status being down. That’s always a bit of a facepalm moment that seems so obvious in retrospect, but doesn’t always get identified upfront.
See more presentations with transcripts
MMS • Andrzej Grzesik
Article originally posted on InfoQ. Visit InfoQ

Transcript
Grzesik: My name is Andrzej Grzesik. I’m a principal backend engineer at Revolut. I’m proud to be a Java champion, proud to be a JavaOne Rockstar, and have been involved with various software initiatives around the world.
Java Release Cadence
During Java 17 release activities, Mark Reinhold has blogged on his blog that he would propose to ship an LTS release every two years. That’s a major change. The upgrade path I propose is 8 to 11 to 16 to 17. Soon, it is going to be 11 to 17. There are no new features being discussed in depth in this talk. Which version of Java are you on? What did we get? We got a viewpoint. Now let’s ask the Twitter community or use some other existing Twitter polls, we can see that there is a progression towards the newer Java versions, which is also awesome and expected. Then this happens, which is blog posts by New Relic, summarizing their experience about Java versions being used in production, and that those are slightly different stories slightly more oriented towards Java 8. Then we have this which is a JVM ecosystem report by Snyk, which suggests 11, and 8, and 15 are all very popular versions. The bottom line is there is no single answer. There are many viewpoints. I don’t think there is one person in the world that has a unified objective view on which Java actually is how popular. I don’t think there is even a point in getting that answer. There is plenty and people are using different ones because everybody migrates at their own pace. That’s normal. That’s what we expect, and that’s ok.
Which Vendor?
There is another dimension to this question, which is vendors. Vendors are a thing, or the choice of a vendor is real. As you can see from Snyk’s report being used here, AdoptOpenJDK seems to be the most popular JDK running in production among the people who responded to Snyk’s call for questions. Obviously, there must be other organizations who didn’t participate, which means there is definitely multiple vendors and multiple JDKs by different vendors available. The difference between them is primarily in support, maybe in which organization you work in, maybe in which versions are being supported. Apart from that, they are all Java. The software that runs should just run. They might have some magical superpowers when it comes to GC for example, or maybe they are running a version not supported by somebody else.
Java Upgrade
Let’s talk about Java upgrade, and let’s talk about the Java upgrade first in the context of a financial organization that did it in 2019. We have to have this awesome vehicle, and with its power, we’ll go back in time. How did we deploy Java at Revolut, when the migration was taking place? We were using CoreOS, which is now obsolete, end-of-life’d. It doesn’t exist anymore. One VM, one Docker container with the production workload, and apart from that, some other containers on the same VM. This is how we rolled. This is now already pre-historic. T-Rex is happy to know all of it.
Why Upgrade?
Why did we even decide to upgrade? It’s within the motto of the company to get things done. That’s one. Another aspect is we have to keep moving forward, and we have to keep things working, which means if there are any bugs in the older versions that we would get fixes for later. This is not something that we would be very comfortable going to as a situation. Yes, let’s do it. We would have to upgrade anyway, which means why wait, if you can do it earlier and be done with it. Another aspect is we wanted to have the new features. We wanted to have access to the fixes. Another aspect is, new Java, that means new features are available. That means curious people will want to work with us, which is an awesome thing if that gives us an edge at hiring. Why not use it?
There is another reason, JSON. JSON, and especially Java 8 to 9 transition. This happened. It used to be that strings were Char array based, now strings are byte array based. The consequence of that change if your string is based on a standard ASCII Char set, then it’s going to take half the space for storing the characters within a string, which means reducing memory pressure, which for a lot of the JSON out there is going to make a difference. That makes JSON happy. Upgrade and Ops and obviously, in our context, a startup working in the cloud, trying to be modern. We have a lot of Ops, we have a lot of automation, and developers take care of many of the infrastructure tasks, which means they upgraded their own applications. We didn’t have to throw things over the wall. There were no hot potatoes being passed around. For us, DevOps work on specialized projects.
Java 11
For us, 11 upgrade, or 2.11 upgrade was specifically this one. We did it to all applications. When we were done, everything in Revolut was running Java 11. Somebody could ask, why didn’t we upgrade to 9 or 10? Because they were no longer maintained, and we actually wanted to migrate to 9 and 10 but we couldn’t because of library compatibility. Then when we finally could, 11 was the current thing and 12 wasn’t available. That’s the story. We also had to make one more change, which is go away from Oracle JDK towards OpenJDK. Why? Because Oracle JDK didn’t allow to redistribute and make your own images without a license and to generally run in production without a license. This is something that changed in Java 17. Java 11 or any other Java that you want to upgrade to, you have two options. You can do it with the whole house and the kitchen sink and run and compile and do everything on the new one, or compile on the old one, run on the new one.
We did the, everything migration, runtime and tool chain for all the applications. Sometimes, this is not really the best option out there. Sometimes you will be running new Java in production, but you will be using the old tool chain. When would that be the thing? If you were running some of those, as of March 2020. Why? Because they were not compatible with anything newer. That’s the thing, community and all of the ecosystem of libraries and tools and solutions takes time to upgrade. That was a perfectly valid reason to have this dual mode of running. Now we’re in a much better state. This is a picture painted to me by the official websites or bug trackers of various projects. What you can see here is that if you are in the Hadoop or Cassandra ecosystem, you might have to wait for running Java 17 across the board, but otherwise you should be good. This is a major difference compared to, for example, September or October last year. Today, Spark and Hadoop are Java 11 centric, with the note that Spark is now 17 friendly.
What’s to Come?
What’s going to happen in the future? There are serious changes happening. Kafka 4 is going to drop Java 8 support. Spring Boot 3, Spring Framework 6 will require Java 17, as in they are going to use 17 as a baseline. Hibernate 6 already requires Java 11. jOOQ intends to baseline to Java 17. If you’re using any of those frameworks, or the framework that you’re going to use has a component, which is one of those, you will be forced to upgrade, or else. Obviously, this isn’t happening overnight. The old versions are still going to be maintained for some time, or are being supported by the open source community, or maybe somebody is going to backport things. The shift in feature and enhancements production is going to go towards the new version. It is a good time to start your migration from Java 8 to 11, at least.
How to Migrate
How do you migrate? I suggest you have a look at build tools that you’re using, because they have a few things that will help you there. There are two elements in the bin directory of your JDK that are going to be very helpful. One is called jdeps, which shows module dependencies including internal API usage. If you need to migrate, you can scan it, you can scan your application with it. It will tell you if they’re using something that you shouldn’t, or maybe something that’s going to go away. Deprecation is going to be shown by jdeprscan. Obviously there are Gradle and Maven plugins available. Now, speaking of Maven, how do you enable a newer JDK version on Maven? Probably use a better compiler version than I have on this slide. Apart from that, set a source, set the target and you will be good.
Speaking of two handy things, Maven versions plugin, display plugin updates. As you can imagine, displays plugin updates. If your build has not been maintained by many or recently, just use it. There is a similar thing for versions called display dependency updates. Self-explanatory. Very useful if you’re using Maven. For Gradle, if you want to use Gradle with Java 11, v5 is good, v6 is good, v7 are good. If you need to upgrade Gradle because you’re behind, my recommendation is upgrade one version of Gradle at a time, because otherwise this is going to be a large chunk of work. That’s just that. Gradle and Java 17, it used to be a thing, but now Gradle and Java 17, since October, they were available. As I mentioned, since version 7.3, it actually works perfectly well.
Mockito at first started supporting Java 11 in 2.20.1. Then there were multiple releases and multiple lines mentioning JDK 11 support. Why do I mention this? Not because I need you to memorize those numbers or they are in any ball or form significant. It’s just to show that sometimes JDK compatibility comes in stages, or there are things discovered as a community adopts the new version of libraries. This happened to Mockito. This happened to jOOQ. jOOQ was a particularly uneventful migration as in we just migrated and we were happy. It is going to support JDK 17 in 3.15. They are going to also have an API based on the records and the conventional branch at first. If you don’t use jOOQ, I wholeheartedly recommend. It’s awesome if you do.
Flyway, a toolkit for managing migrations of your database. Supports JDK 11 since version 5.2. We’ve actually had issues in there, so we moved back to pre-JDK 11 supporting release, and then we moved to 5.2.4, and then somewhere further. Such journeys are also possible and normal. Since I mentioned JDK updates and some of you might still be on JDK 8 which means you have JAXB as part of your JDK, those are now removed. JAXB is no longer part of the JDK, past 11 and later, which means you have to add it as a normal dependency.
Languages
Now languages, because most of us are probably not only using Java in our applications. Groovy. Why would I mention Groovy? One reason is Grails, because there is a website that I manage that actually is based on Grails. Whenever there was a Groovy update, we’ll try to take it in. Also, Groovy is the foundation of something very popular, which is called the Spock framework, which is awesome for testing. Java 11, Groovy supported that since version 2.4.16. Then Java 17 since 3.0.9 or 4.0, which means right now, as of today, you’re perfectly happy to run Groovy with Java 11 or 17, and it should work. Scala, for us the migration story was just switch versions of the JDK because Scala just worked. Scala did say it upfront that they do not enforce the module system. That’s not an issue for us because we do not use the module system at Revolut. Also, Scala already talks about supporting Java 18, and they just do. Kotlin supported JDK 9 to 12 since 1.3.30, and they also support JDK 17 since 1.6.0.
Dependencies
Now dependencies, because obviously, your application is most likely having some internal dependencies, libraries, how do you even approach it? How should you approach it? For us, every application or most of the applications are relying on an internal library which manages database connectivity, and entity model lifecycle, and actions, and flows. This depends on something called Commons. For us, we started compiling the applications, so the outer most layer with the newer JDK. When source was compiling with both JDKs, we started to run tests using the new JDK, and then we started to run the application using the newer JDK. Then we went down the onion.
A couple things worthy of mentioning. Switching from 8, you’ll have to change your GC logging flags. Some flags are going away. How can you best figure it out? How can you best know what goes away, what is current? There is a cool website, chriswhocodes, which mentions flags, and tracks flags across multiple different versions of JDK. It’s awesome to sanitize and to understand what a specific version and a specific release means or meant. I suggest you use that if you need to examine especially more convoluted precious set of flags. There is also a command line linter for JDK runtime, which is quite nice and useful, especially if you have a lot of things to migrate, or the applications that you are looking at migrating have a lot of legacy stuff.
Some other issues, 8 to 11, time precision in the JDK changed. Basically, the difference is that now we can have more digits in the precise time output, which means if your unit tests or any other integration tests expect a specific precision, you will have a bit of solving. It’s nothing wrong. It’s just the enhanced capability by Java to work with higher precision, which means most likely have your own intermediary layer that allows you to inject clocks of a chosen precision. Especially useful for timing, testing, or anywhere else, because that’s generally a thing that you should do in your software anyway. Don’t do instant.now or rely on system clock, do it through some sort of an accessor so that if you need to mock it or if you need to do anything to it, you can. There were bugs in many places. There were bugs in the compiler which got fixed. That’s normal. That happens because JDK is made of software. There were some bugs that actually manifested themselves only in production, especially around generics. Usually relaxing the generic captures allowed us to solve that.
Life with G1 by Default
Then there is this thing, life with G1 as default. G1, default garbage collector algorithm from 11 onwards, too long, didn’t read version is awesome. No problems, just do it. Of course, our context in which I’m saying that is, services which do not have high frequency low latency requirements. We operate human scale software mostly, so that was really not a problem for us to adopt it. We’re quite happy because that means that people do not have to spend time investigating GC logs. This is really a changing thing, it reclaims multiple developer days in general. If you want to start using G1 at JDK 8, the important thing to resay every now and then is that G1 in JDK 11, is a different G1 than the one in JDK 8. Similarly, G1 in JDK 17 is going to be a slightly different beast to G1 at any other, because garbage collectors are being worked on. I will not quote features and changes from memory, but they evolve and that’s something that you should check and test.
The big difference is since JDK 11, full GCs in G1 are multi-threaded, actually since JDK 10. Human-perception pauseless for heaps up to 32 gigs, entirely possible from our experience. Maybe if your software is special, that won’t be, but we basically stopped caring about this because we don’t have to. Less problems requiring GC logs are almost exactly zero, and faster out of memory failures, which is also useful. That’s something that we noticed. Because of G1, when we moved to 11, some containers started dying on us, because resident set size of a Java 11 process would be slightly higher, compared to 8. We had to adjust Xmx and Xms, and we would be getting our out of memories faster in 11 than 8, which is actually good, because then you can restart and adjust.
Language Features Adoption
Language features adoption, this is the biggest one that I’m going to put on a chart. Within almost a year, var became very popular in a single project, basically it became a standard in which we write it. Why is that a thing? Because var speeds up reading and if it’s obvious to read, people like using that. We like it. Another thing, since 9, underscore is a keyword. If you’re familiar with other languages you would like to use underscore as an identifier of something that you don’t really care about, but there is a workaround. The workaround looks like that. That’s basically a double underscore. That’s a perfectly valid identifier, feel free to use it. Another aspect good in modern JDKs is Java Flight Recorder event streaming, but I’m just going to signal it.
Java 11 to Java 17
Let’s have a look at a migration from 11 to 17, which is a recent story for us. This recent story goes through many different JDK versions. Some of the features are only highlighted, but I’m not talking about them too much except for this one, maybe. If you need concurrent mark and sweep, then it is going to be removed in 14, or it actually has already been removed in 14, which means it doesn’t affect us because we are running G1. If it is something that you use and depend on, then there might be a limitation for you. Or you might want to explore ZGC. JDK 15 removes Nashorn, mentions ZGC properly. It’s not in a testing mode. Then introduces text blocks. Text blocks are something like that, if you’re used to other languages which do string interpolation and so on. We do not have that in Java, but that’s progress. The good thing is with a fast release cadence, maybe there are going to be some evolutions to those.
JDK 16 migrated to GitHub, started to do pattern matching, started to do records. Records are a thing that are very good for us. A record in short allows you to convert the left to the right. That’s awesome. If somebody distrusts me, yes, it’s not exactly one to one, because I didn’t type it exactly to be one to one, but you can see the difference in the code volume, and this is the important change. Important thing with JDK 16, and this is the reason why I mentioned a migration from 11, if to 17 directly doesn’t work, then maybe have a mid-break at 16. It’s because 16 starts to strongly encapsulate JDK internals by default. That means you have to add this flag to run with 16, if you still need to touch them, for some reason, or the libraries that you use have to touch them for some reason. Then 17 has a continuation of this JEP. The continuation in 17 requires a different flag to access the internals. Sealed classes, great thing for API designers, and something to do with the serialization filters.
How to Upgrade
How should you upgrade? In my opinion, the best way to upgrade is 8 to 11, then to 16, then to 17. This is probably going to change to 8 to 11 to 17 as the year goes on. Because JDK internals are strongly encapsulated right now, 11 to 16 migration is going to show different things and less things than 11 to 17, which means sometimes, if a 17 drop-in replacement isn’t going to work for you, this is a recommended workaround. Colors in the IDE. Awesome. Click here.
The Performance
Obviously, somebody might ask a question about what’s the performance of the JDK after the upgrade? Did we notice any performance gains? Yes, we did. There are performance improvements being continuously added from one JDK to the other. This is something that is very exciting for us to use and to observe, obviously, the growth that Revolut enjoys is consuming those performance gains. There are some benchmarks available on the internet. I have not vetted them, but there are definitely some that also claim something similar.
Modules, and JDK Version
Do we plan to use modules? No. Because we prefer to segregate our APIs through services and modules that sit in different repositories, and to publish the API, which means we do not see a need for modules to roll this out across the whole company as of today, at least. Which JDK are we using? OpenJDK.
Why Upgrade at All?
Why would you even want to upgrade? One good reason is because you are going to observe performance improvements. That means that the bigger the environment you are running, the cheaper it becomes, especially if you’re running hundreds or thousands of JDKs or JVMs. One percentage point of less memory consumption, for example, can translate to a significant amount of dollars. That means that if you’re in the team that can own the migration and claim the success, that’s a very comfortable place to be in, a very low hanging fruit. You can actually do more with less. With the increasing energy prices and the pressure towards optimal solutions or more energy efficient solution, that’s an important aspect of what we do. Another aspect is developer attractiveness. There is a lot of developers who like to work with recent things. If you say that you run a very recent modern JDK, that is going to increase your attractiveness compared to other employers.
Another aspect is some of the libraries are going to force you to upgrade, or if you want to use the recent libraries because maybe you are going to start running new projects or maybe you want to look like an attractive employer, that is going to be a thing. Obvious low hanging fruit, JVM bug and security fixes. Release by release, they come and enter the new JDK, and then the new JDK. There is going to be an increasing number of libraries that are in the open source, non-commercial versions or maybe just open source versions because they might not have a commercial version, that are going to leave JDK 8 behind at some point. I do not expect this is going to happen massively this year. At the end of this year, we’re expecting Spring Boot 3, Spring Framework 6, which are going to be two major milestones for Java 17 as a baseline migration. Then new projects starting with those are going to rely on Java 17, and so on. That’s going to be a good step forward and a good justification.
Another aspect is lower operational requirements. If you’re running non-specific or just services, maybe microservices serving human requests or serving mobile requests, a backend site like that. That means that you will have an easier way of dealing with modern JDKs. One reason is Java Flight Recorder event streaming. Another aspect is the internals are also seeing some tuning. Then not having to worry about the garbage collector for the situations that do not require very high throughput from the applications are very relieving. That means that people do not have to spend time worrying about this because it just works. This is an awesome feature, and an awesome behavior from the JDK DMS. I think you can just use and it just works. I like that. On the other hand, if you’re in a team that sits with very specific requirements, then you will have to do your research. There is no change for you there.
Upgrade Path
How should you upgrade? If you have to do upgrade today, probably 8 to 11, maybe 8 to 17, if you can. The proposed upgrade path we’ve already described. Then there are two scenarios that I will mention. If you have a fleet of microservices, probably I would suggest following Revolut’s approach, application by application, migrate forward. Then, when most of the applications are migrated or all of the applications are migrated, migrate all of the internal libraries. We didn’t go with emitting or compiling to target the old JDK versions at all, because we didn’t have a reason to do that. Our software can, following continuous delivery, be deployed regularly. If, on the other hand, you’re running a JVM which is completely isolated from any networks, maybe it’s happily sitting on a boat, maybe it’s powering a sonar data pipeline. Then the performance improvements are definitely something that might be interesting for you if time is of the essence. Then this is probably one of the few scenarios in which I can imagine you don’t really have to upgrade. If it has been running happily for the past eight years, or five years, or whatever, then it might. You can find companies that will still support Java 8, who will still support Java release 6 or 7 as well, maybe even older. That is going to cost if you want the support. If you’re stuck with an older component, until they upgrade, you will have to live with that. Then they are going to see the pressure because most of the community, most of the library ecosystem is going to move past the Java 11 checkpoint.
Should Non-LTS Releases Be Considered?
Another aspect is, should non-LTS releases be considered? Absolutely, because they can make a difference. An example that I know a lot of people have experienced is G1 in JDK 13 and 14, has started to exhibit much more controlled latency and much less jitter with regards to timing, or GC duration, compared to JDK 11. Those changes, those improvements are coming, JDK release by JDK release, which means if it makes a difference for you, absolutely take it in. Also, there is this company, Azul, which I use as an example, which offer support for JDK 13 and JDK 15. Two intermediate releases between one LTS to the other. That might change as we go forward towards the model that Mark Reinhold has proposed, but we’ll see.
Questions and Answers
Cummins: When should you migrate? As you said, the answer is always going to be, it depends. Is now a good time to migrate?
Grzesik: The answer always remains, it depends. If somebody is on 8, and they can do that, they should migrate to 11. Don’t look at 17 if you’re already in an organization that is slightly behind on the Java version. It’s ok. People do that. We know why that happens. There is a bazillion of reasons why this is an option, but 11 with the libraries going to baseline on 11 means, prevent the problem that will happen if you lag behind, because those libraries, they will have some catch-up phase in which people will be frantically migrating. Avoid the panic. Do the effort. It’s relatively painless. At Revolut, it took one or maybe two people working together not exclusively on this problem, maybe across a period of a couple of months. It’s reasonably doable, especially if you approach the problem and can approach the problem. You will have to spread out the effort across the applications that you have to work with. The sooner you chart the ground, the sooner you know what you have to deal with.
Can you speak a little about the legal issues you mentioned? If I remember correctly, the legal issues were specifically about the Oracle JDK license in version 11. Oracle JDK the one that I would download from Oracle website had required the production license, or required a contract with Oracle in order to create custom images, and in order to distribute, for example, custom Docker images like we do. The very easy solution for this is using something like OpenJDK, which is on the binary level, you run exactly the same JDK, but there is no requirement to have a contract attached. Just use OpenJDK and you’re good. Or maybe use one of the other options, or you can use Eclipse Temurin. The Adopt JDK runtime [inaudible 00:38:02]. That’s just that. Nothing scary. I know it sounds scary when you mention legal, but I have to mention it because if you kept running what used to be the default Oracle JDK in prod, you would risk being in breach of contract. That’s something to be avoided.
How did you anticipate any potential issues before migrating? Did you use any tooling to support the analysis before diving into the effort?
Yes. We could see how much of the deprecated APIs we have to go through. That’s one thing. We have an amazing tool at our disposal, as in Java is a compiled language. If it compiles or getting it to a, everything compiled state is already a good step forward. That was available for everybody. There is the jdeprscan, so the deprecation scanner, especially if you use some of the internal inside the belly APIs from Java, then you might get different results. For us, there were just a couple of fixes that needed to be done. The good thing is, if you approach the problem right now, you’re in a very comfortable situation, because most of people have blogged about how you can work around the 8 to 11 upgrade because of this issue or that issue.
Cummins: Do you have a sense, and this is probably a tough question unless you kept super detailed records, which no one would, of how many of the problems you were able to catch just with the compilation and how many ended up turning up as nasty surprises in testing, and how many ended up escaping all the way to prod and then being really nasty surprises?
Grzesik: We’ve had some situations in prod. Changes around generics resulted in runtime exceptions materializing in prod, because they would pass tests. That was unexpected. The good situation for us, we had a lot of tests. When you looked up the error, you’d see that captures don’t match. One option of going or troubleshooting that is, ok, can we write those captures differently? As it is, in one of the slides in the example, we ended up using wildcards. I think question mark, question mark, instead of something more specific, which is not ideal, because you would like the type system to support you. As a workaround, it’s a quick and easy way of just going to 11.
Anything else in production that was crashed? Nothing from memory. I would certainly not call it a painless or relatively painless process if we went through hell and mayhem, but we didn’t. It was good and it was better. The important thing is about the containers and memory consumption as in G1 versus anything else. The overall sizing differs, but that’s just an adjustment. If you’re using configuration as code, you’re going to adjust it. That’s it. The work is done. It’s not difficult or insanely non-trivial to troubleshoot. It’s running out of memory, so what do we do? We either reduce the heap size or you give more memory to the container. Then if the problem goes away, and is stable, everybody’s happy. That was exactly our situation.
Are there any JDK specific tooling which can highlight issues before they show up in tools such as Black Duck?
Open source compliance tools, that’s what Google then suggests. Software composition analysis. We’re using Snyk, so security issues, the ones that we have to fix are usually associated with libraries and dependencies, just because of the JDK change. We were not on the very much forgotten early builds of JDK 8. We were on reasonably up to date JDK 8 build. We have the exact version in there. We are not leaving stuff behind, so we are trying to minimize the entry potential for malicious people, just because we are using an unupdated JDK, because that is a threat vector and you have to minimize it, and we want to minimize it. We have a security team who looks after all of our software. We also use Snyk to scan for things.
Cummins: Intuitively, you would expect that the number of vulnerabilities would go down as you upgrade rather than up, just because the nature of these things is that they have more time to get discovered in the old versions.
Grzesik: This is why I say as of today, as in JDK 11 is a perfectly comfortable state to migrate towards because it’s been battle proven, for three years plus, which means I do not expect major things to materialize. It’s a safe and well adopted baseline. Hadoop uses that. A lot of other tools also use that. I would encourage people to. If upgrading is super difficult in your organization, just plan to upgrade to 11, then the next time you have to do it, it will be an easier process.
Cummins: What about the LTS releases? Because I think they can sound a bit scary. Are they beta releases and should we treat them in that way?
Grzesik: That’s a thing that happens. Java 11 is an LTS release. LTS means long term support, but the 12 and the 13 and the 14 and all of the other JDK releases they go through very thorough testing, and they go through exactly the same thorough testing phase. If somebody wants to migrate to 18, it’s a full quality, perfectly correct JDK version, trustworthy, and so on. I will put it in production. I actually have some sort running in production. Not in Revolut, massively just some of my afternoon projects. Yes, I trust it. When 19 comes out as a general availability release, I will trust it because the JDK team has a lot of tests. They have a compatibility kit that verify that Java is doing what exactly people expect from Java, unlike some other scripts. Yes, LTS release, a very good choice, and any other Java releases also a very good choice for running things in prod.
Cummins: If the only difference is the length of support, if your organization has an appetite for upgrading more regularly, then you can still stay fully supported. You just have to be doing that upgrade.
Because you mentioned how long it took your organization to do the upgrade, which was super useful. Do you think there’s a cost difference between those two patterns of, let me wait for as long as possible, and then do a big upgrade, and let me hop from LTS to LTS.
Grzesik: With the cost model, it depends on what the organization is inside. For us, we are a modern organization, we move quickly. It’s part of the nature. It’s part of how the organization rolls. We don’t have a terrible lot of third party software to upgrade. If somebody is or has a lot of third parties that they have, then obviously, the situation is different, if you have a lot of software that you might have through third parties or other vendors. Or maybe they need to do the changes because of contracts between organizations. Obviously, the situation is going to be much more complex. Then you can start small, start with at least some application so that you can see how it goes, and what are the benefits? We’ve seen size, and I mentioned some with performance and some with reduced people overhead, as in, we don’t have to look after those JVMs in a business application setting. As in, nothing ultra-high frequency or just high frequency, it’s human latency levels.
See more presentations with transcripts
MMS • Nsikan Essien
Article originally posted on InfoQ. Visit InfoQ
Microsoft released for preview a series of new features for Azure Database for PostgreSQL Flexible Server at Ignite 2022, their annual conference. The new features include encryption of data at rest with customer-managed keys, database authentication with Azure Active Directory, geo-redundant backups and fast restores of data, and a migration tool for moving workloads from the product’s older Single Server deployment option to the newer Flexible Server deployment option.
Azure Database for PostgreSQL is a fully-managed database-as-a-service that enables customers to run PostgreSQL workloads on the Microsoft Azure platform. Launched in 2017 with the Single Server deployment option, which executes the database engine on a proprietary windows container, the service was enhanced by 2020 to include the Flexible Server option, which runs the engine in a container on a Linux virtual machine instead. While both deployment options use Azure Storage for their data files, the Flexible Server option provides additional configuration for optimizations of database performance, security, and cost.
Customer-managed keys on Azure Database for PostgreSQL Flexible Server allow for comprehensive control of access to stored data. By leveraging the capabilities of the Azure Key Vault service, customers can use key-encryption keys (KEKs) to encrypt the data-encryption keys (DEKs) used by Azure Storage for the PostgreSQL server’s data files. Segregation-of-duties compliant access to the keys and data can then be set up by configuring the required policies and roles administered against Azure Active Directory (Azure AD) as illustrated in the diagram below:
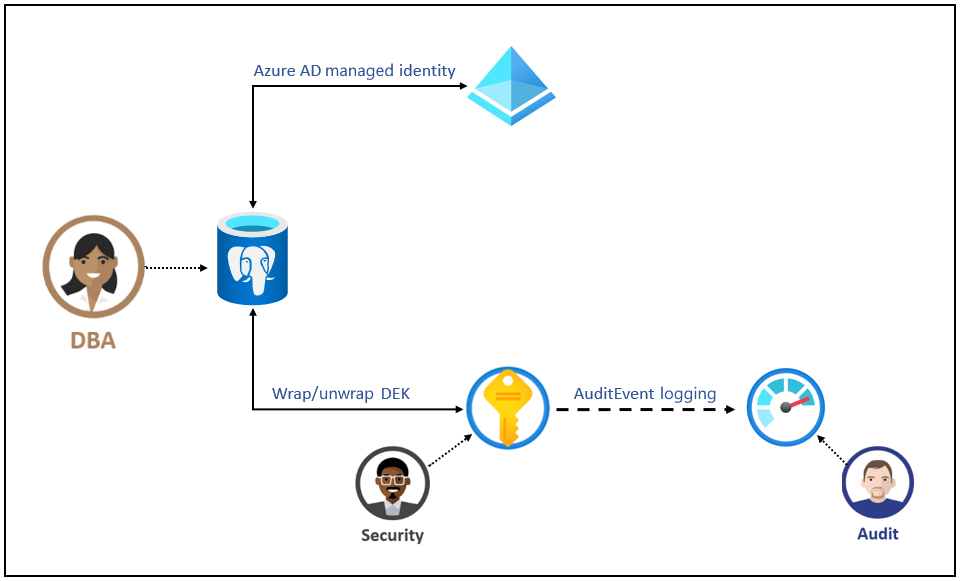
Source: https://learn.microsoft.com/en-us/azure/postgresql/flexible-server/concepts-data-encryption
Database authentication with Azure AD on Azure Database for PostgreSQL Flexible Server allows management of access to the database at the application layer using the centralized identity and access management provided by Azure AD for a given Azure subscription. To access the server, principals would then need to request an access token from Azure AD and connect to the server while presenting the issued credentials. At a high level, this is shown by the diagram below:
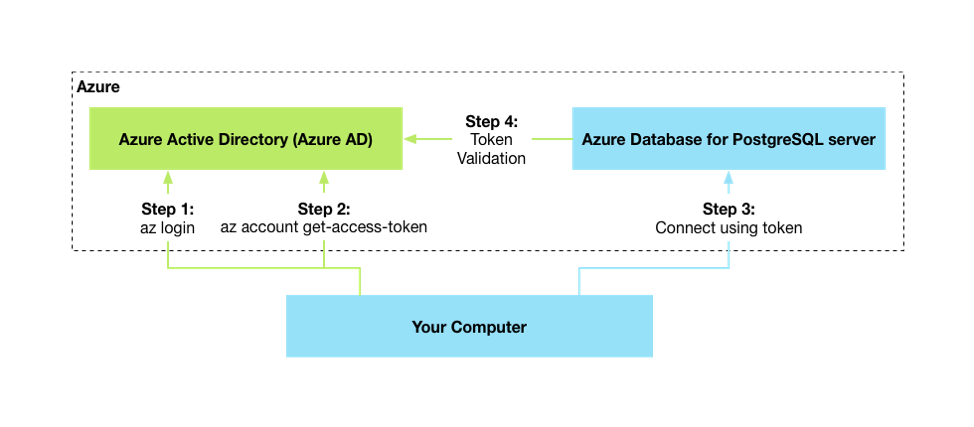
Source: https://learn.microsoft.com/en-us/azure/postgresql/flexible-server/concepts-azure-ad-authentication
To provide better resiliency of a Flexible Server database, users can enable geography-redundant storage. This update increases the availability of stored data from 12 nines (99.9999999999%) to 16 nines (99,99999999999999%) and is built on the Geo-redundant storage functionality provided within Azure Storage and so replicates data asynchronously to a single physical location in a secondary region.

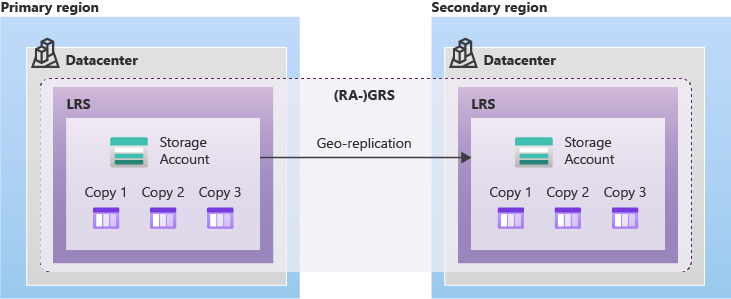
Finally, to assist customers seeking to migrate workloads from a Single Server to a Flexible Server, the Azure team has released a tool in public preview. The tool automates the creation of the Flexible Server infrastructure and enables the prerequisite networking requirements for the data flows. The tool can migrate up to eight databases at a time and has support for two modes of migration: online, with reduced downtime, and offline, with extended downtime.
MMS • Stefania Chaplin
Article originally posted on InfoQ. Visit InfoQ

Transcript
Chaplin: My name is Stefania Chaplin, aka devstefops. I’m going to talk to you about securing APIs and microservices in the cloud. In terms of the agenda, I purposefully keep it vague. I’m going to talk a little about myself. What are we here to talk about? The people involved. How we’re going to fix it? Now what, why, and summary.
Who am I? I used to be a developer specializing in Python, Java, Rest APIs. I’m one of those people that if you give a JSON to, I can tell you exactly how many squiggly and square brackets it will take to get to the value you’re looking for. Then I went to the wonderful world of security. DevSecOps, AppSec, CloudSec, API security, doing a lot with open source security awareness training. Now I work at GitLab, the DevOps platform.
Netflix
What are we here to talk about? Netflix. It is a streaming website for films, TVs. Netflix are very interesting, or at least I find them interesting, because they’ve done some really cool tech things. If you have never heard of Chaos Monkeys, I would go check it out. It’s very much chaos engineering. They literally will turn off data centers or processes, or they try and break the system to see how advanced it is. How easy they can get it back up and running, or how seamless the user experience can be. They’re also very cloud heavy. They are potentially AWS’s biggest customer. That’s quite an accolade. They weren’t always on AWS. Actually, when they were doing that migration, it did take seven years. There is quite a lot of content there, and especially with the number of customers they have, the number of programs, just the entire system, they make it run seamless for users.
Evolution of an API Architecture
How do they get content to customers? This is their evolution of the API architecture. They started off with more of a monolith, so you can see a big black circle. You’ve got all your devices, and they are accessing the Netflix monolith. You can imagine those red lines as, for example, API calls. If one of them gets compromised, that is going to be a problem because it’s almost a one-to-one mapping in terms of one device goes to the architecture. When you look at direct access, what you’re seeing is, for example, a CDN, content delivery network. It’s a bit more spread out in terms of you have multiple different calls, they may be going to different servers. Then there’s also this internal communication as well, which is most likely done by APIs, and you’re starting to see this microservices architecture. This is definitely an improvement. Likewise, if something gets compromised, you want to have multiple levels of security.
Then comes our gateways. We can see on the top right, we have a nice purple rectangle, signifying our gateway. This is gateway aggregation. It’s a bit like a fortress. It’s a bit like a front door. It’s checking who needs to go, who needs what to be accessed, what needs to be called. It’s a very good way of adding an additional security layer. Finally, what we see with a federated gateway is we have those layers of abstraction. If we had a malicious actor, and they managed to infiltrate a line in the federated gateway example, it would still be quite modularized in terms of, maybe they would get the API call between the device and the gateway. Or maybe it would be within the direct access between the microservices, but unlike with a monolith where you have one, if you got one lying down, then you’re going to have a bad time. With federated gateway, you have a lot more security, availability, reliability.
Microservices
When it comes to microservices, why are we talking so much? Why are they so linked? Here I have my microservices example. I’ve got quite a lot of bugs spread out between my different services and directories. There’s one particular one I want you to focus on, which is the red ladybug near the top, because unfortunately, this is an API vulnerability. This is where it comes back to the link between API security and microservices. Because with the API security, this is what is linking the microservices together. You really need to focus on your API security if you are going for a microservices architecture, or if you’re doing APIs in general, it’s a good idea to focus on API security. Because the reality is, you’re probably going to have a lot of bugs in your system, but you really want to be as secure as possible, ideally, eliminate the bugs also. Martin Fowler talked about smart endpoints and dumb pipes. Very much when it comes to API security, you want to be doing your authorization, you want to be checking the context, what’s going across. You want to have a permission model.
Common Pain Points
What are some of the common pain points, when we have microservices architectures? I was in a conference in QCon in April, and we asked the audience, how many people are using microservices? Nearly everyone raised their hands. How many have more than 10? Still lots of hands raised? How many have more than 50? The numbers dropped. How many have more than 150? I think that was one hand left, maybe two. What you’re having is, when you were breaking down your monolith into a microservices architecture, you end up with many microservices, many API calls, because that’s how these microservices communicate, but who owns security? Where does security come in? Are you doing secure design? Are you thinking about security as you are creating these APIs? It’s very important. We talk about shifting left a lot in DevSecOps. It’s now to the point where we need to shift left to design. The latest OWASP Top 10, the web one, top 4, is actually called now insecure design. It brings into, for example, threat modeling. Before you write any code, create any API calls, you need to think about the security angles of this. This can be challenging, because with a lot of organizations, you end up with siloed teams, which means there’s a lack of ownership and accountability. Who owns what, and how? The person that is writing the API, are they responsible for the API security? Yes. Certainly, security, are they responsible for API security? Yes. Fundamentally, everyone’s responsible for security. It is another quality test. It’s a quality check.
No matter what your role is within the software development and API process, you need to be thinking about the implications of your work. Are you being as secure as possible? Because we end up with delays, fails, or worse. What I mean by this is, obviously, you have delays or fails. That can just be annoying when you end up with everything behind schedule, over budget. Everyone a little bit stressed. It’s more than just that. If we look at security over the last five years, it used to be a case where you would get your personal details stolen. It might be credit cards. It might be address, or in America, social security number. What you’re starting to see now, especially in the last year or two, is a lot more ransomware. While before, it would be like, we’re going to take your data, and that’s obviously bad. People can replace credit cards. It’s a bit harder to replace your social security, there has been large rises of fraud. It’s bad. Ransomware is worse, because then you are totally locked out of your system. Then you are, as the name suggests, at ransom. Also, it’s not just about the hackers, if you are working in an organization where your developers are unable to do their job, there is bureaucracy, there are checkpoints, there are problems, there is no sense of flow or joy within their work. It’s a very competitive market. What you might end up with, is, you get people burn out, then they leave, and then the remaining team are even more burnt out. It’s really worth thinking about how you do your microservices architecture, how you do API security, and how you do security in general, because otherwise, you might end up with worse.
Who?
Who are we talking about? I’m going to tell you about my silos. I’ve got three specific ones. I have my developers. These could be API developers. If you are doing microservices, maybe they are using infrastructure as code. I want to say infrastructure as code developers, that sounds a bit weird, but I think you know what I mean. Maybe I’m using Terraform, for example. Usually, you have quite a lot of developers. If you look at the average organization, you have about 100 developers to each security. With security, they very much are numbered, so yes, 1 to 100. When we think about API security, it is not the responsibility of security to go through and check every single one, or check everyone manually. You can obviously get security tools that can help to automate, that can help to speed up the process.
Actually, what you want to do is you want to get the developers writing secure APIs to begin with. Or when they’re writing their Terraform scripts, are you scanning them? For example, Checkov is a great tool out there. Are you using that? Because microservices are awesome. The fact that we can provision into the cloud is awesome, but now one typo affects thousands of servers. You also have a final group, DevOps. You end up, 100 devs, 1 security, 10 Ops, and they’re just trying to keep everything going. Especially when we are doing microservices, with Ops, they not only have to maintain, but when things start going wrong, for example, incident response teams, you need to be able to isolate what’s going wrong. Preventing vulnerability traversal. Then getting everything back running with a seamless experience to the user.
Who Owns Security?
This is the thing, if we have these numbers, so we’ve got 110 developers and Ops to 1 security, who owns security? If you haven’t read nine components of microservices, I really would recommend it. It is a great read, if you want an intro to the what, and the how, and the why? What are the best approaches and best practices for microservices? Martin Fowler talks about cross-functional teams. Instead of having all of your 100 devs in one place, you’re going to spread them out. One of his other components was around focusing on products. What that means, when you have a product mindset, it’s like, you’re doing econ, or you’re doing mobile banking, or maybe you’re just doing an environment, for example. What this means, if you’re the product owner for the e-commerce, you’re going to be responsible for the security associated with that. Because when we have these cross-functional teams, maybe we have developer, QA, Scrum Master, but who owns security? Where does security fit within these teams? Which is where you need to start introducing automated tools, automated scanning. I think it was Forrester who said quite famously, manual processes are doomed to fail. If you’ve got one security person manually checking, you’re not going to have a good time. It’s really about how we get there. Also, the scalability. Because you don’t want to end up like this, these silos and not having as good a time.
It’s not even just about security. I was working in an organization. I tend to join two Slack channels in every organization. One is the gaming one, because it’s a lot of fun. Also, the engineering one. I used to be an engineer, it’s interesting to see what’s going on. One time, there was a graph that was very high. Then it went cliff face, and then it was very low, over time. One of the cofounders, CTO as well was in this thread and being like, we’ve investigated what has been happening. Within AWS, there was a misconfigured EKS, so something was spawning, falling over, spawn full, full spawn, spawn full. That sounds expensive. It was. They said, we’ve managed to reduce our AWS bill from $6,000 a month to $1,000 a month. This is the thing, it’s not just about security. It’s not just about getting hacked. It’s also about basic hygiene. Don’t unnecessarily spend money by having a misconfigured service.
How?
How are we going to do this? I’m going to talk a little bit about authentication and authorization. Okta had a great definition for this. Authentication confirms users are who they say they are. Think of this like the front door. This is my bouncer, are you on the guest list? Are you coming in? Are you allowed to be here? Your authorization, that’s, what are they allowed to do when they get there? For example, if you’re going to a night, and maybe there’s a music act, maybe your music act gets free drinks all night. That would be the nice thing to do. Similarly, unfortunately, the flat above has flooded my apartment slightly against the wall, and I had to get a plumber in. For example, that plumber, I’m going to let them in. I’m only letting them in the specific room with the flooding, but actually, I’m giving them free will to do what they need to do, because I trust them because they are obviously experts. They’re a plumber. The way I think of it, authentication, who’s getting let in? Authorization, what are you allowed to do? Also, how are you doing it as well? What are the permissions?
OWASP API Security Top 10
There is OWASP, so Open Web Application Security Project. They do a security top 10. They do it for API. They do it for web. What’s worth noting with the API? Number one and number five are about authorization. What can users do? Number two is about authentication, which is, who are we letting in? If you want to focus on securing your APIs and securing your microservices, go to the OWASP Top 10. OWASP is an awesome resource. You can read about them, and you can get a better understanding of what to look out for, what are the quick wins.
Tips for API Security
I’m going to talk to you about some of the tips for API security. For example, when it comes to authorization, what can we do? Treat APIs like humans when assigning permissions, aka role based access control. There will be a case where we need someone to be an admin, but do we need everyone to be an admin? No. Similarly, I’m sure that every organization in their HR department has a list of all the humans that work at the company. Maybe if you’re best practice, your IT department knows how many laptops and knows about all the hardware, and hopefully knows about the software. With executive order, the requirements have an SBOM, software bill of materials. You might even have an idea of all the open source you’re using. Do you know all the APIs that are being used? Do you know the permissions of the APIs? Do you know the usage of your APIs? Because if we think back to the slide I had on Netflix where we had all those different lines, if one line goes down, how bad is it going to be? What data does that API call, and what permissions as well?
Next one, content integrity, confidentiality, reliability, and availability. In terms of integrity, message or content integrity ensures that when you’re sending the message, it’s not compromised after transmission. When it’s integral, it means it’s not been intercepted by a third party after the sender transmitted the message before forwarding it to an API. When we come to confidentiality, which is similar, content or message confidentiality ensures that the message received is verified. That the journey from sender to API has not been witnessed by unwelcome spies who saw the details of the message. There are different ways to ensure this. For example, with message integrity, you can use digital signatures to record the authenticity of a transaction. In this case, an app can create a signature using an algorithm and a secret code. The API applies the same algorithm with a new secret code to produce its own signature, and compares it to the incoming signature. Another method is cryptography. Public key cryptography is a method of using an encryption of a message that’s nearly impossible to code without a corresponding key.
Reliability and availability, so this one’s slightly different, because today’s apps, everyone’s apps are in the cloud, some shape or form. You have integrations to countless other cloud or on-premise services. Data will be flowing from one service or microservice to another and from one user to another. This creates a multitude of attack surfaces. Your app needs to guarantee that it is always available to respond to calls. That once it begins execution on the call, that it can finish handling the received message immediately without losing data and leaving it vulnerable to attack. One way of doing this is horizontal scaling by the API across multiple services, and by handing off the processing of the message to a message broker, which will hold the message till the API has completed its processing. What’s also worth noting is on my slide, the circle with the APIs, one of them is actually called lack of resource and rate limiting, because you’re going to have all these API calls. That’s great. What if one of these API calls is a hacker? What if someone is trying to brute force you? You also need to be able to tell, what is a sensible amount of reliability and availability, and what is someone nefarious?
This is when I come back to, what can go wrong? Think like a hacker, because it’s about this secure by design. It’s the security mindset. If we can all become 1% more secure, that’s going to make a massive, incremental difference to our security, versus if we just have one security for every 100 developers doing their best to keep the organization secure.
Why?
Why are we here? Why have you been listening? Why am I talking about this? This is a great quote by Brian Foote, “If you think good architecture is expensive, try bad architecture.” This applies so nicely to microservices, and by extension the way that you’re doing APIs, and also security. If you think good security is expensive, try bad security. Try being on the front page, try being locked out because of ransomware. It’s really worth the case. It really is worth investing in your designs of this system, designing them securely. Making sure they’re reliable, available, they have integrity and confidentiality. Because, yes, that’s going to be expensive, but it’s definitely the lesser of two evils. Because if you’ve got a bad system, you’re just going to have a bad time.
Summary
Think secure when you’re designing your microservices and APIs. You’re going to have bugs but you want to try and minimize them. Do as much as you can to reduce attack surfaces. Authentication and authorization, who can do what and how? If you’re doing API security, or you can extend this to wider security as well, who are you letting in? I used to work in security awareness training. If we validated our inputs, and we sanitized, that would fix a lot of the bugs out there, and with authorization, permissions. If you think back to human examples in an organization, you’re not going to put everyone’s contract on the shared Google Drive that everyone can access. Maybe HR can access that, and the individual user reads contract, for example. It’s very much thinking, who can do what and how? Finally, think like a hacker. What can go wrong? What can go wrong when you think like a hacker? I mean this more, what can go wrong in the system? What’s the worst case scenario? There’s a great meme, it’s like a QA walks into the bar, and he asks for one drink, minus one drink, 999 drinks. A lizard. Then the user goes into the bar asks for the bathroom, and then the bar bursts into flames, because it is a different request. Definitely, on a personal level, think about how you can help to reduce attack surfaces, because security is a shared responsibility.
Questions and Answers
Losio: I really like that you put some numbers in the presentation, so even the example of the silos with 110. What’s, for you, the ideal number of security guys in that scenario, it’s basically 0, 100, or no signers at all?
Chaplin: I think of it like a spectrum. Everyone can be security, because in order to do your job, just thinking about it from a secure approach, because security people won’t scale. I don’t think you need a one-to-one for every security to developer. If each developer just gets 1% better, then it can cope with a more flexible approach. Maybe 20%.
Losio: If you are the CTO or a VP engineering of a small or medium company where anyway, you hardly have 100 people, at least in engineering, and you hardly ever have a security guy. Let’s say that you’re working with a team of 20, 30 developers, what’s the best way to proceed? It’s just keep sharing the responsibility or try to get a focus of one person in charge anyway. What’s usually the standard process to deal with that, when you’re growing? When is the point where you pinpoint where you should really have a security guy in charge?
Chaplin: What you’ll find probably is, yes, if you’re working within a smaller team, like I say, with the spectrum, some people will be very passionate, if not paranoid about security. Some may not have as high a priority. I don’t know why. What you can do is empower those people and also think about empowering the whole team. Giving them the time to do basic security training within the language or tool that they’re using, so then they can start to level up. Then what you’ll find is when you do your temperature check of who’s interested in security, it will normally be that person that will start maybe a security champion program or potentially move into a more secure engineer style role. Obviously, it depends on the organization.
Losio: You’re basically saying that, yes, a nice path is if someone from inside the team takes the lead takes the interest and growth to that position. More than really, I’ve reached that point where I need to do the checklist and I hire a security manager or a security engineer. It’s more like, try ideally to avoid the silos too.
Chaplin: If we think about it, my ratio, 100 developers to 1 security, we only got 20 developers, that’s like one day of security time. Maybe you rent a CISO and have that one day a week. I’m all about incremental gains and empowering people. Especially with developers, if you can just get everyone to just level up, especially if you make security gamified, then you’re going to have a better time than if you have only a top-down approach, and then it’s all about gateways and barriers. I’m on the more like holistic yogi side.
Losio: One of the examples you used, was you mentioned, for example, I need to limit the number of requests to an endpoint, so just not securing in terms of authentication, authorization, but as well, it’s like, I want to make sure that apart from distributed denial attack, or whatever, I want to make sure that someone is not sending me 100 requests per second. Maybe it’s ok for my system. Maybe it’s not. It depends. I’m a developer, pick up a language, Java, whatever you want. I’m building my application, my product, that layer like securing my API, I’m building the API of my system for another team or to expose my microservice, whatever. That part, thinking about, for example, rate limiting, those kind of features, something that I don’t want to be, I feel like reinventing the wheel. I’m sure that there are open source packages, solutions out there. What’s usually the right approach to go that way? It’s just go to an expensive enterprise solution that maybe for a small company is pretty hard to jump into.
Chaplin: With that one specifically, yes, lack of rate limiting. You want to also prioritize what you’re limiting, so especially stuff that has high authorization, prioritize in that sense. I had the slide with the OWASP circle that has a lot of information in terms of, you can use the tools that are out there. OWASP has, I think it’s called ZAP. That’s their APIs for API fuzzing. Also for, if you want to do dynamic, if you want to have your application and start pinging it and see what happens. OWASP is always my foundational starting point. Then there are obviously other enterprise tools out there as well.
Losio: It doesn’t mean to develop inside their security on top of your API, but it’s more like try to leverage what you can find already for doing that.
Chaplin: The open source community is awesome. There’s usually some really cool solutions out there.
Losio: Can you say a bit more about federated gateways and how can they help security?
Chaplin: In terms of with federated gateways, I think it’s more of an evolution, so if we think about how things are moving on. It’s about having different checkpoints, which is a federated gateway access. You can get them within cloud service providers. For example, the main ones, AWS, Azure, GCP. I’m a big fan of reading documentation, so that can give you an understanding of what it is, why it exists, and best ways of using it as well.
Losio: Is there any holistic approach you can refer us to?
Chaplin: If we look at the shift left of security, first we would do pentesting, and then finding things in production. Then we’re like, why don’t we maybe take it into our CI and then we’re building it? Then, it’s like, why don’t we have IDE integrations? My whole holistic approach is taking a more security awareness approach. That’s why I reference the OWASP individual numbers, because if every single person, no matter what the role, whether you’re a developer, Ops, security, if everyone just gets 1% better, that will have a massive gain.
Losio: I know it’s a very controversial topic, so I bring it to you. You closed saying that, really keep in mind the cost of best security. I really follow you on that. I fully get that message. I think it’s a key point to take home. Often, think about also like a small company, new startup, or a scenario where you feel like security is slowing you down. I am careful with that word, because I know that’s a controversial part. It’s like, I want to be the next unicorn. I know that the chance is really small. Most likely, I’m going to fail. I might fail due to security, or I might fail due to having no customer. Why should I prioritize and work on security when I can just basically gamble in it. Many companies don’t do it. It’s not that they don’t know about security, but they know that they have a challenge, but they just leave it for a later stage.
Chaplin: Obviously, I’m not in that mindset. That’s the opposing view. Look at, for example, compliance, because you’re right, especially with the smaller startups, as you’re scaling, you might not need to be as compliant, but those usually have a good basis level. Minimum, just make sure that you’re compliant with what you’re doing. Then also, that can be the foundations of the security program. Because obviously, the people that write regulations and compliance, have a good like, these are the lowest hanging fruits. That would be a good starting point, if you’re not willing to invest too much in security at this point.
Losio: I’m thinking now, more in the mindset of a developer, like there are many tools on the cloud, whatever cloud provider you’re using, that helps you in security, service that kind of encryption by default, or can enable encryption, or a service that can add security component. As a developer you can leverage them, but often, there’s a cost associated with that. How do you usually suggest to approach that problem as a developer?
Chaplin: There’s a couple of things, in terms of with what you’ve done to describe the transaction, say sending an API call, do you encrypt? I always talk about prioritization. Be like, ok, is this API call going to be holding really sensitive data? That it has a larger attack vector. Is this a fun app I made so that every day I get shown a different cat on the internet? Obviously, those are quite extreme examples. Prioritizing, what is your high risk? What are your attack vectors? What are your tier zero? If it goes down, do you not want to go down? Then start there, and then work your way down. Because as you do more, you get economies of scale. Hopefully, you can get everything better.
Losio: I just want to really suggest an action item, it’s like I’m a developer. I love this presentation. I just have a few hours, couple of hours, half a day tomorrow, what should be my first action item, to read something, a video? What would you recommend?
Chaplin: It depends on what you like to do. If you like to read, I would check out OWASP. If you like to try things out, also go to OWASP, but then go on OWASP ZAP. That’s a fun way to try API.
Losio: You can try them there, basically. You can use it as a sandbox scenario.
Chaplin: Exactly. It’s also got a lot in it. If you want stuff other than API security, it also covers lots of other types of security.
See more presentations with transcripts