Month: January 2024

MMS • Guy Nesher

Angular, a popular Single Page Application (SPA) framework, recently released version 17, introducing a declarative block template syntax and overhauling the framework documentation and logo.
The declarative block template refers to a new set of commands introduced by the Angular template engine that share the following form:
@command {

}
The first implementation, Built-in control flow, simplifies using the for/switch/if statements.
The current Angular block template syntax often confuses new developers as it is verbose and hides the statements within the HTML, making it easy to miss.
In comparison, the new syntax separates the conditional statements from the components, making them much easier to follow.
@switch (expression) {
  @case ('value1') {  }
  @case ('value2') {  }
  @default {  }
}
While the new block template syntax might look like a simple ergonomic improvement, it also provides better type-checking, reduced bundle size, and significant performance improvement when using the for loop.
The built-in control flow feature is still in developer preview, as there are still some gaps in content projection. To enable it in your project, run the following code in the CLI:
ng generate @angular/core:control-flow
The second capability introduced using the declarative block template syntax is deferrable views.
Deferrable views offer a simple alternative to ViewContainerRef by providing a declarative way to defer parts of the template using the @defer tag.
@defer {

}  @placeholder {
  Loading...
}
The defer command accepts an optional trigger that determines when the deferred component will be loaded; perhaps the most useful strategy, ‘on viewport,’ renders the component when it comes into view.
@defer (on viewport) {

} @placeholder {
  Loading...
}
In contrast, the ‘on idle’ strategy will fetch the components when the browser is idle. This is the default behavior.
@defer (on viewport; prefetch on idle) {

} @placeholder {
  Loading...
}
On the documentation front, the Angular team provided the first significant overhaul to the Angular branding and documentation site.
Angular branding hasn’t changed much since the original release of AngularJS 2012, and a rebrand was overdue. The new, colorful branding brings a modern twist to the old logo.
The new branding is part of a brand-new documentation site that provides a simpler onboarding process and a new interactive tutorial and playground. While existing developers might need to re-orientate themselves, the overall experience seems smoother than the older site.
For a full list of changes, please consult the official release notes on the Angular Github repository. Angular is open-source software available under the MIT license.
MMS • Kent Quirk

Transcript
Quirk: I’m here to talk about architecture reliability, observability as a whole. I’d like to just start you off by thinking about thinking. If you’re designing something, if you’re working on something, if you’re building something, would you rather think about the telephone with its fairly obvious connection between a speaker and a microphone? This is a picture from Ericsson in Sweden, back in the 1890s of a telephone switch. All those gray fuzz you see there, that’s not fog, that’s wires. This is network connectivity with physical wiring connecting everything together. When you imagine it, you can hold that entire problem on the left in your head. The thing on the right, that’s engineering. Engineering really starts when the problem is too big to fit into your brain. When you see engineers who are super smart, super skilled, they can build systems that nobody else can understand because it fits in their brain, it doesn’t fit in your brain. That part is hacking. The act of engineering is when it no longer fits in your brain, and you have to start adding process and capability, and working with other people in communications.
What Is a Reliable Architecture?
I’ve been doing this a while. I’m over 40 years now working professionally in the software industry. I got my start writing device drivers in hardware in assembly. Now I’m working on large scale backend systems at Honeycomb. Honeycomb makes an observability tool. We’re not really here to talk about Honeycomb. I want to talk about architecture. What does reliable architecture mean? It’s not about failure. It’s not about avoiding failure. Any real system is going to fail in various ways. It may not all fail at once, but bits and pieces of it will. It’s about handling that change. It’s about being resilient to changes in the environment, to your customers. You deploy a new library. Your cloud provider happens to stop running its services, whatever it might be, things are going to fail. I was having an email conversation recently with somebody who said, just assume everything is going to fail. The systems you build to accommodate that is what ends up giving you reliability. It’s rarely clean, though. You can’t think about it, here’s where I put my reliability. We need architecture for the big problems. The way we do architecture is we break the big problems down into smaller problems, and the smaller problems into smaller problems like that. Everything is a hierarchy. It’s a fractal situation. I have been here for the evolution of thinking about programming functions, breaking your programs down into functions, and then it became objects. Then it became like split things up into processes and microservices and services. We solve bigger problems by going to the next scale of the thing we already understand.
Like I said, it’s not always clean. You get this hierarchy of things that are interdependent on each other or maybe not. Now what? The systems get really big and messy, especially when they encounter the real world. This is where we get works on my machine. Works on my machine means I know all the things. When you put it into the real world, all of a sudden you don’t have control over all the things anymore. Now you have to add in the connections between the parts. That’s why a debugger doesn’t really help you. Once your system escapes into the real world, you can’t stop it. Asynchronous communication, running services. You can’t just say, “Wait a minute, I want to look at this.”
Observability
We really need telemetry. We need the ability to read what’s going on in these systems that are living out in the cloud. The way we do that is with what we call observability. It’s what makes that telemetry meaningful. It’s the ability to ask questions about it, and then get meaningful answers back. Observability is a word that a lot of vendors like to throw around, everybody has observability. What does it mean? We had this little battle for a couple of years, where everybody was talking about the three pillars of observability: logs, traces, and metrics. I personally think this is a terrible framing, because it’s not like three pillars all holding up the roof of observability. They’re different sized. They’re different meanings. They have different values. I reject the framing of three pillars. I also reject the framing that they’re all equally important.
Metrics
Number one, metrics. Everybody loves metrics, everybody has metrics. We’ve all seen and maybe we’ve been the engineer who can just look at that dashboard over there, and there’s a little pixel drop in some metric. The engineer goes, that means the user services is falling over. How did you know that? They knew it from experience. They knew it from having stared at these metrics. That’s not sustainable. That’s not scalable. Metrics are pre-aggregated answers to your problems. They’re fighting the last war. You’re saying this was a thing that went wrong before, therefore, I’m going to track it, I’m going to add it up. When that number changes, then hopefully it tells me something meaningful. I did work at one company where we had the ability to build our own dashboards for our production services. We had 1100 metrics we could pick from to put on those dashboards. You could spend weeks just figuring out which metrics you wanted up there. Some of them are useful. It’s a real problem. Metrics are fine. They can be useful. They’re valuable to have. Sometimes it’s nice to just see what’s going on. They don’t really help you debug. You get a lot of them precisely because they’re not adequate to the problem.
Logs
Logs, they’re good. They’re also useful. This is where I actually got into the whole observability world. Imagine all these things sending logs, they’re all sending them to CloudWatch. They’re all integrated. They’re all going up there by buckets, maybe in time, maybe they’re integrated by time, maybe they’re not, but you got to query them. I had a little CloudWatch collection of logs, and I wrote a query language in Slack so that I could query my logs and post the results of the query back into Slack automatically. That was really useful for sharing that information with my team. You still had to write a clever query. It was all correlated by time. You could only get 10 lines. Maybe you found what you wanted, and maybe you didn’t. Then eventually realized that we could take that same structured data that we were sending up to CloudWatch and send it to a service provider, who could help us process that data and do something more with it. It’s still up to me to do the correlation between all the systems, all the events, and to know what’s in the logs. That is where tracing comes in.
Tracing
Tracing is basically fancy logs at its base. With tracing, you have spans. Those spans show you what’s going on in the world. What we see here, there’s a trace. You can see at the top level, there’s the root span, and it takes 5 seconds. Then you have all these various elements. It shows you basically when everything happened, the correlation between them, how long they all took, and the relationship between them. You have a hierarchy here. That gives you a lot more information about what’s going on. Specifically, when we talk about traces, the things that matter in tracing is these key fields. You have a trace ID, which is just basically a large random number, ideally. Every child span gets a reference to the parent. This green triangle here, parent span is 111, which is the span ID of the top one. Now we’ve defined a hierarchy. All the spans are independent, but they can refer to each other in a way that allows us to reconstruct the ordering and sequencing and timing of everything. One of the questions is, what happens if my trace cross services is not in service, you have to propagate that trace information.
Let’s talk about tracing in a little more detail. I want to go through a slightly idealized, actual trace situation that I came across about a year ago. I was working on a project that had been shipping for several years. I was noticing as I was starting and stopping it, it was taking a long time to start up in certain scenarios. There wasn’t a lot of tracing around. I threw some tracing in, and I was just like, we’ll just track some of these functions that I don’t know what’s happening during startup, I just decorated the startup code with some tracing logic. This is simulated code for clarity. It’s not the real thing, but it’s basically what was going on. Down here on the left, you see this process key’s function. What’s happening is there’s a bucket of keys that gets handed to the service. The services’ job is to encode or decode them. It uses a lot of caching. The keys are coming from user data, and so there may be lots of duplicate keys. What happened was that this code would start up, since those keys may not have been in the cache, we started up a goroutine for each key, basically a parallel routine to go off and query the database if the thing wasn’t in the cache, otherwise, just return it from the cache. That’s the get cache value up here. We look, is it in the cache? No. Go get it from the database.
This is what the trace looked like. Again, I’m sketching this out in general here. You can see we spun up in parallel all those get cache values, they all started at about the same time. The first one went out, looked at the cache, and then it goes and tries to get it in the database, it didn’t find it. Then the next one waited until the first one was finished before it went out to the database. Then it waited for the next one to finish before it went out to the database. What looked like perfectly reasonable code and is, in a world where your cache is mostly full, in this case, where the cache was mostly empty, we were serializing access to all these database values. I ended up with process keys taking way longer than I expected it to. The problem is, we didn’t all need to go to the database after we checked the cache. Instead, what you have to do here is add some code to check the cache again, after you get the lock. Because while you were holding the lock, somebody else might have put it in the cache. This is concurrency 101, but it’s also a real easy mistake to make. The point I’m trying to make is, I wouldn’t have seen this, I wouldn’t have addressed it, I wouldn’t have fixed it if I hadn’t known from looking at the telemetry. We turned this trace into that trace. Because everybody locks, one of them goes out and gets the database query. Then everybody else is like, now it’s in cache, you can go. I’ve highlighted a lot of details, but this actually was a 10x speedup for a pretty complex little problem.
How to Do It (OpenTelemetry)
Hopefully, that has maybe motivated the idea of why some of the stuff is useful to you. Now I want to talk about, in practical terms, how you should do it today. Basically, I’m here to tell you the good news about OTel. OTel is an open source, vendor independent standard for data formats and protocols for telemetry. There are standards for traces. That’s where it got its first start, based on the merger of OpenTracing and OpenCensus. Metrics are close. In some languages, they’re in pretty good shape. Logs are coming along. The idea is that there are libraries in basically every language under the sun. The Cloud Native Compute Foundation is the open source organization that runs Kubernetes. OpenTelemetry is the second largest project after Kubernetes. There were hundreds of developers contributing to it. There are dozens of special interest group meetings every week. It’s out there building the tooling to do this telemetry. Also, as part of that tooling is the OpenTelemetry Collector, the OTel Collector, as we call it. It’s a processing proxy. What you can do is it has receivers that can pull data or accepts data from all sorts of sources. It has processors that can process that data. Then there are exporters that can export it. It also can work with Grafana, Prometheus, that kind of thing. You can put it into the world and use the same tools you’re already using. You can also send this data to third-party vendors like my employer.
Instrumentation
Where do we do this? We have our stack, the operating system, and the container runs on the operating system and our app runs in the container. As you go lower in the stack, you can get a lot of detail, memory usage, and that kind of thing, but you lose your context. You can ask your operating system, which services am I communicating with? How much memory am I using? It doesn’t tell you which functions are doing that. Whereas if you go higher in the stack, you can get things from the app. You can do auto-instrumentation and you can do manual instrumentation. Auto-instrumentation works great low in the stack. You can go and attach auto-instrumentation at the operating system level or at the container level, that really can get a lot of information quickly and easily, and sometimes too much information. It’s a good place to start. BPF is the Berkeley Packet Filters. They’ve been around for 30 years. eBPF is more recent, and is basically a detailed protocol for reaching into an operating system getting a lot of useful information or injecting information in some cases. It’s really interesting as an auto-instrumentation tool that’s growing rapidly and quickly in the context of OpenTelemetry. It’s great stuff. We’re seeing a lot of evolution there. It will get much better as you go. Part of my point here is, get started now and that stuff can come along and help you. When we look at auto-instrumenting apps, it depends a lot on what your technical environment is, basically which programming languages or environments you’re running in. If you’re using a VM based system like Java, .NET, that VM is very easily instrumented, and controllable. It’s pretty easy to take your Java deploy, add an extra JAR to the list of things you deploy, and that JAR can reach in and watch everything that’s going on in your VM. It can keep track of your HTTP requests, it can keep track of your file system access, all that kind of thing. Again, it also can know about the libraries you’re using. Your auto-instrumentation library can say, you’re using Postgres. That means that I can auto-instrument that and keep track of things like, what was your database request?
Auto-instrumentation in those kinds of languages is great. When you look at something like Python or Ruby, what you’re talking about is decorating the functions, the structure of the app within the Ruby code itself. That’s a monkey patching approach where your function gets wrapped in another function that auto-instruments it, and then lets it run. These are pretty easy to get spun up as part of your configuration depending exactly on the language capabilities and what you’re trying to do, but it’s not that hard to do auto-instrumentation in those languages. Then you have languages like Go and C++, where auto-instrumentation, it’s a compiled language, so there’s basically two big methods. One is injection of source code by reverse compiling, essentially, your source, and adding lines of code to your source before compilation. Or, something like eBPF, where the language runtime is providing capabilities that the auto-instrumentation system can read. Again, we’re seeing some really good stuff happening here. It’s still early in that space. When everybody wants auto-instrumentation, they want the easy button. Sometimes the easy button is like, hit it again, not that easy. You can get too much. It can be the wrong kind of information for you to care about. Manual instrumentation is still a good thing to do with the app level, it’s still worth investing in. The nice thing is it intermingles. This is more hands-on. You have to modify your source and redeploy it. It’s the only way to really see what’s happening deep in your code. When I was talking before, I added lines that were around the function calls I care about, but I didn’t add auto-instrumentation at the tightest inner loop that was iterating through 1000 items. You can do this in a way that it interoperates with the auto-instrumentation. The libraries from OTel are pretty easy to use, again, depends on your language, depends on the language support and community, and things like that. They’re pretty easy to use and are getting easier. One of the hardest parts is actually just learning the vocabulary. You have to learn to think like OTel. Once you learn to think like OTel, then it becomes a lot easier to implement the OTel part.
Just as a way of illustration. This is just a quick snippet of JS Node code. We just have to require the OpenTelemetry API, that was pretty easy. Then we can start a span here on line eight. We get a tracer. A tracer is a thing that generates traces. You get a tracer, you give it a name, and then you start a span. Then after you do the work you want to do, you end the span. When you have a nested situation, instead of getting a new tracer when you make a call, you’re going to start nested span, and pull in. It will reach out into the system and say, what’s the current span? Then make a child of that current span. That’s basically all you need to do. There are a couple lines of code you wrap around the things you care about. If your language has the concept of some defer or destruction, then it’s pretty easy to do it in one or two lines right next to each other. You start span, it automatically ends depending on the function, that kind of thing. Basically, this is a straightforward way to do this. The fun part is, this can work client side, too. You can do this in your clients, for mobile apps, for web apps. You can give those applications the ability to start a span and send that span, and watch what’s going on in your user data. This isn’t RUM or analytics. You’re not at the level yet, but I think we’re going to get there, of being able to replace all your RUM tools for monitoring user behavior. Theoretically, you could do that within the context of OpenTelemetry, you’re just probably going to, today, have to roll most of it your own self. We’ll get there, though.
What About Async?
Pretty much everything I’ve talked about so far has been mostly synchronous. In an async world, you’re doing either something like Kafka where you’re putting things into a queue and then pulling them out sometime later. Or you’re just doing async function calls. Your root span is up here and it’s done. Meanwhile some other task is over here, filling in the rest of the screen. Async architecture is actually a really good model for a lot of things. It can be more resilient. You’re not making users wait for things. You’re not making processes wait for things. They add complexity, though, in terms of thinking and your mental model of the system, depending on so many things having to do with the languages you’re working in, and what exactly you’re trying to do. If you’re used to thinking about debuggers, “I just spun up this process, and I’m going to put a breakpoint in the thing that started the process.” That does no good at all for the process that’s happily running in the background while your debugger has stopped. How do you see what’s going on? The way to think about it is not so much about hierarchy, but about cause and effect. What caused this, and what was the effect of it? This is where you apply context. This is where the trace is about adding context to that trace, where did it come from? What was the source of this information? Adding metadata to this information.
Tracing isn’t still ideal, because it’s not necessarily about cause and effect. Tracing is largely built around this idea of a hierarchy, but it’s still better than logs. If you’re talking about stuff that’s happening quickly, it’s async, but it’s almost the same thing, then you’re probably fine with just saying, start a trace on that receive. Then this stuff that happens over here, it isn’t contained within the parent, but it’s still related to the parent. Your biggest question is deciding what it is you’re going to have as your parent-child relationship. Is dequeue a child of enqueue or is it a child of your original request. That’s just for you to decide, and whatever you want to think about. It’s fine either way. If you have something like a Kafka, where that thing might be sitting in Kafka for seconds or days, depending on your queuing and stuff like that, you don’t really want to try to connect those traces. That’s going to be really hard to think about. A trace that lasts a million seconds is not really easily analyzed. You’re better off using what’s known in OpenTelemetry as span links. You have two traces here, receive is doing its thing, and then it’s handing it off to Kafka. Sometime later, the dequeue comes along and it processes that result. As a part of the request, we included the metadata about the trace that caused it. Now in the dequeue request, we have the information we need to put a link back to the source trace. Then our tooling can connect those for us. We can get from here, “This one failed, why did it fail? Let’s go back and look at what caused it.”
OTel Baggage
The way information flows between processes in OTel is called baggage. There are standard headers, and this service over here can make a request, and this service over here can receive that request. The headers will contain the information from the source request, namely, the trace ID, the parent ID, that kind of thing. Various OTel libraries will pick that stuff up automatically, which is great until it surprises you. Because they’ll also bundle it automatically. Now you make a call to a third-party API, or worse still, your customer makes a call into your API. They included their baggage, and you picked it up automatically and now your trace is based on somebody else’s root span. You need to think about baggage from the point of view of it’s easy to start up, it’s easy to use within your network. Once it leaves your network, you probably want to filter it out either outgoing or make sure that it doesn’t leak into your systems. You also need to be aware of this with things like if you’re using one of the mesh management tools like Istio. We had one customer who was saying, how come my traces have 11 million spans? It was because your mesh system was injecting the same span ID into everything. Yes, that can be fun. Tests are systems too. You’re going to want to filter that stuff out, but it works across services. Again, it’s a standard. This is part of what I’m trying to sell you on here. Using the standard gives you all of this stuff. It comes along, and you can understand it as you need to. It’s there. It’s available. It’s in the tooling. It’s being thought about and being improved over time.
Architectural Strategies
Let’s bring this back to architecture, because one of the things about architecture is we’re talking about planning. We’re talking about construction. We’re talking about maybe new ideas. It’s not always about things we already have. That may be architecture we deal with, but sometimes you want to think about it from the beginning. Part of the question is, when do we start thinking about it? First of all, any time you’re thinking about it, I do think you want to be planning for observability. You want to be thinking, how do I know? How do I know this is true? Within my company’s GitHub template, there’s a little line in there that says, how will we know this is working in production? That’s meant to prompt you to say, what are you building into this pull request for observability to make sure the thing you say it does, it actually does. Plan for it. One of the things that’s interesting about any tracing architecture is the problem of, how do you propagate the information within your process, and within your application? This is one of those places where I will hide my software engineering hat and say, yes, global variable, that’s actually a pretty good model. In Go, we stick it on the context, typically. You have a context that gets passed around anyway, and so now it has the active trace to the context. The call can say, give me the current context, and then make a child span. You see that pattern in a lot of the different languages in a lot of the different frameworks. There’s some global floating somewhere that’s tracking this stuff for you. Don’t freak out, it’s ok.
The mistake I talked about earlier, where we had a limitation of, we’re running in that thing, that was detectable just on my desktop. I was sending traces from the app that I was running on my own machine, and I’m just looking at one trace. I’m not looking at traces in volume, and I’m not looking at main performance at that point. I was just looking at, what is this particular instance of this particular application doing right now? That’s valuable. It’s a debugging tool. It’s a more powerful debugging tool than starting a debugger and trying to walk through the logic. Because that debugging tool is not going to show you any kind of parallelism or interaction. This is the exact problem that goes away when you try to study it in detail, because you’re not sending massive quantities of duplicate data at it. Working with observability from the very beginning of a project can be valuable. I worked on another project where one of the first things I did was like, you stand up a dummy app, and you add some dummy observability. You can do it in OpenTelemetry. You can do it with collector. You can do it with the trace viewer that runs on the command line.
Observability Strategies
Telemetry is cheap. It’s basically cheaper than engineers anyway. Err on the side of recording too much and then trim it down. You can trim it down either at source or you can trim it after the fact with a sampling strategy. Send it all to a local collector, like start up a collector and run it and then you can have everything go there and then you can forward it. Then your plan for deployment is that you have a collector running in your network, but you can also do that locally very easily. I’m also here to say, deemphasize dashboards. Dashboards don’t tell you enough. Get the ability to ask the question you really want to know. Don’t ask these binary questions of just, is it up or is it down? Expect degradation and be able to have enough information to detect degradation when it happened. My coworker Fred, said the other day that p95 isn’t going to show you that. We were looking at a thing where you had a small number of users with a spike in duration. Your average query time is going to be fine, but you’ve got a few customers who are having a bad day, that won’t show you with metric.
The Collector (Receivers, Processors, Exporters)
Let’s talk about the collector. Collectors have receivers. Receivers collect data. They can either be passive, which means they are an endpoint, and you have systems that point at them and send to them, that’s the way OpenTelemetry normally works. You have a OTel receiver, and you send it OTel data. They can also be active collectors which reach out and pull it out of the cloud or out of a S3 bucket or whatever it might be. The collector can do that, too, it can be active at receiving data. The point is that it’s getting it into a pipeline. Basically, the job of the collector is to build a pipeline or multiple pipelines for data. There are 75 or 100 plugins supported for collector, and there are probably more that people have written for themselves. Processors are the next step in the pipeline. After you’ve collected the data, you can run it through processors, and there are all sorts of processors that can do aggregation of data. They can filter it and sample it and redact it, and take out PII, and that kind of thing. Or remap it, this thing over here sends telemetry and the field name is wrong, so I’m going to change the field name so that my upstream systems all get the same value. Then, finally, the exporters take all the post-processed data and they can send it places. You can send it to your local Prometheus instance. You can send it to your third-party vendors. Some vendors have custom exporters that are designed to transform things into whatever format they want. Some vendors just accept OTel. In either case, you’re just going to set it up. You can also save it to a file. You can send it to a database. There’s a bunch of different exporters available.
Sampling
Sampling is the idea that, ok, now I have a firehose, I probably don’t need the entire firehose. The idea is you send the full firehose to the collector, and then you can filter it out. The simplest model of sampling is pure mathematical deterministic sampling. You just use the trace ID as a random number. Actually, it’s defined to contain at least 7 bytes of randomness. Now you can choose based on that trace ID, some fraction that you’re going to keep, and you will get consistent sampling across your system. Dynamic sampling is something that is less common, less possible, but my employer does. That’s what I work on personally, is this idea that you can keep the stuff that matters to you, and drop the stuff that doesn’t matter enough. There’s a Tolstoy, every happy family is alike, but every unhappy family is unhappy in its own way. You keep all the unhappy ones, and you keep only a small fraction of the happy ones. That’s what that is useful for. That’s collector.
Service Level Objectives (SLOs)
The other thing that’s really interesting about telemetry is the idea of using it in real time to keep track of what’s going on in your production systems. This is where you establish service level objectives. Here, what you’re doing is you’re measuring the performance of your system from the point of view of an observer who cares about it, like a customer. You’re ideally measuring experience. Response time, for example, is a good service level indicator. Then you can filter that using like a binary filter. The response time was under 2 seconds, therefore it’s good. If it’s over 2 seconds, then it’s not good. That’s a service level objective when you take that number and say, ok, I want that number to be 99.9% over a month. Now you can look and you could say, what’s my error rate? My error rate is, things are performing well, things are going great. That thing is running along at 99%, 100% of my capacity for the month, but now we have a bad time and my database slows down. Now I start having long response times that SLI starts triggering, and I’m burning through an error budget. Now you can warn yourself, you can say, I’m going to burn through this budget in the next 24 hours, I probably better work on this tomorrow. Or if it says, you’re burning through your budget and you’re going to be gone in four hours. Ok, I have a real problem, wake somebody up. That’s what SLOs can do for you. It lets you have a budget for your failure. Again, this is about resilience reliance. This is not about not having failures, it’s about reacting to them appropriately, in a way that’s sustainable for us as humans.
Working In a Legacy System
When you’re working in legacy code, when you’re working in a legacy system, where you start is start with a collector. Give yourself a place to send the stuff you’re about to send, then you add observability incrementally. If you can apply an easy button, say you’re working on a legacy Java code base, you can go and you can turn on that auto-instrumentation for Java with like one line and you deploy. Now you’re going to start getting stuff. Maybe you’ll get too much stuff, but you can adjust that. You can generate metrics and traces. You can use that information to pull out a service map. Now it’s like, ok, that took a long time but I don’t know why because I can’t see inside the code. Now you can go in and add explicit spans for the things that are mysterious, the things you have questions about. We have a little Slack channel called the Swear JAR, in our telemetry team, and basically, they post there whenever they wish they had something they don’t have. Somebody who’s got a couple of hours in between their on-call shifts, or whatever, can go in and say, I can add telemetry here. Keep track of things you’re curious about that you don’t have the answers to. Again, the question you want to ask is, how do I know this is working in production?
Architect for Observability
This is what I mean about architecture, you’re architecting for observability. It doesn’t change the way you architect the rest of your system. It means that you need to think about it throughout your process from the beginning to the end. Nearly everything is important enough to decorate telemetry with it. The only reason you might not want to is because it’s so high performance or so core. Basically, if you develop the muscle of adding telemetry, as you’re in there working, you’re going to appreciate that as you go. Again, you pass the metadata along when you make calls across processes, across functions, and things like that. Then use the standards. OTel is there. OTel is going to get better. Keep going. Record enough information. Seriously, just use OTel. It’s still evolving. It’s not perfect yet, but it’s getting there. If you want to come along, my team, my company goes to a couple of dozen meetings a week, and we’re participating in all of these different things. There’s a bunch of different things, your language of choice, your platform of choice. There’s a lot of places where you can help. If you have some bandwidth to do some open source work, OpenTelemetry is a great place to think about it.
Infrastructure is Architecture
Your infrastructure is your architecture. Your business logic is your architecture, but so is your infrastructure. Put it in a place you can control it, and distribute it from there. You can start today. You can literally make something work.
Questions and Answers
Participant 1: We started looking into observability and introducing traces to Kafka processing. One of the things that we saw that it’s very challenging when we process batches. If you process one by one, it makes sense. If you start processing the batch of 1000 messages, and then the next consumer also processes 1000 messages, it starts to be really challenging, and we didn’t see literature that talks about it.
Quirk: One of the things that we recommend is like, you get those batches, and if you try to make the batch a root span, then you might end up with a 4-hour root span, which is really hard to track. One of the techniques we tend to recommend people use is that you put a limit on your batch size and duration. You set things up, so, essentially, I’m going to process until I get to 100 traces, or until I get to 5 minutes, or whatever that might be. Then you end that trace, and you start a new trace, so that you have smaller chunks of traces, but then decorate all of those traces with your batch ID. Your batch ID is not your trace ID. Your batch ID is found in all of those. You can do a query and say, show me everything from this batch. You’ll find that there are 4, 5, 10, 1000 sequential traces within that batch, each of which handles a bucket of related things. It’s a way to make sure that the telemetry keeps flowing, that you’re getting the information along the way. It’s a very custom decision you have to make about doing that. That’s the general technique that we found.
Participant 2: [inaudible 00:47:45].
Quirk: It depends a lot on your programming environment. It’s changing rapidly. For traces, things are pretty mature. In most languages, it works pretty well. For metrics, metrics is still stabilizing. There are a couple of languages that are less good than others. I was tearing what little hair I have left out the other day over trying to do some OTel metrics in Go. That still needs work. Logs are still further behind. In particular, when we start talking about things like sampling logs and stuff like that, that’s not really there yet. It’s still an evolving process. I still think it’s worth investing in it now and doing what you can with the tools you have. Start with tracing, get that working. Maybe you want to wait a little bit on that trace.
See more presentations with transcripts
MMS • RSS
![]() MongoDB, Inc. (NASDAQ:MDB – Get Free Report) was the target of unusually large options trading on Wednesday. Investors purchased 23,831 put options on the stock. This represents an increase of approximately 2,157% compared to the average daily volume of 1,056 put options.
MongoDB, Inc. (NASDAQ:MDB – Get Free Report) was the target of unusually large options trading on Wednesday. Investors purchased 23,831 put options on the stock. This represents an increase of approximately 2,157% compared to the average daily volume of 1,056 put options.
MongoDB Price Performance
Shares of MDB stock opened at $393.15 on Thursday. The firm has a market cap of $28.38 billion, a P/E ratio of -148.92 and a beta of 1.23. MongoDB has a fifty-two week low of $179.52 and a fifty-two week high of $442.84. The business’s 50 day moving average price is $394.98 and its 200-day moving average price is $380.82. The company has a debt-to-equity ratio of 1.18, a quick ratio of 4.74 and a current ratio of 4.74.
MongoDB (NASDAQ:MDB – Get Free Report) last released its earnings results on Tuesday, December 5th. The company reported $0.96 EPS for the quarter, beating analysts’ consensus estimates of $0.51 by $0.45. The company had revenue of $432.94 million during the quarter, compared to analysts’ expectations of $406.33 million. MongoDB had a negative return on equity of 20.64% and a negative net margin of 11.70%. The firm’s revenue for the quarter was up 29.8% compared to the same quarter last year. During the same quarter last year, the business posted ($1.23) EPS. On average, equities research analysts anticipate that MongoDB will post -1.64 earnings per share for the current year.
Analysts Set New Price Targets
MDB has been the subject of a number of recent analyst reports. Piper Sandler upped their price objective on MongoDB from $425.00 to $500.00 and gave the company an “overweight” rating in a research note on Wednesday, December 6th. Capital One Financial upgraded MongoDB from an “equal weight” rating to an “overweight” rating and set a $427.00 price target for the company in a research note on Wednesday, November 8th. Bank of America started coverage on MongoDB in a research note on Thursday, October 12th. They set a “buy” rating and a $450.00 price target for the company. Mizuho increased their price target on MongoDB from $330.00 to $420.00 and gave the stock a “neutral” rating in a research note on Wednesday, December 6th. Finally, UBS Group reiterated a “neutral” rating and set a $410.00 price target (down previously from $475.00) on shares of MongoDB in a research note on Thursday, January 4th. One analyst has rated the stock with a sell rating, three have assigned a hold rating and twenty-one have given a buy rating to the stock. Based on data from MarketBeat, MongoDB currently has an average rating of “Moderate Buy” and a consensus target price of $430.41.
View Our Latest Analysis on MDB
Insider Buying and Selling
In related news, CEO Dev Ittycheria sold 100,500 shares of the company’s stock in a transaction on Tuesday, November 7th. The stock was sold at an average price of $375.00, for a total transaction of $37,687,500.00. Following the completion of the sale, the chief executive officer now owns 214,177 shares in the company, valued at $80,316,375. The sale was disclosed in a filing with the Securities & Exchange Commission, which is available at this link. In related news, CEO Dev Ittycheria sold 100,500 shares of the company’s stock in a transaction on Tuesday, November 7th. The stock was sold at an average price of $375.00, for a total transaction of $37,687,500.00. Following the completion of the sale, the chief executive officer now owns 214,177 shares in the company, valued at $80,316,375. The sale was disclosed in a filing with the Securities & Exchange Commission, which is available at this link. Also, Director Dwight A. Merriman sold 1,000 shares of the company’s stock in a transaction on Wednesday, November 1st. The stock was sold at an average price of $345.21, for a total value of $345,210.00. Following the sale, the director now owns 533,896 shares of the company’s stock, valued at approximately $184,306,238.16. The disclosure for this sale can be found here. Over the last 90 days, insiders sold 147,029 shares of company stock worth $56,304,511. 4.80% of the stock is owned by corporate insiders.
Institutional Inflows and Outflows
A number of large investors have recently added to or reduced their stakes in the stock. Simplicity Solutions LLC grew its holdings in shares of MongoDB by 2.2% in the second quarter. Simplicity Solutions LLC now owns 1,169 shares of the company’s stock worth $480,000 after acquiring an additional 25 shares during the period. AJ Wealth Strategies LLC grew its holdings in shares of MongoDB by 1.2% in the second quarter. AJ Wealth Strategies LLC now owns 2,390 shares of the company’s stock worth $982,000 after acquiring an additional 28 shares during the period. Insigneo Advisory Services LLC grew its holdings in shares of MongoDB by 2.9% in the third quarter. Insigneo Advisory Services LLC now owns 1,070 shares of the company’s stock worth $370,000 after acquiring an additional 30 shares during the period. Assenagon Asset Management S.A. grew its holdings in shares of MongoDB by 1.4% in the second quarter. Assenagon Asset Management S.A. now owns 2,239 shares of the company’s stock worth $920,000 after acquiring an additional 32 shares during the period. Finally, Veritable L.P. grew its holdings in shares of MongoDB by 1.4% in the second quarter. Veritable L.P. now owns 2,321 shares of the company’s stock worth $954,000 after acquiring an additional 33 shares during the period. Hedge funds and other institutional investors own 88.89% of the company’s stock.
About MongoDB
MongoDB, Inc provides general purpose database platform worldwide. The company offers MongoDB Atlas, a hosted multi-cloud database-as-a-service solution; MongoDB Enterprise Advanced, a commercial database server for enterprise customers to run in the cloud, on-premise, or in a hybrid environment; and Community Server, a free-to-download version of its database, which includes the functionality that developers need to get started with MongoDB.
See Also
Receive News & Ratings for MongoDB Daily – Enter your email address below to receive a concise daily summary of the latest news and analysts’ ratings for MongoDB and related companies with MarketBeat.com’s FREE daily email newsletter.
MMS • RSS

NoSQL Professional Market 2031 Growth Drivers along with Top Brands Basho Technologies, Apache, Oracle, SAP, AranogoDB, MarkLogic, etc
The Global NoSQL Professional Market Report is a highly valuable resource that delivers strategic guidance to a broad spectrum of industry stakeholders. Its distinction lies in the rigorous and comprehensive research methodology it employs, aiming to empower businesses with the knowledge required to make well-informed decisions and unlock their growth potential within the fiercely competitive NoSQL Professional market.
The development of this report involved a methodical approach, combining primary and secondary research techniques. The process encompassed data mining, expert interviews, and an exhaustive analysis of market trends. Advanced tools and methodologies, including market segmentation and Porter’s Five Forces analysis, were employed to ensure the precision and reliability of our findings.
Request a sample report @ https://www.orbisresearch.com/contacts/request-sample/6746558
Key Players in the NoSQL Professional market:
Basho Technologies
Apache
Oracle
SAP
AranogoDB
MarkLogic
Redis
CloudDB
Google
MarkLogic
MapR Technologies
Couchbase
DataStax
Aerospike
Microsoft
Neo4j
MongoLab
IBM Cloudant
Amazon Web Services
MongoDB
RavenDB
Our research findings have unveiled a rapidly expanding market with a substantial increase in value. We have conducted a thorough examination of the dynamics propelling market growth, the obstacles impeding it, and the opportunities waiting to be harnessed. Looking ahead, we anticipate a significant increase in market value by the end of the forecast period. The compound annual growth rate (CAGR) underscores a consistently upward trajectory, promising sustained profitability for market participants in the long run.
What truly sets this report apart is its commitment to providing more than just a global overview. It offers detailed regional assessments, meticulously analyzing the unique market environments, prevailing trends, and growth prospects in each region. Our analysis delves deep into regional market dynamics, considering key players, market size, market share, and the factors influencing growth. These regional insights equip businesses with the knowledge needed to uncover promising opportunities and devise effective market entry strategies, ultimately giving them a competitive edge.
NoSQL Professional market Segmentation by Type:
Key-Value Store
Document Databases
Column Based Stores
Graph Database
NoSQL Professional market Segmentation by Application:
Retail
Online gaming
IT
Social network development
Web applications management
Government
BFSI
Healthcare
Education
Others
The beneficiaries of this report encompass a wide array of industry stakeholders, including market participants, investors, researchers, and consultants. It serves as an indispensable source of information on market dynamics, the competitive landscape, emerging trends, and growth potential. By delivering reliable and precise market data, this research significantly aids in decision-making. Whether organizations are entering the market as newcomers or are well-established players, this study provides them with a comprehensive understanding of market intricacies, risk assessment, opportunity evaluation, and the development of robust growth and sustainability strategies.
In comparison to other reports in the market, the Global NoSQL Professional Market Report stands out by offering unique advantages to its clients. It provides clients with a comprehensive and accurate analysis of the market, empowering them to make well-informed business decisions. Our research equips readers with essential information about market trends, competitive dynamics, and growth prospects, enabling them to identify promising avenues for expansion and investment. With its thorough research and reliable statistics, this study assures clients of a competitive edge and the potential for long-term profitability.
Direct Purchase the report @ https://www.orbisresearch.com/contact/purchase-single-user/6746558
The Global NoSQL Professional Market Report encompasses a diverse range of topics and sections, ensuring a comprehensive examination of the market landscape. It includes an overview of the market, segmentation, competitive analysis, market dynamics, regional insights, industry trends, growth opportunities, market size, drivers and constraints, emerging trends, investment possibilities, product innovations, mergers and acquisitions, regulatory frameworks, and strategic recommendations. This all-encompassing coverage guarantees that clients gain a well-rounded understanding of the market landscape, facilitating well-informed decision-making.
Lastly, the global NoSQL Professional market has not been immune to the profound impacts of the COVID-19 pandemic. Our research explores how the pandemic disrupted supply chains, altered consumer behavior, and reshaped market dynamics. It provides insights into the challenges faced by market participants and offers resilient solutions. Furthermore, the report delves into emerging trends and post-pandemic opportunities, shedding light on the adaptive measures adopted by industry players. It equips businesses with the knowledge and strategies necessary to navigate and thrive in the market during and after the COVID-19 crisis, ensuring resilience and growth in the face of adversity.
About Us
Orbis Research (orbisresearch.com) is a single point aid for all your market research requirements. We have a vast database of reports from leading publishers and authors across the globe. We specialize in delivering customized reports as per the requirements of our clients. We have complete information about our publishers and hence are sure about the accuracy of the industries and verticals of their specialization. This helps our clients to map their needs and we produce the perfect required market research study for our clients.
Contact Us:
Hector Costello
Senior Manager – Client Engagements
4144N Central Expressway,
Suite 600, Dallas,
Texas – 75204, U.S.A.
Phone No.: USA: +1 (972)-362-8199 | IND: +91 895 659 5155
Email ID: sales@orbisresearch.com
MMS • RSS

Data analytics developments, including AI-powered analytics, that we’ll see in 2024 offer significant benefits for expanding our knowledge and making better data-driven decisions.
Data analytics examines, cleans, transforms, and interprets data to uncover valuable insights to advance the organization’s business plan.
Data analytics is a technology that has become more capable during many years of development. It’s become more prominent in recent years as organizations have embarked on digital transformation. One of the benefits of digital transformation is the creation of more digital data to analyze.
Here’s more of what’s in store for data analytics in 2024. To read the previous ten predictions, click here.
1. Data storytelling
In 2024, compelling data storytelling will become increasingly important as organizations:
- Strive to make better data-driven decisions.
- Face more complex decisions that are difficult to communicate well.
- Operate in a more competitive environment and a more demanding social landscape.
Data storytelling is communicating data insights and related recommendations clearly, concisely, and engagingly.
2. Advanced data visualization
Data visualization makes data more engaging and informative. By comparison, spreadsheet data is tedious and challenging to interpret. The software has improved gradually over time.
In 2024, we can expect continuing ease-of-use advances in data visualization functionality.
3. Stream processing
Until recently, many organizations have been unable to process the vast amounts of data produced by IIoT devices in plants and customer mobile devices in real time. The likely outcomes were misleading analysis, no-longer relevant recommendations, and unused data.
In 2024, with new solutions, real-time stream processing and analytics are now possible.
4. Augmented analytics
Augmented analytics leverages the power of machine learning and AI to improve data analysis. In 2024, end-users will start to use natural language processing (NLP) to define queries. This capability will further simplify extracting information from data sources, making end-users more productive.
5. Data orchestration
The widely used file storage infrastructure has not kept pace with increasing data volumes and advances in data analytics. Many solutions try to manage storage silos and distributed environments by moving file copies from one place to another and losing control over versions and data integrity.
Expect to hear more about data orchestration in 2024, because it helps organizations integrate data into a single namespace from different silos and locations without losing control. It automates data placement when and where it’s most valuable, making it easier to analyze and derive insights.
6. Object stores
There are definite challenges with maintaining application performance when tens of petabytes of data must be accessed and processed for various applications, including data analytics. Traditional SAN/NAS data management solutions cannot solve those performance challenges.
Maintaining performance requires the characteristics of modern, highly performant object stores. More demanding performance requirements in 2024 are causing:
- AI/ML applications to use object stores.
- Most databases (DBMSs) to become more object storage-centric.
7. SQL vs. NoSQL
In 2023, the NoSQL community finally acknowledged that enterprise IT demands standards and quit talking about doing away with SQL. The NoSQL community recognized:
- The value and simplicity of SQL as a standard and powerful query language for data analytics and many other applications.
- Their inability to achieve consensus on another standard syntax was not helping their alternative goal.
In 2024, every NoSQL database vendor is adding a SQL or SQL-like interface to their product to appeal to enterprises. NoSQL databases manage the following data structures:
- Key-value pair.
- Document-oriented.
- Column-oriented.
- Graph-based.
- Time series.
8. Data fabric
In 2024, more mid-to-large organizations will build out their data fabric to improve data reliability, access and integration for data analytics.
A data fabric is an end-to-end data management solution for an organization. It consists of these components:
- A defined data architecture.
- Selected data management, integration, analytics and visualization software.
- A unified, consistent end-user experience.
- A priority on sharing data to minimize data anomalies and duplication.
- Real-time data access where necessary.
9. Vector databases
Expect to hear more about vector databases in 2024. Vector databases are designed to process large volumes of data with associated semantic content efficiently. Vector databases are advantageous when data analysis applications involve large language models (LLMs), generative AI, or semantic search.
A vector database is designed to efficiently store, index, manage and retrieve massive quantities of high-dimension vector data. Vector databases are particularly suited to conduct approximate nearest neighbour (ANN) searches rather than exact match searches. Vector data consists of mathematical representations of features or attributes. Each vector is defined with a certain number of dimensions, ranging from tens to thousands. The complexity and granularity of the available data determine the number of vectors. Dimensions represent patterns, relationships, and underlying data structures that enhance understanding of the data’s semantic content.
10. Single-pane-of-glass
In 2024, advanced data integration tools will extend their functionality to create the illusion of integration beyond IT-managed structured data. Single-pane-of-glass integration will include IIoT, geospatial, partner, and external data.
What ideas can you contribute to help organizations achieve more benefits from data analytics? We’d love to hear your opinion. You can share that with us below. Select the checkmark for agreement or the X for disagreement. In either case, you’ll be asked if you also want to send your comments directly to our editorial team.
MMS • RSS
Thanks to rapid growth in cloud computing and artificial intelligence (AI) applications, software stocks are all the rage these days. But while some software stocks still have plenty of room for expansion, others may have already passed their peak growth years. So, how should investors identify the best software stocks to buy right now?
Well, analysts at Baird recently named their top software stock picks for 2024 – and based on the consensus among other Wall Street experts, it looks like experts have high hopes for software stocks Snowflake (SNOW), MongoDB (MDB), and Dynatrace (DT), in particular.
All three of these names have scored bullish ratings from analysts, with above-average growth projected for the year ahead. So, let’s dive into why SNOW, MDB, and DT are worth considering for your portfolio this January.
Snowflake Stock: The Data Cloud Powerhouse
Snowflake Inc. (SNOW) is a cloud-based data warehousing company that provides a platform for data storage, processing, and analytics. The company’s platform allows businesses to manage and analyze large amounts and diverse types of data across various cloud platforms, including Amazon (AMZN) Web Services (AWS), Alphabet’s (GOOGL) Google Cloud Platform, and Microsoft (MSFT) Azure.
Snowflake stock has performed well over the last 52 weeks, delivering a gain of 45%.
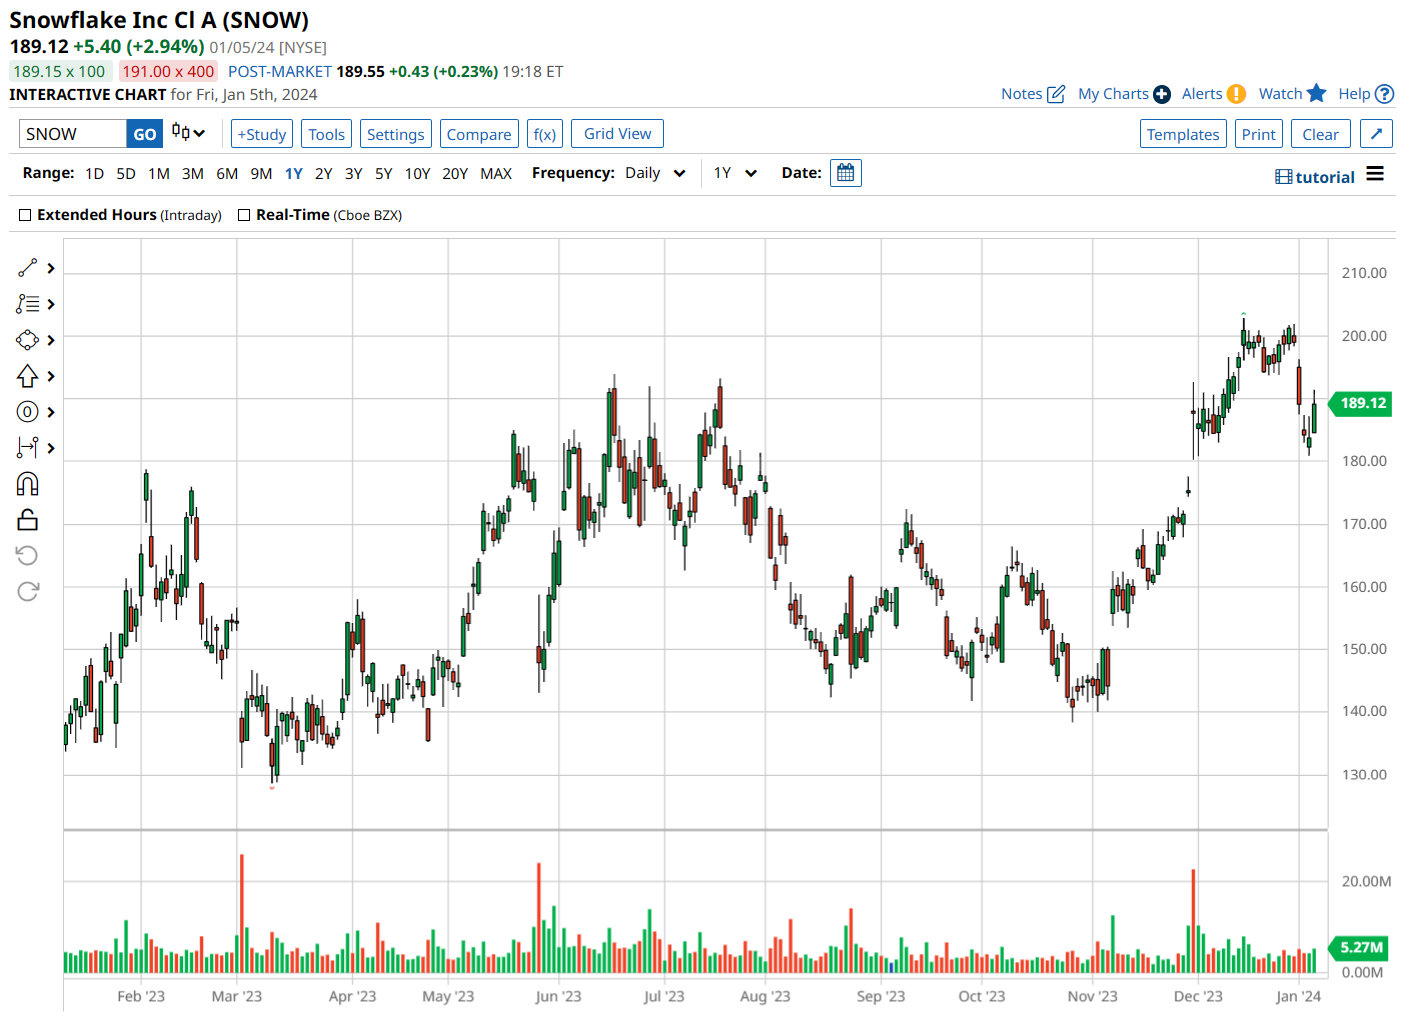
With a market cap hovering around $64.83 billion and an enterprise value of $63.89 billion, Snowflake is the largest software stock on our list. Via its AWS partnership, Snowflake’s software has been leveraged by high-profile customers like Disney Parks, positioning the company well to leverage the growing generative AI market.
Snowflake also has an eye on growth, scooping up Samooha and its “cross-cloud” data collaboration suite to beef up its own set of tools.
Financially, Snowflake’s been on a roll, too. Their third-quarter earnings for fiscal 2024 were a hit, with revenue up by 31.8% year-over-year to $734.2 million, and earnings per share (EPS) at $0.25, which was way ahead of the expected $0.16.
Looking ahead, analysts are projecting forward revenue growth at 43.9%, well above the sector median of 7.8%.
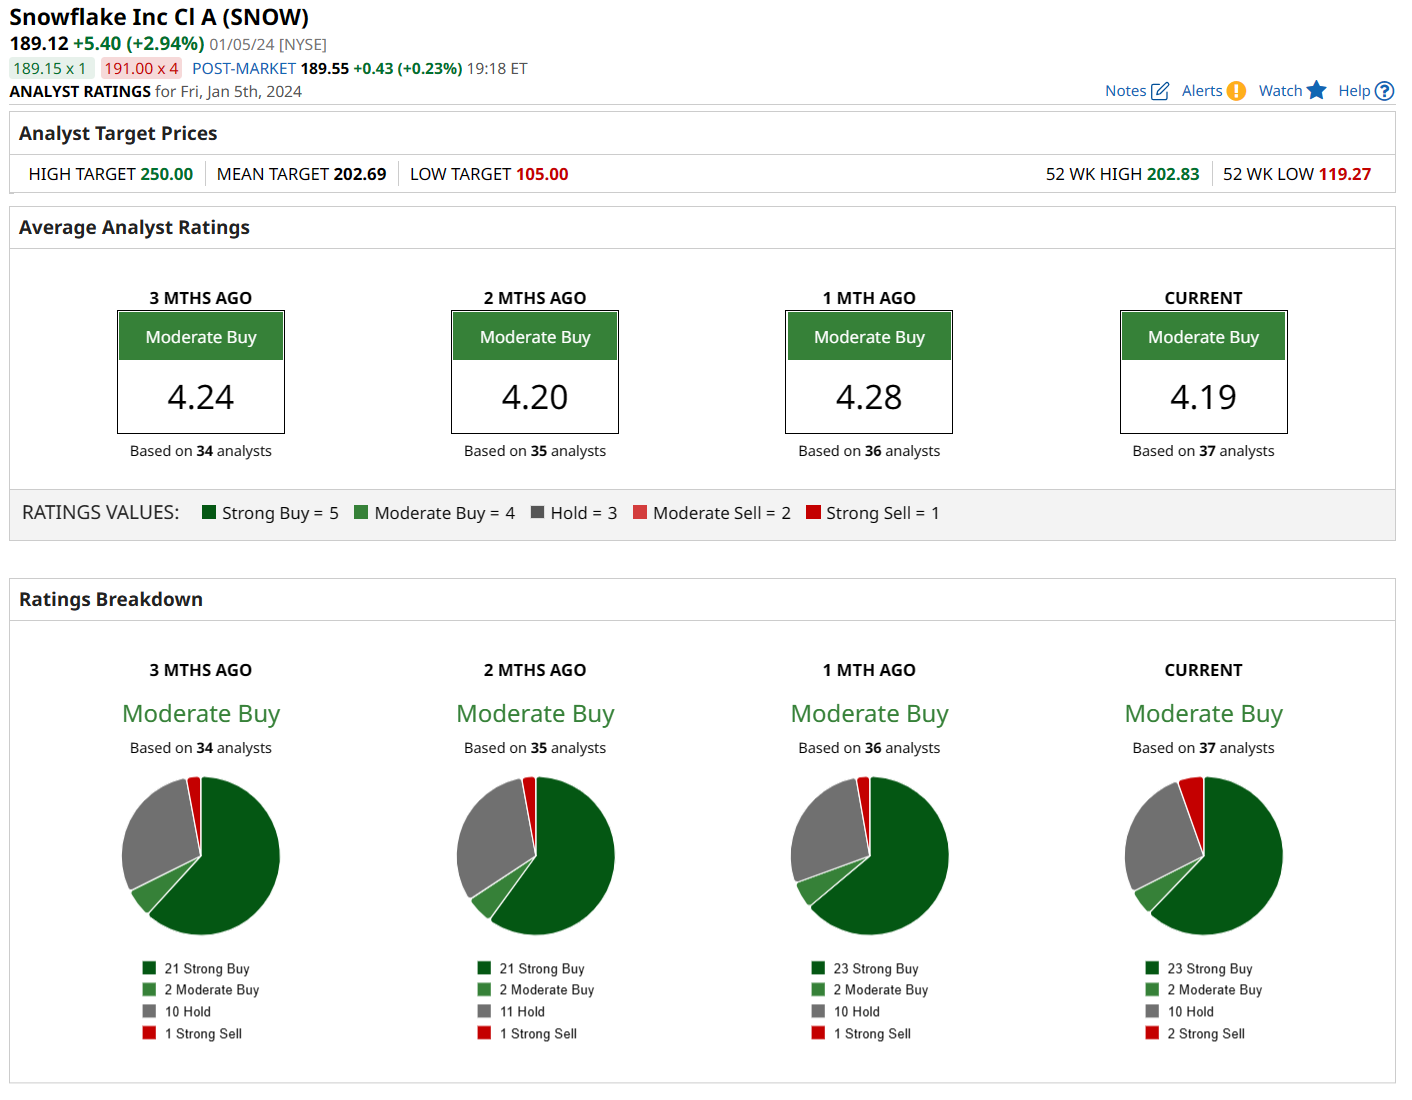
Out of 36 analysts following SNOW, 23 are saying “strong buy,” a couple are going with “moderate buy,” 10 are on the fence with “hold,” and just two are not feeling it with a “strong sell.” The average price target is $203.72, just 1.9% above current levels, but Baird has a higher price target of $215.
MongoDB Stock: The Flexible Database Solution
MongoDB Inc. (MDB) is a provider of a general-purpose database platform that can handle various types of data and applications. MongoDB’s platform is based on a document-oriented model that allows for flexibility and performance.
Shares of MDB have more than doubled over the past 52 weeks, up about 116% over this time frame. However, the stock has pulled back about 11% from its 52-week high.
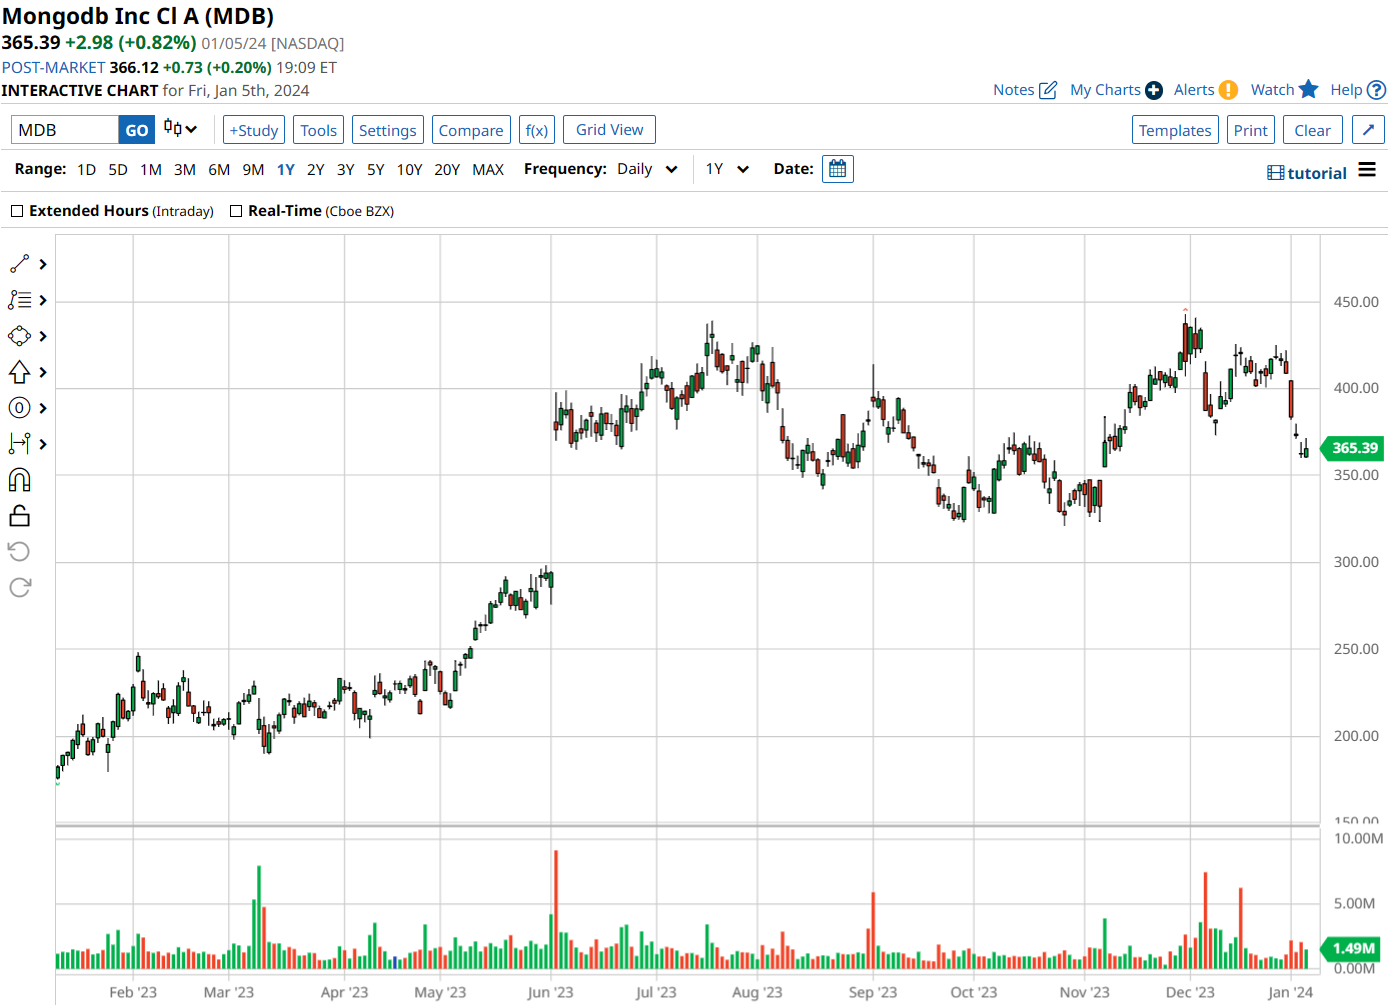
The recent pullback was prompted by MongoDB’s third-quarter earnings. While MDB beat Wall Street’s expectations on Q3 revenue and EPS – and offered stronger-than-expected revenue guidance for Q4 – investors sold the stock in response to softer-than-anticipated customer growth and calculated billings.
Analysts are still pretty bullish on MongoDB’s long-term prospects. Forward revenue growth is projected at 32.3%, roughly four times the sector median.
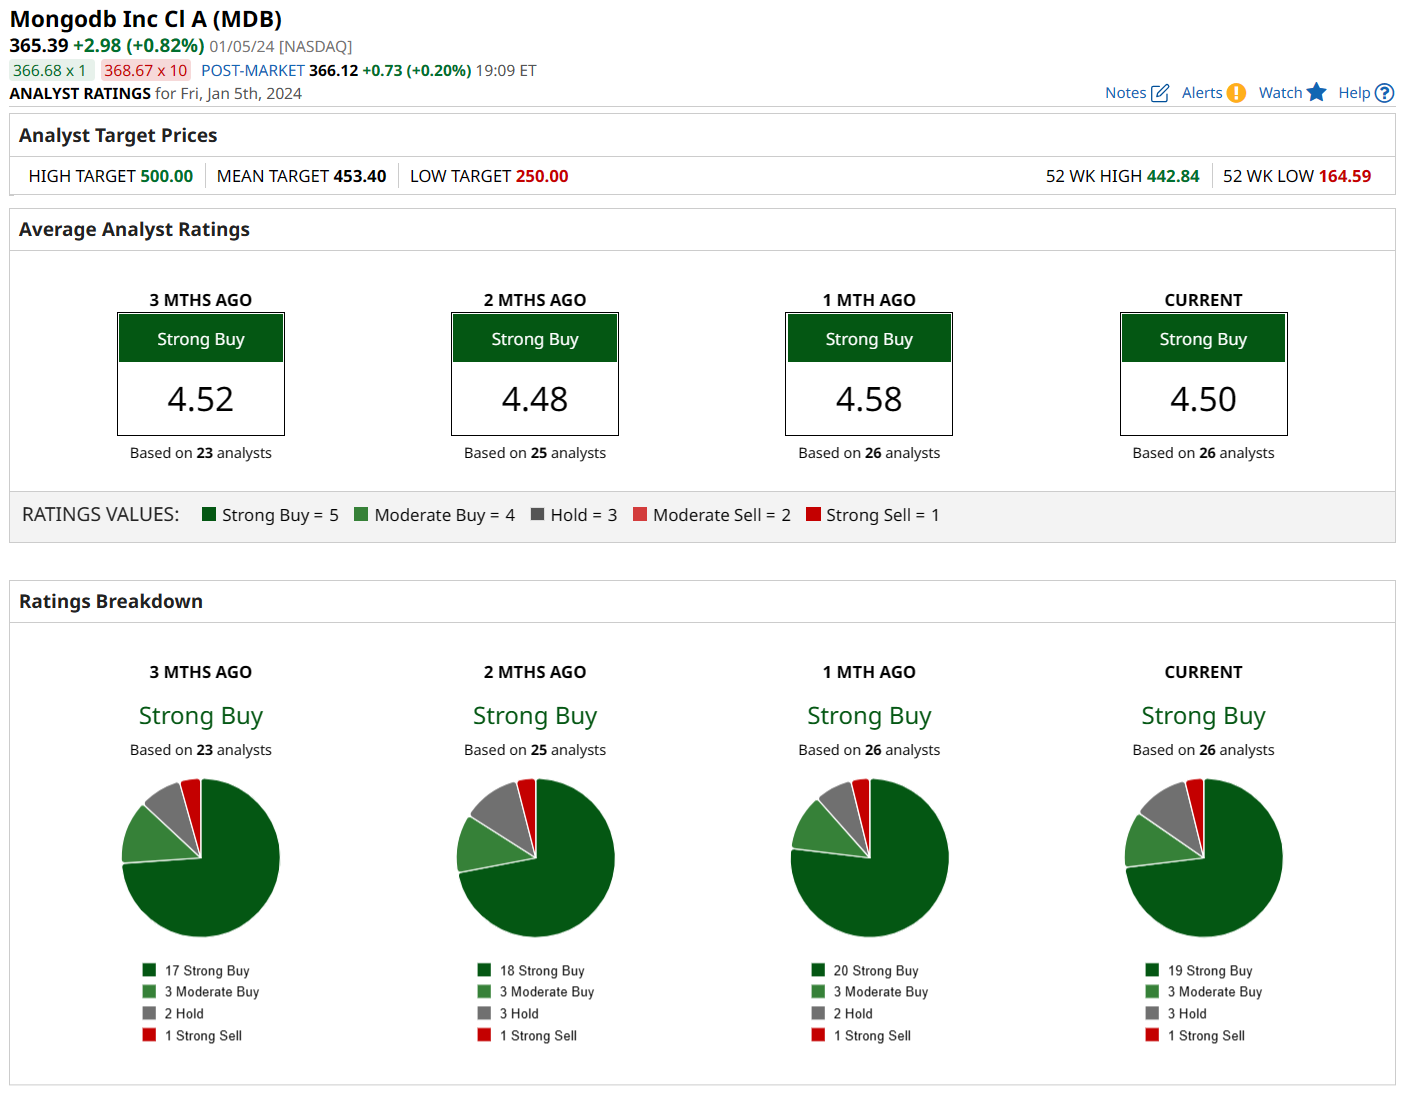
Out of 26 analysts, 19 are saying “strong buy,” three are going with “moderate buy,” three are on the fence with a “hold,” and one is recommending “strong sell.” The average price target is $451.20 – right in line with Baird’s $450 – suggesting there’s room for the stock to rally over 14% from its current price.
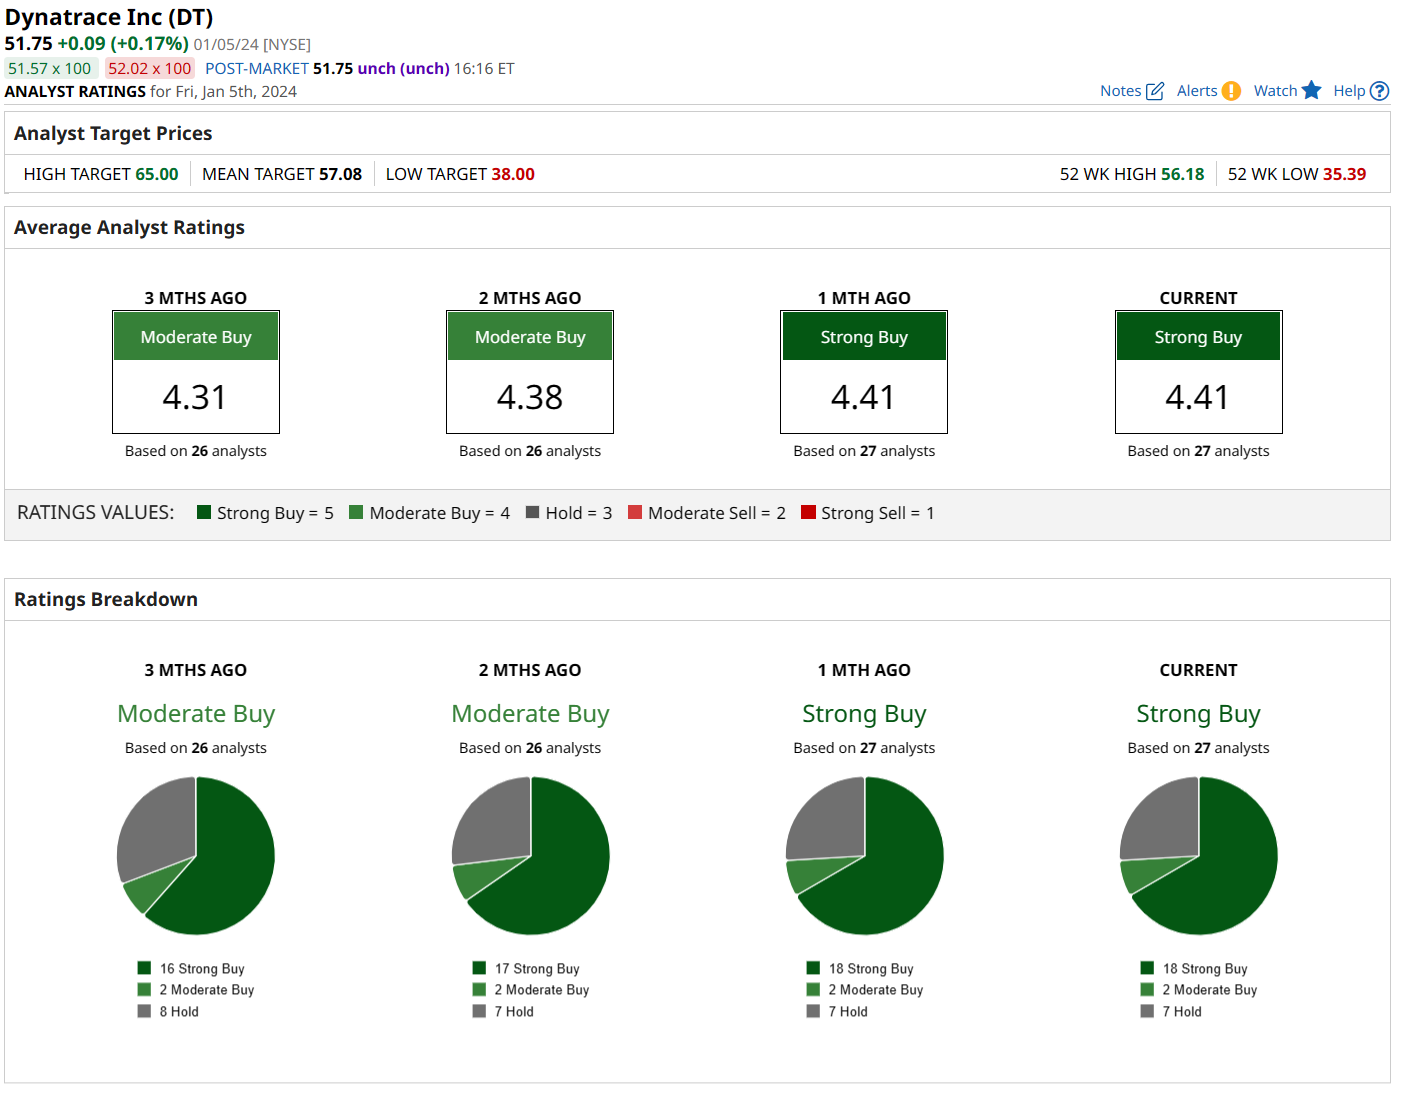
Dynatrace Stock: The Software Intelligence Specialist
Dynatrace Inc. (DT) is a global technology company that provides a software intelligence platform. The platform is designed to simplify cloud complexity and accelerate digital transformation. With advanced observability, AI, and complete automation, Dynatrace’s all-in-one platform provides answers, not just data, about the performance of applications, the underlying infrastructure, and the experience of all users.
Over the last 52 weeks, Dynatrace stock has gained more than 49%.
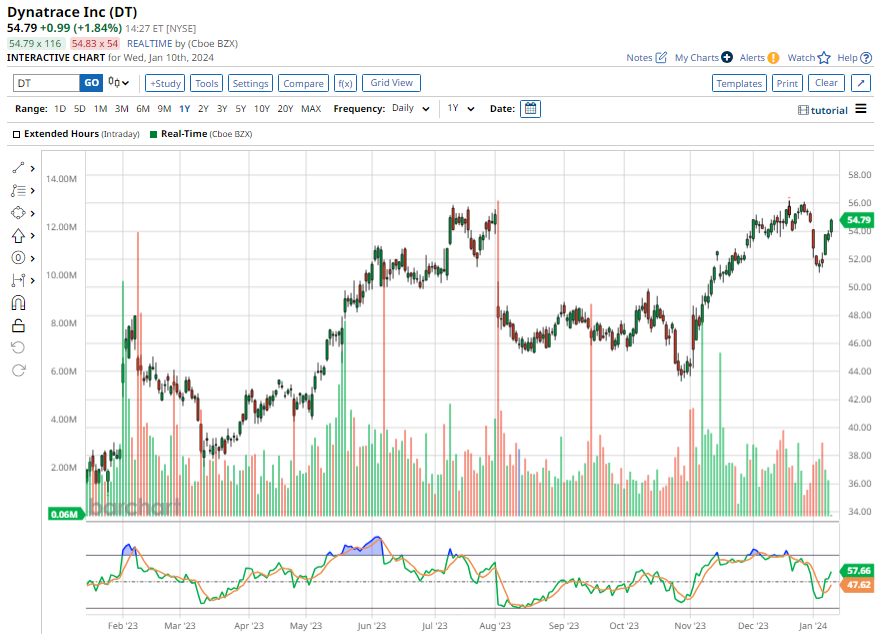
In its fiscal Q2 earnings report, the company beat EPS and revenue estimates and backed its full-year guidance, which led to a 15% increase in the stock price the next day. Revenue grew by over 27% year-over-year to $279.3 million, with annual recurring revenue (ARR) up 34% to $1.16 billion. This growth was largely driven by strong cloud adoption.
For the year ahead, the consensus is calling for robust revenue growth of 21.87%.
Based on the recommendations of 27 analysts, the consensus is a “strong buy” for Dynatrace’s stock. Of these, 18 suggest a “strong buy,” 2 suggest a “moderate buy,” and 7 suggest a “hold.” The average target price is $57.88, which implies 5.5% upside, while Baird has a slightly higher target of $59.
While valuations may be slightly stretched, thereby limiting upside potential, all three of these software stocks stand out as top ideas in the space. Given their solid financial performance, robust revenue projections, and the endorsement of Wall Street analysts, this trio of SNOW, MDB, and DT might be the best in class for software stocks this January.
On the date of publication, Ebube Jones did not have (either directly or indirectly) positions in any of the securities mentioned in this article. All information and data in this article is solely for informational purposes. For more information please view the Barchart Disclosure Policy here.
MMS • RSS
![]() Raymond James & Associates boosted its position in MongoDB, Inc. (NASDAQ:MDB – Free Report) by 34.8% during the third quarter, according to its most recent disclosure with the Securities and Exchange Commission (SEC). The fund owned 53,047 shares of the company’s stock after acquiring an additional 13,686 shares during the quarter. Raymond James & Associates owned 0.07% of MongoDB worth $18,347,000 at the end of the most recent reporting period.
Raymond James & Associates boosted its position in MongoDB, Inc. (NASDAQ:MDB – Free Report) by 34.8% during the third quarter, according to its most recent disclosure with the Securities and Exchange Commission (SEC). The fund owned 53,047 shares of the company’s stock after acquiring an additional 13,686 shares during the quarter. Raymond James & Associates owned 0.07% of MongoDB worth $18,347,000 at the end of the most recent reporting period.
A number of other hedge funds have also added to or reduced their stakes in MDB. GPS Wealth Strategies Group LLC bought a new stake in shares of MongoDB during the second quarter worth $26,000. KB Financial Partners LLC bought a new stake in shares of MongoDB during the second quarter worth $27,000. Capital Advisors Ltd. LLC grew its stake in shares of MongoDB by 131.0% during the second quarter. Capital Advisors Ltd. LLC now owns 67 shares of the company’s stock worth $28,000 after buying an additional 38 shares during the last quarter. Parkside Financial Bank & Trust grew its stake in shares of MongoDB by 176.5% during the second quarter. Parkside Financial Bank & Trust now owns 94 shares of the company’s stock worth $39,000 after buying an additional 60 shares during the last quarter. Finally, Coppell Advisory Solutions LLC bought a new stake in shares of MongoDB during the second quarter worth $43,000. 88.89% of the stock is owned by institutional investors.
Insider Transactions at MongoDB
In other news, CAO Thomas Bull sold 359 shares of the business’s stock in a transaction dated Tuesday, January 2nd. The shares were sold at an average price of $404.38, for a total transaction of $145,172.42. Following the completion of the sale, the chief accounting officer now directly owns 16,313 shares of the company’s stock, valued at $6,596,650.94. The transaction was disclosed in a legal filing with the SEC, which is available at this hyperlink. In other MongoDB news, CAO Thomas Bull sold 359 shares of the company’s stock in a transaction dated Tuesday, January 2nd. The shares were sold at an average price of $404.38, for a total value of $145,172.42. Following the completion of the sale, the chief accounting officer now directly owns 16,313 shares of the company’s stock, valued at approximately $6,596,650.94. The sale was disclosed in a legal filing with the Securities & Exchange Commission, which is available at the SEC website. Also, Director Dwight A. Merriman sold 1,000 shares of the company’s stock in a transaction dated Wednesday, November 1st. The stock was sold at an average price of $345.21, for a total transaction of $345,210.00. Following the completion of the sale, the director now directly owns 533,896 shares of the company’s stock, valued at $184,306,238.16. The disclosure for this sale can be found here. Insiders sold a total of 147,029 shares of company stock valued at $56,304,511 over the last three months. Corporate insiders own 4.80% of the company’s stock.
MongoDB Price Performance
Shares of NASDAQ MDB opened at $378.73 on Wednesday. The firm’s 50-day moving average price is $393.90 and its 200-day moving average price is $380.73. MongoDB, Inc. has a 1-year low of $174.70 and a 1-year high of $442.84. The firm has a market capitalization of $27.34 billion, a P/E ratio of -143.46 and a beta of 1.23. The company has a current ratio of 4.74, a quick ratio of 4.74 and a debt-to-equity ratio of 1.18.
MongoDB (NASDAQ:MDB – Get Free Report) last announced its quarterly earnings data on Tuesday, December 5th. The company reported $0.96 earnings per share for the quarter, beating the consensus estimate of $0.51 by $0.45. The firm had revenue of $432.94 million for the quarter, compared to analyst estimates of $406.33 million. MongoDB had a negative net margin of 11.70% and a negative return on equity of 20.64%. The business’s quarterly revenue was up 29.8% compared to the same quarter last year. During the same quarter in the prior year, the business earned ($1.23) earnings per share. Equities research analysts anticipate that MongoDB, Inc. will post -1.64 earnings per share for the current fiscal year.
Analyst Ratings Changes
A number of research firms have weighed in on MDB. Scotiabank began coverage on shares of MongoDB in a research note on Tuesday, October 10th. They set a “sector perform” rating and a $335.00 target price on the stock. KeyCorp decreased their target price on shares of MongoDB from $495.00 to $440.00 and set an “overweight” rating on the stock in a research note on Monday, October 23rd. TheStreet upgraded shares of MongoDB from a “d+” rating to a “c-” rating in a report on Friday, December 1st. Mizuho lifted their price target on shares of MongoDB from $330.00 to $420.00 and gave the stock a “neutral” rating in a report on Wednesday, December 6th. Finally, Tigress Financial lifted their price target on shares of MongoDB from $490.00 to $495.00 and gave the stock a “buy” rating in a report on Friday, October 6th. One analyst has rated the stock with a sell rating, three have assigned a hold rating and twenty-one have assigned a buy rating to the company. Based on data from MarketBeat.com, the company presently has a consensus rating of “Moderate Buy” and an average target price of $430.41.
Check Out Our Latest Stock Report on MDB
MongoDB Profile
MongoDB, Inc provides general purpose database platform worldwide. The company offers MongoDB Atlas, a hosted multi-cloud database-as-a-service solution; MongoDB Enterprise Advanced, a commercial database server for enterprise customers to run in the cloud, on-premise, or in a hybrid environment; and Community Server, a free-to-download version of its database, which includes the functionality that developers need to get started with MongoDB.
Read More
Want to see what other hedge funds are holding MDB? Visit HoldingsChannel.com to get the latest 13F filings and insider trades for MongoDB, Inc. (NASDAQ:MDB – Free Report).

Receive News & Ratings for MongoDB Daily – Enter your email address below to receive a concise daily summary of the latest news and analysts’ ratings for MongoDB and related companies with MarketBeat.com’s FREE daily email newsletter.
MMS • RSS
The Zacks Internet Software industry is benefiting from accelerated demand for digital transformation and the ongoing shift to the cloud. The high demand for Software as a Service or SaaS-based solutions due to the increasing need for remote working, learning and diagnosis software has been a major driver for industry players. The growing demand for solutions that support hybrid operating environments is noteworthy. The growing proliferation of Augmented & Virtual Reality devices is noteworthy. Increasingly sophisticated cyber-attacks are driving cybersecurity application demand. Robust IT spending on software is a positive for industry participants. Snap SNAP, MongoDB MDB and Zoom Video Communications ZM are benefiting from these trends. However, heightened geopolitical risks, raging inflation and high interest rates are major headwinds.
Industry Description
The Zacks Internet Software industry comprises companies offering application performance monitoring, as well as infrastructure and application software, DevOps deployment and Security software. Industry participants offer multi-cloud application security and delivery, social networking, online payment and 3D printing applications and solutions. They use the SaaS-based cloud computing model to deliver solutions to end-users, as well as enterprises. Hence, subscription is the primary revenue source. Advertising is also a major revenue source. Industry participants target a variety of end markets, including banking and financial services, service providers, federal governments and animal health technology and services.
3 Trends Shaping the Future of the Internet Software Industry
Adoption of SaaS Growing: The industry is benefiting from the continued demand for digital transformation. Growth prospects are alluring, primarily due to the rapid adoption of SaaS, which offers a flexible and cost-effective delivery method of applications. It also cuts down on deployment time compared with legacy systems. SaaS attempts to deliver applications to any user, anywhere, anytime and on any device. It has been effective in addressing customer expectations of seamless communications across multiple channels, including voice, chat, email, web, social media and mobile. This increases customer satisfaction and raises the retention rate, driving the top lines of industry participants. Moreover, the SaaS delivery model has supported the industry participants to deliver software applications amid the coronavirus-led lockdowns and shelter-in-place guidance. Remote working, learning and diagnosis have also boosted the demand for SaaS-based software applications.
Pay-As-You-Go Model Gaining Traction: The increasing customer-centric approach is allowing end-users to perform all required actions with minimal intervention from software providers. The pay-as-you-go model helps Internet Software providers scale their offerings per the needs of different users. The subscription-based business model ensures recurring revenues for the industry participants. The affordability of the SaaS delivery model, particularly for small and medium-sized businesses, is another major driver. The cloud-based applications are easy to use. Hence, the need for specialized training is reduced significantly, which lowers expenses, thereby driving profits.
Ongoing Transition to Cloud Creating Opportunities: The growing need to secure cloud platforms amid the increasing incidences of cyber-attacks and hacking drives the demand for web-based cyber security software. As enterprises continue to move their on-premise workload to cloud environments, application and infrastructure monitoring is gaining importance. This is increasing the demand for web-based performance management monitoring tools.
Zacks Industry Rank Indicates Bright Prospects
The Zacks Internet Software industry, placed within the broader Zacks Computer And Technology sector, carries a Zacks Industry Rank #29, which places it in the top 12% of more than 250 Zacks industries.
The group’s Zacks Industry Rank, which is the average of the Zacks Rank of all the member stocks, indicates bright near-term prospects. Our research shows that the top 50% of the Zacks-ranked industries outperform the bottom 50% by a factor of more than two to one.
The industry’s position in the top 50% of the Zacks-ranked industries is a result of a positive earnings outlook for the constituent companies in aggregate. Looking at the aggregate earnings estimate revisions, it appears that analysts are optimistic about this group’s earnings growth potential. The industry’s earnings estimates for 2024 have moved up 60.8% since Jan 31, 2023.
Before we present the top industry picks, it is worth looking at the industry’s shareholder returns and current valuation first.
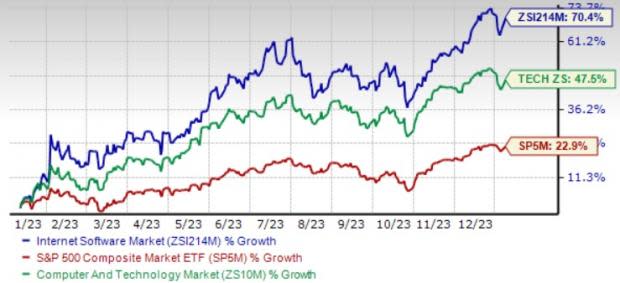
Industry Beats Sector, S&P 500
The Zacks Internet Software industry has outperformed the broader Zacks Computer and Technology sector as well as the S&P 500 Index in the past year.
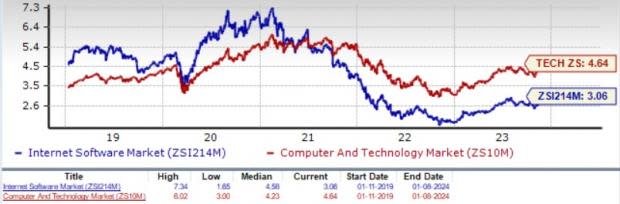
The industry has risen 70.4% over this period compared with the S&P 500 Index’s gain of 22.9% and the broader sector’s growth of 47.5%.
One-Year Price Performance
Industry’s Current Valuation
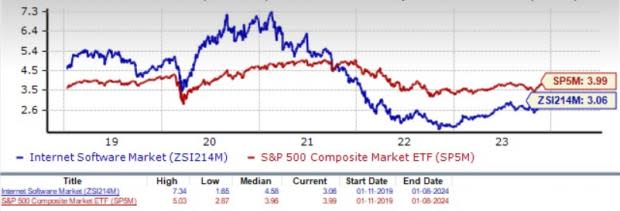
On the basis of trailing 12-month price-to-sales (P/S), which is a commonly used multiple for valuing Internet Software stocks, we see that the industry is currently trading at 3.06X compared with the S&P 500’s 3.99X and the sector’s trailing 12-month P/S of 4.64X.
Over the last three years, the industry has traded as high as 7.34X and as low as 1.65X, with a median of 4.58X, as the charts below show.
Trailing 12-Month Price-to-Sales (P/S) Ratio
3 Stocks to Buy Right Now
Snap – This Zacks Rank #1 (Strong Buy) company is riding on user growth and improving user engagement, driven by the strong adoption of Augmented Reality Lenses, Discover content, Shows and Snap Map, which are used by 350 million users on a monthly basis. You can see the complete list of today’s Zacks #1 Rank stocks here.
Snap’s expanding partner base, with the likes of ITV in the U.K. and ESPN in the Netherlands, is noteworthy.
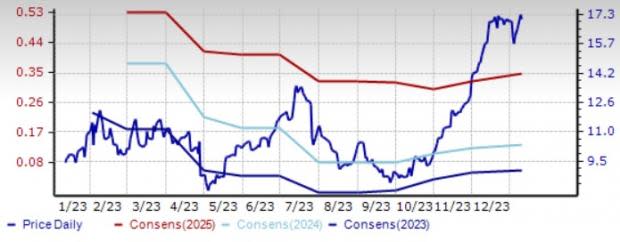
This Venice, CA-based company’s shares have gained 81% in the trailing 12-month period. The Zacks Consensus Estimate for Snap’s 2024 earnings has been unchanged at 13 cents per share over the past 30 days.
Price and Consensus: SNAP
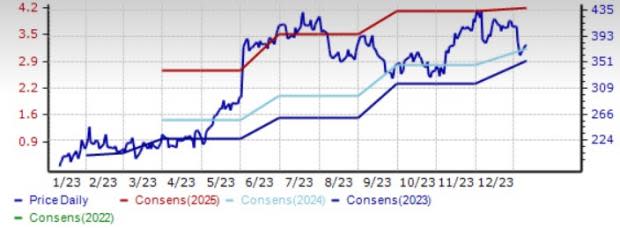
MongoDB – This company is benefiting from strong demand for Atlas. MDB’s clientele increased by roughly 1,400 customers sequentially to 46,400 customers at the end of third-quarter fiscal 2024.
Shares of this Zacks Rank #1 company have gained 108% in the past year. The Zacks Consensus Estimate for MongoDB’s fiscal 2024 earnings is pegged at $2.90 per share, unchanged over the past 30 days.
Price and Consensus: MDB
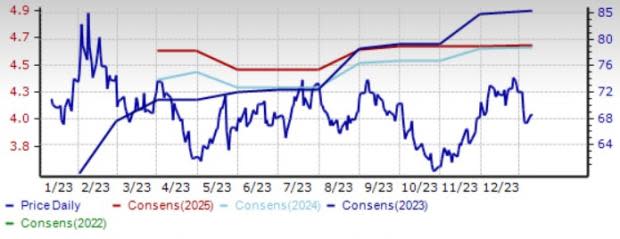
Zoom Video – Another Zacks Rank #1 company, it is benefiting from steady growth in subscriber base and enterprise customer base backed by strong demand for offerings like Zoom Phone. The launch of AI-driven solutions like Zoom Doc and Zoom AI Companion holds promise.
Zoom Video shares have declined 3.6% in the trailing 12-month period. The Zacks Consensus Estimate for the company’s fiscal 2024 earnings is pegged at $4.94 per share, unchanged in the past 30 days.
Price and Consensus: ZM
Want the latest recommendations from Zacks Investment Research? Today, you can download 7 Best Stocks for the Next 30 Days. Click to get this free report
Snap Inc. (SNAP) : Free Stock Analysis Report
MongoDB, Inc. (MDB) : Free Stock Analysis Report
Zoom Video Communications, Inc. (ZM) : Free Stock Analysis Report
MMS • RSS
![]()
Allspring Global Investments Holdings LLC decreased its stake in MongoDB, Inc. (NASDAQ:MDB – Free Report) by 3.7% in the 3rd quarter, according to the company in its most recent filing with the Securities and Exchange Commission. The institutional investor owned 566,824 shares of the company’s stock after selling 21,744 shares during the period. Allspring Global Investments Holdings LLC owned 0.79% of MongoDB worth $196,043,000 at the end of the most recent reporting period.
A number of other hedge funds have also recently modified their holdings of the stock. Assetmark Inc. lifted its holdings in shares of MongoDB by 247.7% in the 3rd quarter. Assetmark Inc. now owns 18,952 shares of the company’s stock valued at $6,555,000 after purchasing an additional 13,502 shares during the last quarter. Whittier Trust Co. of Nevada Inc. grew its position in MongoDB by 1.1% during the 3rd quarter. Whittier Trust Co. of Nevada Inc. now owns 15,509 shares of the company’s stock worth $5,364,000 after purchasing an additional 168 shares during the last quarter. Whittier Trust Co. boosted its stake in shares of MongoDB by 2.9% during the third quarter. Whittier Trust Co. now owns 32,328 shares of the company’s stock worth $11,180,000 after buying an additional 902 shares during the period. Park Avenue Securities LLC purchased a new position in shares of MongoDB during the third quarter worth about $622,000. Finally, Advisor Partners II LLC grew its position in MongoDB by 54.3% in the 3rd quarter. Advisor Partners II LLC now owns 1,137 shares of the company’s stock valued at $393,000 after buying an additional 400 shares during the last quarter. 88.89% of the stock is owned by hedge funds and other institutional investors.
Wall Street Analyst Weigh In
Several research firms recently issued reports on MDB. KeyCorp cut their price target on shares of MongoDB from $495.00 to $440.00 and set an “overweight” rating for the company in a report on Monday, October 23rd. UBS Group reissued a “neutral” rating and issued a $410.00 price target (down from $475.00) on shares of MongoDB in a report on Thursday, January 4th. Truist Financial reiterated a “buy” rating and issued a $430.00 price objective on shares of MongoDB in a research report on Monday, November 13th. Bank of America started coverage on shares of MongoDB in a research report on Thursday, October 12th. They set a “buy” rating and a $450.00 target price on the stock. Finally, Scotiabank began coverage on shares of MongoDB in a report on Tuesday, October 10th. They issued a “sector perform” rating and a $335.00 price target for the company. One investment analyst has rated the stock with a sell rating, three have assigned a hold rating and twenty-one have given a buy rating to the company. According to data from MarketBeat, MongoDB presently has a consensus rating of “Moderate Buy” and an average target price of $430.41.
View Our Latest Stock Analysis on MDB
Insider Activity
In related news, CAO Thomas Bull sold 359 shares of MongoDB stock in a transaction on Tuesday, January 2nd. The stock was sold at an average price of $404.38, for a total value of $145,172.42. Following the transaction, the chief accounting officer now owns 16,313 shares in the company, valued at $6,596,650.94. The sale was disclosed in a legal filing with the Securities & Exchange Commission, which is available through this hyperlink. In related news, CAO Thomas Bull sold 359 shares of the firm’s stock in a transaction that occurred on Tuesday, January 2nd. The shares were sold at an average price of $404.38, for a total value of $145,172.42. Following the transaction, the chief accounting officer now owns 16,313 shares in the company, valued at $6,596,650.94. The transaction was disclosed in a legal filing with the Securities & Exchange Commission, which is available at this link. Also, CEO Dev Ittycheria sold 100,500 shares of the business’s stock in a transaction that occurred on Tuesday, November 7th. The stock was sold at an average price of $375.00, for a total transaction of $37,687,500.00. Following the sale, the chief executive officer now owns 214,177 shares of the company’s stock, valued at $80,316,375. The disclosure for this sale can be found here. Insiders sold 147,029 shares of company stock valued at $56,304,511 in the last ninety days. Company insiders own 4.80% of the company’s stock.
MongoDB Stock Performance
Shares of MDB stock traded up $10.76 during mid-day trading on Wednesday, hitting $389.49. 711,064 shares of the company’s stock were exchanged, compared to its average volume of 1,477,245. The company has a debt-to-equity ratio of 1.18, a current ratio of 4.74 and a quick ratio of 4.74. The stock has a 50-day simple moving average of $393.90 and a two-hundred day simple moving average of $380.73. MongoDB, Inc. has a fifty-two week low of $179.52 and a fifty-two week high of $442.84.
MongoDB (NASDAQ:MDB – Get Free Report) last released its earnings results on Tuesday, December 5th. The company reported $0.96 earnings per share (EPS) for the quarter, topping the consensus estimate of $0.51 by $0.45. MongoDB had a negative net margin of 11.70% and a negative return on equity of 20.64%. The business had revenue of $432.94 million for the quarter, compared to analysts’ expectations of $406.33 million. During the same period last year, the company earned ($1.23) earnings per share. The company’s quarterly revenue was up 29.8% on a year-over-year basis. As a group, analysts predict that MongoDB, Inc. will post -1.64 earnings per share for the current fiscal year.
MongoDB Company Profile
MongoDB, Inc provides general purpose database platform worldwide. The company offers MongoDB Atlas, a hosted multi-cloud database-as-a-service solution; MongoDB Enterprise Advanced, a commercial database server for enterprise customers to run in the cloud, on-premise, or in a hybrid environment; and Community Server, a free-to-download version of its database, which includes the functionality that developers need to get started with MongoDB.
See Also
This instant news alert was generated by narrative science technology and financial data from MarketBeat in order to provide readers with the fastest and most accurate reporting. This story was reviewed by MarketBeat’s editorial team prior to publication. Please send any questions or comments about this story to contact@marketbeat.com.
Before you consider MongoDB, you’ll want to hear this.
MarketBeat keeps track of Wall Street’s top-rated and best performing research analysts and the stocks they recommend to their clients on a daily basis. MarketBeat has identified the five stocks that top analysts are quietly whispering to their clients to buy now before the broader market catches on… and MongoDB wasn’t on the list.
While MongoDB currently has a “Moderate Buy” rating among analysts, top-rated analysts believe these five stocks are better buys.

Just getting into the stock market? These 10 simple stocks can help beginning investors build long-term wealth without knowing options, technicals, or other advanced strategies.
MMS • RSS

© Reuters. Here’s How Much You Would Have Made Owning Cenovus Energy Stock In The Last 5 Years
Benzinga – by Benzinga Insights, Benzinga Staff Writer.
Cenovus Energy (NYSE:CVE) has outperformed the market over the past 5 years by 2.18% on an annualized basis producing an average annual return of 14.9%. Currently, Cenovus Energy has a market capitalization of $30.65 billion.
Buying $100 In CVE: If an investor had bought $100 of CVE stock 5 years ago, it would be worth $203.25 today based on a price of $16.28 for CVE at the time of writing.
Cenovus Energy’s Performance Over Last 5 Years
Finally — what’s the point of all this? The key insight to take from this article is to note how much of a difference compounded returns can make in your cash growth over a period of time.
This article was generated by Benzinga’s automated content engine and reviewed by an editor.
© 2024 Benzinga.com. Benzinga does not provide investment advice. All rights reserved.