Month: January 2018

MMS • RSS
Article originally posted on Data Science Central. Visit Data Science Central
Summary: Exceptions sometimes make the best rules. Here’s an example of well accepted variable reduction techniques resulting in an inferior model and a case for dramatically expanding the number of variables we start with.
 One of the things that keeps us data scientists on our toes is that the well-established rules-of-thumb don’t always work. Certainly one of the most well-worn of these rules is the parsimonious model; always seek to create the best model with the fewest variables. And woe to you who violate this rule. Your model will over fit, include false random correlations, or at very least will just be judged to be slow and clunky.
Certainly this is a rule I embrace when building models so I was surprised and then delighted to find a well conducted study by Lexis/Nexis that lays out a case where this clearly isn’t true.
A Little Background
In highly regulated industries like insurance and lending the variables that are allowed for use are highly regulated as are the modeling techniques. Techniques are generally limited to those that are highly explainable, mostly GLM and simple decision trees. Data can’t include anything that is overtly discriminatory under the law so, for example, race, sex, and age can’t be used, or at least not directly. All of this works against model accuracy.
Traditionally what agencies could use to build risk models has been defined as ‘traditional data’, that which the consumer has submitted with their application and the data that can be added from the major credit rating agencies. In this last case Experian and the others offer some 250 different variables and except for those that are specifically excluded by law, this seems like a pretty good sized inventory of predictive features.
But in the US and especially abroad the market contains many ‘thin-file’ or ‘no-file’ consumers who would like to borrow but for which traditional data sources simply don’t exist. Millennials feature in this group because their cohort is young and doesn’t yet have much borrowing or credit history. But also in this group are the folks judged to be marginal credit risks, some of whom could be good customers if only we knew how to judge the risk.
Enter the World of Alternative Data
‘Alternative data’ is considered to be any data not directly related to the consumer’s credit behavior, basically anything other than the application data and consumer credit bureau data. A variety of agencies are prepared to provide it and it can include:
- Transaction data (e.g. checking account data)
- Telecom/utility/rent data
- Social profile data
- Social network data
- Clickstream data
- Audio and text data
- Survey data
- Mobile app data
As it turns out lenders have been embracing alternative data for the last several years and see real improvements in their credit models, particularly at the low end of the scores. Even the CFPB has provisionally endorsed this to bring credit to the underserved.
 From a Data Science Perspective
From a data science perspective, in this example we started out with on the order of 250 candidate features from ‘traditional data’, and now, using ‘alternative data’ we can add an additional 1,050 features. What’s the first thing you do when you have 1,300 candidate variables? You go through the steps necessary to identify only the most predictive variables and discard the rest.
Here’s Where It Gets Interesting
Lexis/Nexis, the provider of the alternative data, set out to demonstrate that a credit model built on all 1,300 features was superior to one built on only 250 traditional features. The data was drawn from a full-file auto lending portfolio of just under 11 million instances. You and I might have concluded that even 250 was too many but in order to keep the test rigorous they introduced these constraints.
- The technique was limited to forward stepwise logistic regression. This provided clear univariate feedback on the importance of each variable.
- Only two models would be compared, one with the top 250 most predictive attributes and the other with all 1,300 attributes. This eliminated any bias from variable selection that might be introduced by the modeler.
- The variables for the 250 var model were selected by ranking the predictive power of each variables correlation to the dependent variable. As it happened all of the alternate variables fell outside the top 250 with the highest ranking 296th.
- The models were created with the same overall data prep procedures such as binning rules.
What Happened
As you might expect, the first and most important variable was the same for both models but began to diverge at the second variable. The second variable in the 1,300 model was actually 296th based on the earlier predictive power analysis.
When the model was completed the alternative data made up 25% of the model’s accuracy although none would have been included based on the top 250 predictive variables.
The KS (Kolmogorov-Smirnov) statistic was 4.3% better for the 1,300 model compared to the 250 model.
The Business Importance
The distribution of scores and charge offs for each models was very similar but in the bottom 5% of scores things changed. There was a 6.4% increase in the number of predicted charge offs in this bottom group.
Since the distributions are the essentially the same this can be seen as higher scores that might have been rated credit worthy migrating into the lowest categories of credit worthiness allowing better decisions about denial or pricing based on risk. Conversely it appears that some lowest rated borrowers were given a boost with the additional data.
That also translates to a competitive advantage for those using the alternative data compared to those who don’t. You can see the original study here.
There are Four Lesson for Data Scientists Here
- Think outside the box and consider the value of a large number of variables when first developing or refining your model. It wasn’t until just a few years ago that the insurance industry started looking at alternative data and on the margin it has increased accuracy in important ways. FICO published this chart showing the relative value of each category of alternative data strongly supporting using more variables.

- Be careful about using ‘tried and true’ variable selection techniques. In the Lexis/Nexis case starting the modeling process with variable selection based on univariate correlation with the dependent variable was misleading. There are a variety of other techniques they could have tried.
- Depending on the amount of prep, it still may not be worthwhile expanding your variables so dramatically. More data always means more prep means more time which in a commercial environment you may not have. Still, be open to exploration.
- Adding ‘alternate source’ data to your decision making can be a two edged sword. In India, measures as obscure as how often a user charges his cell phone or its average charge level has proven to be predictive. In that credit-starved environment these innovative measures are welcomed when they provide greater access to credit.
On the other hand just this week a major newspaper in England published as expose of comparative auto insurance rates where it discovered that individuals applying with a Hotmail account were paying as much as 7% more than those with Gmail accounts. Apparently British insurers had found a legitimate correlation between risk and this alternative data. It did not sit well with the public and the companies are now on the defensive.
About the author: Bill Vorhies is Editorial Director for Data Science Central and has practiced as a data scientist since 2001. He can be reached at:
MMS • RSS
Article originally posted on Data Science Central. Visit Data Science Central
Summary: Advanced analytic platform developers, cloud providers, and the popular press are promoting the idea that everything we do in data science is AI. That may be good for messaging but it’s misleading to the folks who are asking us for AI solutions and makes our life all the more difficult.
 Arrgh! Houston we have (another) problem. It’s the definition of Artificial Intelligence (AI) and specifically what’s included and what isn’t. The problem becomes especially severe if you know something about the field (i.e. you are a data scientist) and you are talking to anyone else who has read an article, blog, or comic book that has talked about AI. Sources outside of our field, and a surprising number written by people who say they are knowledgable are all over the place on what’s inside the AI box and what’s outside.
This deep disconnect and failure to have a common definition wastes a ton of time as we have to first ask literally everyone we speak to “what exactly do you mean by that when you say you want an AI solution”.
Always willing to admit that perhaps the misperception is mine, I spent several days gathering definitions of AI from a wide variety of sources and trying to compare them.
When a Data Scientist Talks to Another Data Scientist
Here’s where I’m coming from. For the last 20 or so years we’ve been building a huge body of knowledge and expertise in machine learning, that is using a variety of supervised and unsurpervised techniques to find, exploit, and optimize actions based on patterns we are able to find in the data. When Hadoop and NoSQL came along, we extended those ML techniques to unstructured data, but that wasn’t yet AI as we know it today.
It was only after the introduction of two new toolsets that we have what data scientists call AI. Those are reinforcement learning and deep neural nets. These in turn have given us image, text, and speech applications, game play, self driving cars, and combination applications like IBMs Watson (the question answering machine not the new broad branding) that make it possible to ask human language questions of broad data sets like MRI images and have it determine if that is cancer or not cancer.
When a Data Scientist Talks to a Historian
It is possible to take a much broader view of AI extending back even before the effective use of modern AI. This definition was first introduced to me by John Launchbury, the Director of DARPA’s Information Innovation Office. He expands our point of view to take in three ages of AI:
- The Age of Handcrafted Knowledge
- The Age of Statistical Learning
- The Age of Contextual Adaptation.
Launchbury’s explanation helped me greatly but while the metaphor of ‘ages’ is useful it creates a false impression that one age ends and the next begins as a kind of replacement. Instead I see this as a pyramid where what went before continues on and becomes a foundation for the next. This also explicitly means that even the oldest of AI technologies can still be both useful and are in fact still used. So the pyramid looks like this:

This definition even includes the handcrafted expert systems we built back in the 80s and 90s. Since I built some of those I can relate. This supports the ‘everything is AI’ point of view. Unfortunately this just takes too much time to explain and it’s not really what most people are thinking about when the say ‘AI’.
Definitions from Data Science Sources
Since there is no definitive central reference glossary for data science, I looked in the next best places, Wikipedia and Technopedia. These entries after all were written, reviewed, and edited by data scientists. Much abbreviated but I believe accurately reported, here are their definitions.
Wikipedia
- “Colloquially, the term “artificial intelligence” is applied when a machine mimics “cognitive” functions that humans associate with other human minds, such as “learning” and “problem solving”….Capabilities generally classified as AI as of 2017 include successfully understanding human speech, competing at a high level in strategic game systems (such as chess and Go), autonomous cars, …and interpreting complex data, including images and videos.”
OK, so far I liked the fairly narrow focus that agrees with reinforcement learning and deep neural nets. They should have stopped there because now, in describing tools for AI Wikipedia says:
- “In the course of 60 or so years of research, AI has developed a large number of tools to solve the most difficult problems in computer science,…neural network, kernel methods such as SVMs, K-nearest neighbor, …naïve Bayes…and decision trees.”
So Wikipedia has reduced all of the machine learning techniques we mastered over the last 20 years as the development of AI???
Technopedia
- “Artificial intelligence (AI) is an area of computer science that emphasizes the creation of intelligent machines that work and react like humans. Some of the activities computers with artificial intelligence are designed for include: speech recognition, learning, planning, problem solving….Artificial intelligence must have access to objects, categories, properties and relations between all of them to implement knowledge engineering.”
I was with them so far. They even acknowledged the training requirement of having labeled outcomes associated with inputs. Then they spoiled it.
- “Machine learning is another core part of AI. Learning without any kind of supervision requires an ability to identify patterns in streams of inputs, whereas learning with adequate supervision involves classification and numerical regressions. Mathematical analysis of machine learning algorithms and their performance is a well-defined branch of theoretical computer science often referred to as computational learning theory.”
So apparently there is no such thing as unsupervised machine learning outside of AI which includes all of ML? No association rules, no clustering? No one seems to have reminded these authors that CNNs and RNN/LSTMs require identified outputs to train (the definition of supervised which they acknowledged in the first paragraph and contradicted in the second). And while some CNNs may be featureless, the most popular and wide spread application, facial recognition, relies on hundreds of predefined features on each face to perform its task.
It also appears that what we have been practicing over the last 20 years in predictive analytics and optimization is simply “computational learning theory”.
Major Thought Leading Business Journals and Organizations
Results were mixed. This survey article published in the MIT Sloan Journal in collaboration with BCG looked at ‘Reshaping Business with Artificial Intelligence’ involving a global survey of more than 3,000 executives.
- “For the purpose of our survey, we used the definition of artificial intelligence from the Oxford Dictionary: “AI is the theory and development of computer systems able to perform tasks normally requiring human intelligence, such as visual perception, speech recognition, decision-making, and translation between languages.” However, AI is evolving rapidly, as is the understanding and definition of the term.”
Their definition seemed reasonably constrained and beyond image and text recognition, at least one example involved a Watson-like question answering maching (QAM). I was a little worried by the inclusion of ‘decision making’ since that’s exactly what predictive and prescriptive analytics are intended to do. Did their survey respondents really understand the difference?
The Stanford 2017 AI Index Report is a great resource and an attempt to offer a great deal of insight into the state of AI today. However, its definition especially with respect to Machine Learning seems to ignore history.
- “ML is a subfield of AI. We highlight ML courses because of their rapid enrollment growth and because ML techniques are critical to many recent AI achievements.”
Of course the Harvard Business Review does not speak with one voice but this article was at the top of the Google search for definitions of AI. Entitled “The Business of Aritificial Intelligence” by Brynjolfsson and McAfee it offers this unusual defintion:
- “The most important general-purpose technology of our era is artificial intelligence, particularly machine learning (ML) — that is, the machine’s ability to keep improving its performance without humans having to explain exactly how to accomplish all the tasks it’s given. …Artificial intelligence and machine learning come in many flavors, but most of the successes in recent years have been in one category: supervised learning systems, in which the machine is given lots of examples of the correct answer to a particular problem. This process almost always involves mapping from a set of inputs, X, to a set of outputs, Y.”
So once again, apparantly everything we’ve doing over the last 20 years is AI? And the most successful portion of AI has been supervised learning? I’m conflicted. I agree with some of that; not the part that we’ve practicing AI all along. I’m just not sure these authors really understand either. Nor would this be particularly helpful explaining AI to a client or your boss.
Definitions by Major Platform Developers
By now I was getting discouraged and figured I knew what I would find when I started to look at the blogs and promotional literature created by the major platforms. After all, from their perspective, if everyone wants AI then let’s tell them that everything is AI. Problem solved.
And that is indeed what I found for the major platforms. Even when you get down to the newer specialized AI platforms (e.g. H2O ai) they emphasize their ability to serve all needs, deep learning and traditional predictive analytics. It’s one of the major trends in advanced analytic platforms to become as broad as possible to capture as many data science users as possible.
Let’s Get Back to the Founders of AI
How about if we go back to the founding fathers who originally envisioned AI. What did they say? Curiously they took a completely different tack, not by defining the data science, but by telling us how we’d recognize AI when we finally got it.
Alan Turing (1950): Can a computer convince a human they’re communicating with another human.
Nils Nilsson (2005): The Employment Test – when a robot can completely automate economically important jobs.
Steve Wozniak (2007): Build a robot that could walk into an unfamiliar house and make a cup of coffee.
Ben Goertzel (2012): When a robot can enroll in a human university and take classes in the same way as humans, and get its degree.
It’s also interesting that they couched their descriptions in terms of what a robot must do, recognizing that robust AI must be able to interact with humans.
 See: this is still and video image recognition.
Hear: receive input via text or spoken language.
Speak: respond meaningfully to our input either in the same language or even a foreign language.
Make human-like decisions: Offer advice or new knowledge.
Learn: change its behavior based on changes in its environment.
Move: and manipulate physical objects.
You can immediately begin to see that many of the commercial applications of AI that are emerging today require only a few of these capabilities. But individually these capabilities are represented by deep learning and reinforcement learning.
And In the End
I don’t want to turn this into a crusade, but personally I’m still on the page with the founding fathers. That when someone asks us about an AI solution they are talking about the ‘modern AI’ features ascribed to our robot above.
Realistically, the folks that are bringing AI to market including all of the major advanced analytic platform providers, cloud providers, plus the popular press are shouting us down. Their volume of communication is just so much greater than ours. It’s likely that our uneducated clients and bosses will hear the ‘everything is AI’ message. That however, will not solve their confusion. We’ll still have to ask, “Well what exactly do you mean by that?”
About the author: Bill Vorhies is Editorial Director for Data Science Central and has practiced as a data scientist since 2001. He can be reached at:
MMS • Raul Salas
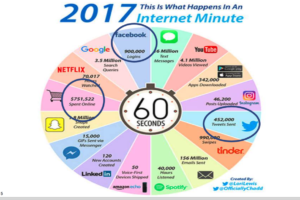
Ever wonder what happens in an Internet minute? Now that we are in 2018, I thought it would be good timing to discuss the state of internet activity in 2017. All these internet interactions generate a massive amount of data and is contributing to the growing demand for Big Data professionals.
What’s interesting to note is Google’s lack of dominance in Internet Activity. Once a stalwart, Google is now being matched by activity from Facebook, Snapchat, and twitter combined!
Notice the new entry for 2017 is the Alexa interactions. There are currently 50 Alexa’s shipped per minute, expect this number to skyrocket considering record Amazon Alexa sales this Christmas! Interactions with AWS Voice endpoints will skyrocket as well with the introduction of the Alexa Marketplace. In addition, this past November Amazon launched Alexa for Business product line as well (https://www.youtube.com/watch?v=ViB3XhsTLuo). This will propel Amazon interactions and data growth as well.
What does all this mean for Big Data? It means growth of data will continue to be strong and outstrip organization’s ability to make effective use of the data. At the same time, Machine learning and Artificial Intelligence will also be consuming data at very high rates. 2018 may be the year that organizations start to put emphasis on the quality of data as well as the triage/prioritization of data in their data warehouses.
Data Science is Changing and Data Scientists will Need to Change Too – Here’s Why and How
MMS • RSS
Article originally posted on Data Science Central. Visit Data Science Central
Summary: Deep changes are underway in how data science is practiced and successfully deployed to solve business problems and create strategic advantage. These same changes point to major changes in how data scientists will do their work. Here’s why and how.
 There’s a sea change underway in data science. It’s changing how companies embrace data science and it’s changing the way data scientists do their job. The increasing adoption and strategic importance of advanced analytics of all types is the backdrop. There are two parts to this change.
One is what is happening right now as analytic platforms build out to become one-stop shops for data scientists. But the second and more important is what is just beginning but will now take over rapidly. Advanced analytics will become the hidden layer of Systems of Intelligence (SOI) in the new enterprise applications stack.
Both these movements are changing the way data scientists need to do their jobs and how we create value.
What’s Happening Now
Advanced analytic platforms are undergoing several evolutionary steps at once. This is the final buildout in the current competitive strategy being used by advanced analytic platforms to capture as many data science users as possible. These last steps include:
- Full integration from data blending, through prep, modeling, deployment, and maintenance.
- Cloud based so they can expand and contract their MPP resources as required.
- Expanding capabilities to include deep learning for text, speech, and image analysis.
- Adopting higher and higher levels of automation in both modeling and prep reducing data science labor and increasing speed to solution. Gartner says that within two years 40% of our tasks will be automated.
Here are a few examples I’m sure you’ll recognize.
- Alteryx with roots in data blending is continuously upgrading its on-board analytic tools and expanding access to third party GIS and consumer data such as Experian.
- SAS and SPSS have increased blending capability, incorporated MPP, and most recently added enhanced one-click model building and data prep options.
- New entrants like DataRobot emphasize labor savings and speed-to-solution through MPP and maximum one-click automation.
- The major cloud providers are introducing complete analytic platforms of their own to capture the maximum number of data science users. These include Google’s Cloud Datalab, Microsoft Azure, and Amazon SageMaker.
The Whole Strategic Focus of Advanced Analytic Platforms is About to Change
We are in the final stages of large analytics users wanting to assemble different packages in a best of breed strategy. Gartner says users, starting with the largest will increasingly consolidate around a single platform.
These same consolidation forces were at work in ERP systems in the 90s or DW/BI, and CRM systems in the 00s. Give the customer greater efficiency and ease of use with a single vendor solution creating a wide moat of good user experience combined with painful high switching costs.
This is only the end of the last phase and not where advanced analytic platforms are headed over the next two to five years. So far the emphasis has been on internal completeness and self-sufficiency. According to both strategists and Venture Capitalists the next movement will see the advanced analytic platform disappear into an integrated enterprise stack as the critical middle System of Intelligence.

Why the Change in Strategy – and When?
The phrase Systems of Intelligence (SOI) was first used by Microsoft CEO Satya Nadella in early 2015. However it wasn’t until 2017 that the strategy of creating wide moats using SOI was articulated by venture capitalist Jerry Chen at Greylock Partners.
Suddenly Systems of Intelligence is on everyone’s tongue as the next great generational shift in enterprise infrastructure, the great pivot in the ML platform revolution.
Where current Advanced Analytic Platform strategies rely on being the one-stop general-purpose data science platform of choice, those investing and developing the next generation of platforms say that is about to change. That the needs of each industry, or the needs of each major business process like finance, HR, ITSM, supply chain, ecommerce, and others have become so specialized in terms of their data science content that wide moats are best constructed by making the data science disappear as the middle layer between systems of record and systems of engagements.
As Chen states, “Companies that focus too much on technology without putting it in context of a customer problem will be caught between a rock and a hard place”. As an investor he would say that he is unwilling to back a general purpose DS platform for that very reason.
Chen and many others are investing directly on the basis of these thoughts that the future of data science, machine learning, and AI is as the invisible secret sauce middle layer. No one cares exactly how the magic is done, so long as your package arrives on time, or the campaign is successful, or whatever insight the DS has provided proves valuable. It’s all about the end user.
From the developer’s and investor’s point of view, this strategy is also the only forward path to deliver measurable and lasting competitive differentiation. The treasured wide moat.
So in the marketplace the emphasis is on the system of engagement. Look at Slack, Amazon Alexa, and every other speech /text /conversational UI startup that uses ML as the basis for its interaction with the end user. In China, Tencent and Alibaba have almost completely dominated ecommerce, gaming, chat, and mobile payments by focusing on improving their system of engagement through advanced ML.
It’s also true that systems of engagement experience more rapid evolution and turnover than either the underlying ML or the systems of records. So it’s important that in this new enterprise stack the ML be able to work with a variety of existing and new systems of engagement and also systems of record.
The old methods of engagement don’t disappear but new ones are added. In fact being in control of the end user and being compatible with multiple systems of records provides access to the flow of data that will allow the ML SOI to constantly improve enhancing your dominant position.
Here’s how Chen and other SOI enthusiasts see the market today.

How Does this Change the Way Data Scientists Work?
So why does this matter to data scientists and how will it change the way we perform our tasks? Gartner says that by 2020 more than 40% of data science tasks will be automated. There are two direct results:
Algorithm Selection and Tuning Will No Longer Matter
It will be automated. It will no longer be one of the data scientist’s primary tasks. We see the movement to automating model construction all around us from the automated modeling features in SPSS to the fully automated modeling platforms like DataRobot.
Our ability to try various algorithms including our hands-on ability to tune hyperparameters will very rapidly be replaced by smart automation. The amount of time we need to spend on this part of the project is dramatically reduced and will no longer be the best and most effective use of our expertise.
Data Prep will be Mostly Automated
Data prep for the most part will be automated and in some narrowly defined instances can be completely automated. This problem is actually much more difficult to totally automate than model creation. However you can already utilize automated data prep in tools as diverse as SPSS and Xpanse Analytics. Right now, of the many steps in prep at least the following can be reliably automated:
- Blending data sources.
- Profile the data for initial discovery.
- Recode missing and mislabeled values.
- Normalize the data distribution.
- Run univariate analyses.
- Bin categoricals.
- Create N-grams from text fields.
- Detect and resolve outliers.
If you’ve experienced any of these automated prep tools you know that today they’re not perfect. Give them a little time. This step alone eliminates all the unpleasant grunt work and lower level time and labor in ML.
Who You Want to Work For
The Systems of Intelligence strategy shift raises another interesting change. It probably impacts who you want to work for. One of the great imbalances in the shortage of the best data scientists is that such a high percentage work for tech companies mostly engaged in one-size-fits-all platforms. Certainly one implication is that we may want to search out industry or process vertical solution developers who will be the primary beneficiaries of this major change.
What’s Left for the Data Scientist to do?
Whether you’ve been in the industry for long or are fresh out of school you’ve been intently focused on data prep, model selection, and tuning. For many of us these are the tasks that define our core skill sets. So what’s left?
This isn’t as dark as it seems. We shift to the higher value tasks that were always there but represented a much smaller percentage of our work.
Feature Engineering and Model Validation Become a Focus
In all the automation of prep so far there have been some attempts to automate feature engineering (feature creation) by for example taking the difference in all the possible date fields, creating all the possible ratios among variables, looking at trending of values, and other techniques. These have been brute force and tend to create lots of meaningless engineered features.
It is your knowledge of both data science and particularly the industry specific domain knowledge that will keep the creation and selection of important new predictive engineered features a major part of our future efforts.
Your expertise will also be required at the earliest stages of data examination to ensure the automation hasn’t gone off the rails. It’s pretty easy to fool today’s automated prep tools into believing data may be linear when in fact it may be curvilinear or even non-correlated (I’m thinking Anscombe’s Quartet here). It still takes an expert to validate that the automation is heading in the right direction.
Your Understanding of the Business Problem to be Solved
If you are working inside a large corporation as part of the advanced analytics team then your ability to correctly understand the business problem and translate that into a data science problem will be key.
If you are working under the SOI strategy and trying to solve a cross industry process problems (HR, finance, supply chain, ITSM) or even if you are working with a more narrowly defined industry vertical (e.g. ecommerce customer engagement) it will be your knowledge and understanding of the end users experience that will be valued.
Even today progress as a data scientist requires deep domain knowledge of your specialty process or industry. Knowledge of the data science required to implement the solution is not sufficient without domain knowledge.
Machine Learning Will Increasingly be a Team Sport
With all this talk of automation it is easy to be misled that professional data scientists will no longer be necessary. Nothing could be further from the truth. True, fewer of us will be required to solve problems which can be implemented much more quickly.
Where does this leave the Citizen Data Scientist? This is a movement that has quite a lot of momentum and it’s easy to understand that reasonably smart and motivated LOB managers and analysts may not only want to consume more data science but also want a hands-on seat at the table.
And indeed they should have a major role in defining the problem and implementing the solution. However, even with all the new automated features the underlying data science still requires an expert’s eye.
The new focus of your skills will be as a team leader, one with deep knowledge of the data science and the business domain.
How Fast Will All This Happen
The build out of advanced analytic platforms and automated features has been underway for about the last two years. I’m with Gartner on this one. I think roughly half our tasks will be automated within two years. Beyond that it’s about how fast this trickles down from the largest companies to the smaller ones. The speed and reduced cost that automation offers will be impossible to resist.
As for the absorption of the data science platform into the hidden middle layer of the stack as the System of Intelligence, you can already see this underway in many of the thousands of VC funded startups. This is fairly new and it will take time for these startups to scale and mature. However, don’t overlook the role that M&A will play in bringing these new platform concepts inside large existing players. This is probable and will only accelerate the trend.
Is hiding the data science from the end user in any way a bad thing? Not at all. Our contribution to the end user’s experience was never meant to be on direct display. This means more opportunities to apply our data science skills on more tightly focused groups of end users and create more delight in their experience.
About the author: Bill Vorhies is Editorial Director for Data Science Central and has practiced as a data scientist since 2001. He can be reached at:
MMS • RSS
Article originally posted on Data Science Central. Visit Data Science Central
Here we ask you to identify which tool was used to produce the following 18 charts: 4 were done with R, 3 with SPSS, 5 with Excel, 2 with Tableau, 1 with Matlab, 1 with Python, 1 with SAS, and 1 with JavaScript. The solution, including for each chart a link to the webpage where it is explained in detail (many times with source code included) can be found here. You need to be a DSC member to access the page with the solution: you can sign-up here.
How do you score? Would this be a good job interview question?
Chart 1
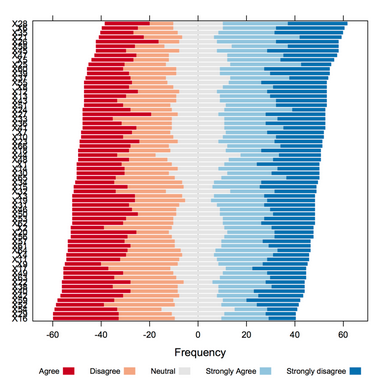
Chart 2
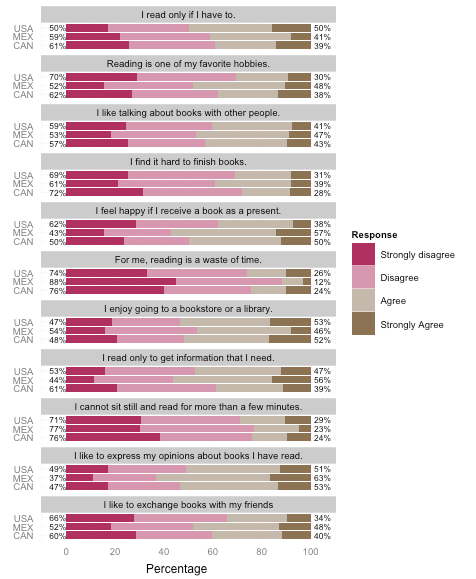
Chart 3
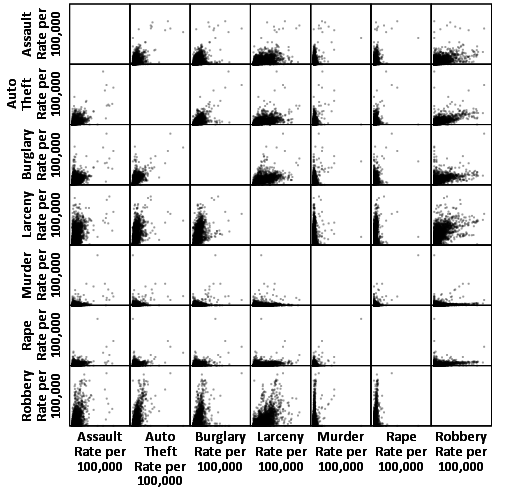
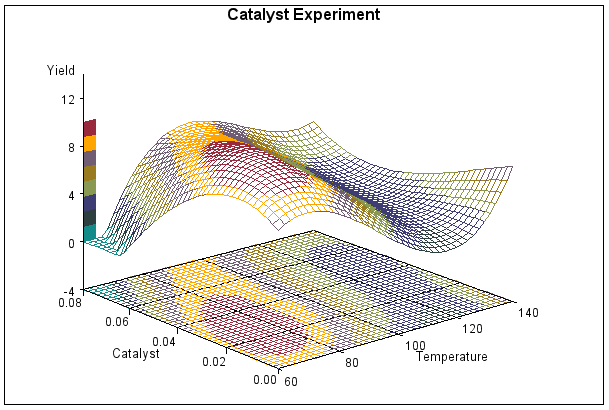
Chart 4
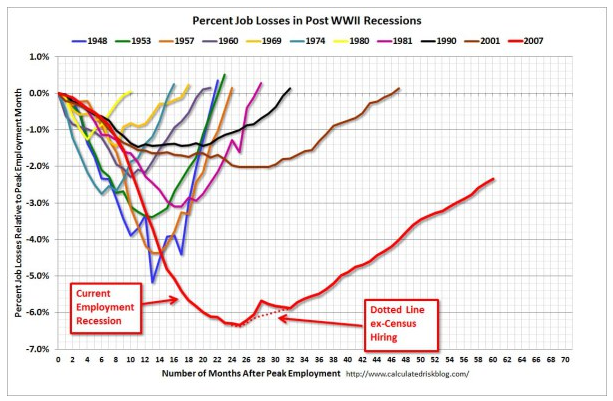
Chart 5
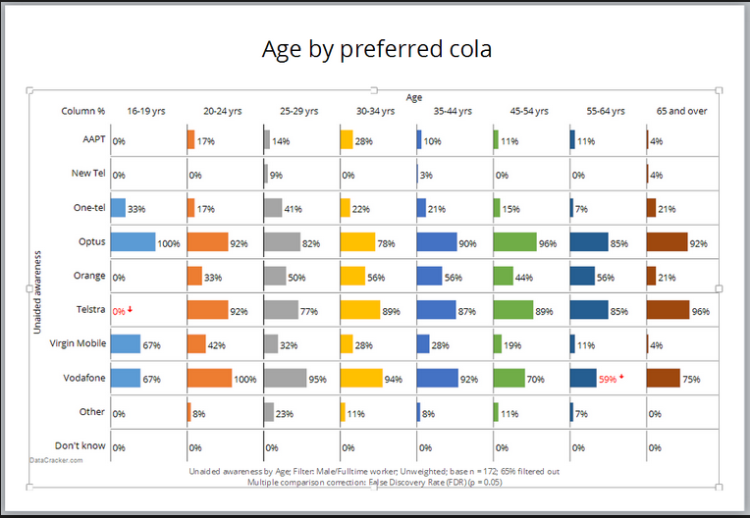
Chart 6
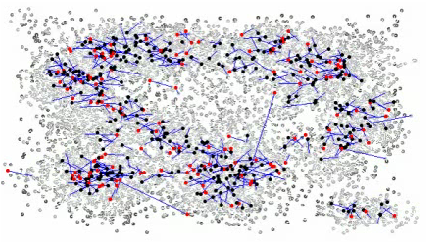
Chart 7
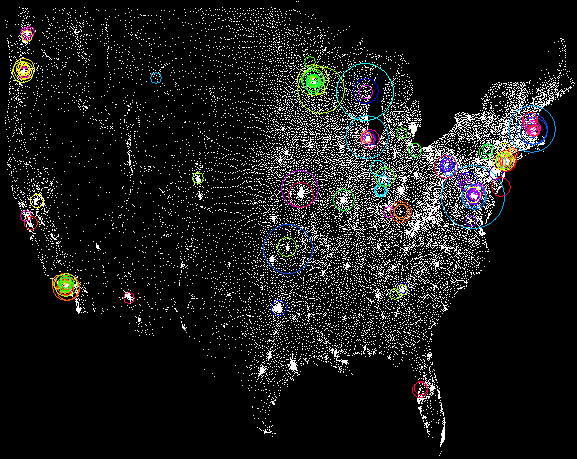
Chart 8
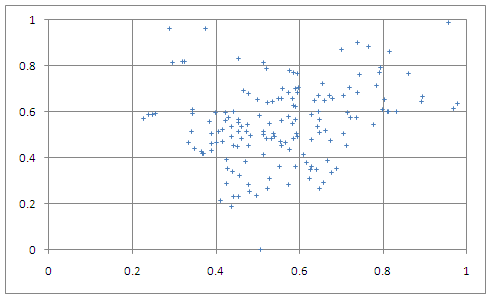
Chart 9
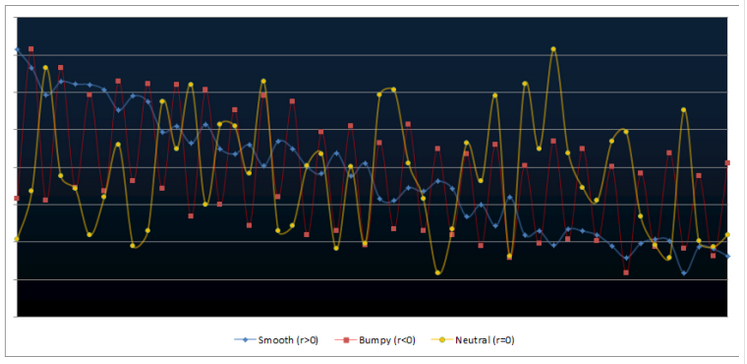
Chart 10
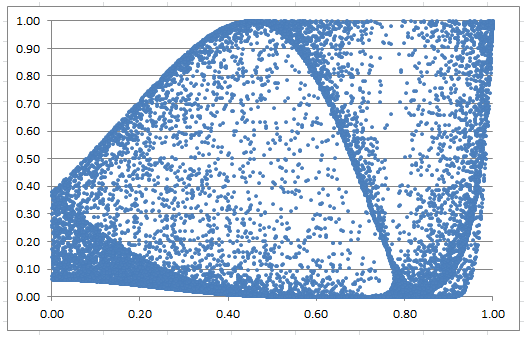
Chart 11
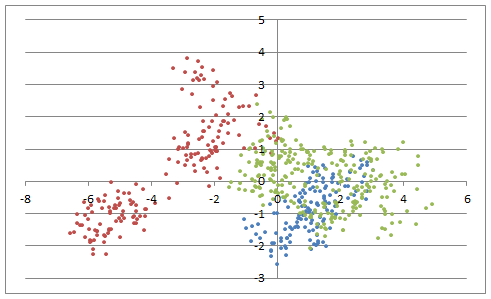
Chart 12

Chart 13

Chart 14
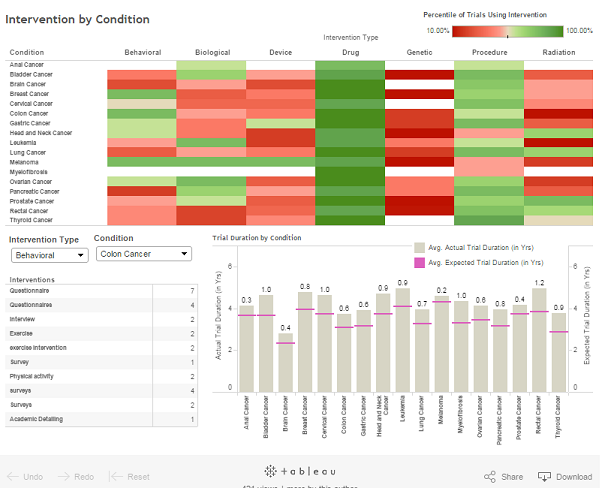
Chart 15

Chart 16
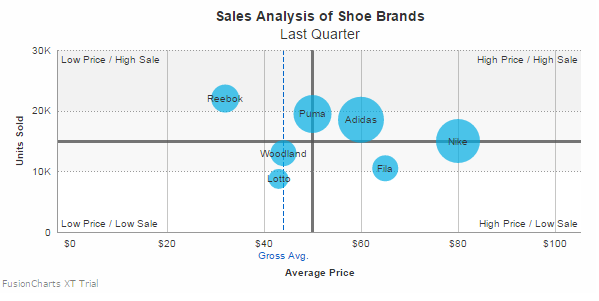
Chart 17
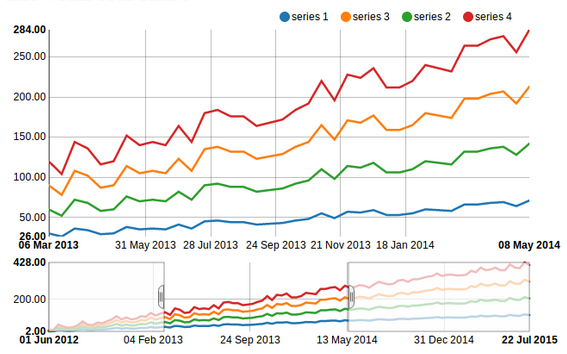
Chart 18
DSC Resources
- Career: Training | Books | Cheat Sheet | Apprenticeship | Certification | Salary Surveys | Jobs
- Knowledge: Research | Competitions | Webinars | Our Book | Members Only | Search DSC
- Buzz: Business News | Announcements | Events | RSS Feeds
- Misc: Top Links | Code Snippets | External Resources | Best Blogs | Subscribe | For Bloggers
Additional Reading
- 50 Articles about Hadoop and Related Topics
- 10 Modern Statistical Concepts Discovered by Data Scientists
- Top data science keywords on DSC
- 4 easy steps to becoming a data scientist
- 13 New Trends in Big Data and Data Science
- 22 tips for better data science
- Data Science Compared to 16 Analytic Disciplines
- How to detect spurious correlations, and how to find the real ones
- 17 short tutorials all data scientists should read (and practice)
- 10 types of data scientists
- 66 job interview questions for data scientists
- High versus low-level data science
Follow us on Twitter: @DataScienceCtrl | @AnalyticBridge