Month: June 2018

MMS • RSS
Article originally posted on InfoQ. Visit InfoQ
In a recent Hyperledger blog post, Jesse Chenard, ceo of MonetaGo, discusses how blockchain is poised to reinvent traditional Business Process Management platforms (BPM). A challenge with existing BPM platforms is that data is usually stored in organizational silos and challenges exist in counterparty transaction exchanges. A blockchain solution can provide auditing across boundaries, without leaking sensitive information to additional parties.
According to a Reuters article, it claims that the BPM market will be worth approximately $18 billion USD by 2022. Traditional BPM software provides workflow management solutions and have been around for decades. However, one of the constraints of this traditional approach, is the data that is captured within these solutions becomes trapped within an organization’s boundary, Chenard describes how this can be avoided:
Traditional BPM services tend to handle internal workflows within a single organization only. They do not manage the workflow process and information across organizations. If they do, they fall into the same trap that blockchain is helping to move away from, which is having a centralized repository of information controlled by a third party (in this case, the business process or workflow provider). If a third party holds data and is responsible for passing it from one organization to another, there is a risk of resiliency problems that come with that central or single point of failure.
However, introducing blockchain for the creation of peer-to-peer BPM systems has some advantages. Chenard explains:
Peer-to-peer BPM systems that eliminate the central repository of information and allows multiple corporations to exchange information directly with counterparties while guaranteeing the integrity of the process. The system allows for organizations to verify and enforce that specific steps are being taken and performed correctly by any party on the network.
An industry that can benefit from this type of blockchain architecture is financial services. The Reserve Bank of India recently licensed three entities to provide a lending solution, built on Hyperledger Fabric, that targets fraud reduction. RXIL, A.TReDS and M1xchange teamed up to build a receivables financing solution. Receivables financing is one of the fastest growing and efficient lending tools for small business to address their working capital needs. Within India, the financing market provides $219 billion USD to micro, small and medium businesses. Yet, there is more than $188 billion USD in unmet needs. Together, this group, built a competitive marketplace to address this demand.
A challenge that this group sought to address was preventing organizations from seeking redundant funding by submitting applications for credit to multiple providers. Chenard shares how they were able to prevent duplicate funding:
By implementing a common blockchain platform, these exchanges were able to eliminate instances of double financing without sharing specific elements of any invoice or client. Ultimately, this implementation leads to the exchanges being able to offer better rates across the board to all of their customers and provide access to capital for more businesses otherwise deemed too risky.
Another aspect that needed to be addressed was the three organizations involved in building this platform are all competitors. As a result, maintaining privacy was really important, Chenard explains:
Clients are particularly sensitive about their sourcing inputs, and it is imperative that the exchanges not provide any of their client information to a shared registry controlled by any one entity. By creating a blockchain network built on Hyperledger Fabric, together with some intelligent cryptography, that concern is eliminated as the technology enables the exchanges to work together on a shared network to achieve shared goals without compromising privacy.
One of the benefits of using BPM, in a blockchain architecture, is participants and counterparties are still able to maintain control of their data without leaking customer data. This allows organizations to enforce network rules while still maintaining control.
While the project in India demonstrates that blockchain can be used in BPM architectures, there are still some challenges from a tooling and feature perspective, Chenard adds:
While saying blockchain technology as a communication layer for Business Process Management is a promising use case, it is by no means an out of the box solution – a lot depends on the actual workflow, the use case, and the local laws and regulations.
The BPM industry is very mature and approchable for developers and users, whereas blockchain continues to be an emerging technology. But, as demonstrated in the use case in India, blockchain can play an important role in business process management that spans multiple counterparties.
MMS • RSS
Article originally posted on Data Science Central. Visit Data Science Central
Hello All,
Gives me immense pleasure to announce the release of our book “Practical Enterprise Data Lake Insights” with Apress. The book takes an end-to-end solution approach in a data lake environment that includes data capture, processing, security, and availability. Credits to the co-author of the book, Venkata Giri and technical reviewer, Sai Sundar.
The book is now available at various channels as subscription and in print (on request!) and e-book (e.g., Amazon/Kindle, Barnes & Noble/nook, Apress.com). Below are the Apress and Amazon links –
Apress – https://www.apress.com/gb/book/9781484235218
Amazon – https://www.amazon.com/Practical-Enterprise-Data-Lake-Insights/dp/1484235215/
Thank you for all your confidence, support, and encouragement. Thanks Monica Caldas, CIO (GE Transportation) for helping us with the Foreword column.

Brief about the book –
When designing an enterprise data lake you often hit a roadblock when you must leave the comfort of the relational world and learn the nuances of handling non-relational data. Starting from sourcing data into the Hadoop ecosystem, you will go through stages that can bring up tough questions such as data processing, data querying, and security. Concepts such as change data capture and data streaming are covered. The book takes an end-to-end solution approach in a data lake environment that includes data security, high availability, data processing, data streaming, and more.
Each chapter includes application of a concept, code snippets, and use case demonstrations to provide you with a practical approach. You will learn the concept, scope, application, and starting point. Use this practical guide to successfully handle the challenges encountered when designing an enterprise data lake and learn industry best practices to resolve issues.
What You’ll Learn:
- Get to know data lake architecture and design principles
- Implement data capture and streaming strategies
- Implement data processing strategies in Hadoop
- Understand the data lake security framework and availability model
Grab your copies fast. Enjoy reading!
Saurabh

MMS • RSS
Article originally posted on Data Science Central. Visit Data Science Central
To be actionable, Big Data and Data Science must get down to the level of the individual – whether the individual is a customer, physician, patient, teacher, student, coach, athlete, technician, mechanic or engineer. This is the “Power of One.” By applying data science to the growing wealth of human purchase, interaction and social engagement data, organizations can capture individual’s tendencies, propensities, inclinations, behaviors, patterns, associations, interests, passions, affiliations and relationships that drive business monetization opportunities (see Figure 1).

Figure 1: Using Analytic Profiles to Capture and Monetize the “Power of One”
Analytic Profilesprovide a structure for capturing an individual’s behaviors and tendencies in a way that facilities the refinement and sharing of these digital assets across multiple business and operational use cases (see Figure 2).

Figure 2: Analytic Profiles for Capturing and Quantifying Individual Customer’s Behaviors
But it isn’t just humans who develop behavioral tendencies. Cars, cranes, wind turbines, CT scanners, chillers, engines, motors, elevators and other “things” also develop unique tendencies, and that’s the concept behind Digital Twins.
What is a Digital Twin?
A Digital Twin is a digital representation of an industrial asset that enables companies to better understand and predict the performance of things, uncover new revenue opportunities, and optimize the operations of the business. GEpopularized the Digital Twins concept to capture the asset’s detailed history (from design to build to maintenance to retirement/salvage) that can be mined to provide actionable insights into the product’s operations, maintenance and repair.
Digital Twins was selected by Gartner (“Top 10 Strategic Technology Trends for 2018”) as one of the top 10 strategic technology trends in 2018. To quote the article:
“Over time, digital representations of virtually every aspect of our world will be connected dynamically with their real-world counterpart and with one another and infused with AI-based capabilities to enable advanced simulation, operation and analysis. City planners, digital marketers, healthcare professionals and industrial planners will all benefit from this long-term shift to the integrated digital twin world.”
Furthermore, Digital Twins provide the foundation for an organization’s artificial intelligence foundation, and the creation of intelligent apps and things (see Figure 3).

Figure 3: Gartner’s Top 10 Strategic Technology Trends in 2018
Just like Analytic Profiles are much more than just a “360-degree view of customer” (a meaningless, unactionable phrase that I loathe) with its ability to capture an individual’s propensities, tendencies, inclinations, patterns, relationships and behaviors, the Digital Twin is much more than just demographic and performance data about a device. To fully monetize the Digital Twin concept, one must also capture predictions about likelihood performance and behaviors that can lead to prescriptive actions (see Figure 4).

Figure 4: Digital Twin Captures Historical Performance Metrics And Performance Predictions
One of the key types of analytics that can be performed on “things” is to determine how a particular device performs in comparison to similar devices. This is the heart of Cohorts Analysis.
Role of Cohort Analysis
A cohortis a group of people banded together or treated as a group for a selected period of time (e.g., cohorts in crime).
Cohort Analysisis a subset of human behavioral analytics that takes purchase and engagement data and rather than looking at performance at the aggregate level, it breaks down the performance assessments into related groups of humans. Cohort analysis allows a company to see patterns and trends across the lifecycle of a group of humans. By quantifying those patterns and trends, a company can adapt and tailor its service to meet the unique needs of those specific cohorts.
Cohort Analysis can be combined with clustering, classification and collaborative filtering to predict what products groups of customers might want to buy and what actions they are likely to take.
While cohorts analysis is typically done for groups of clusters of humans, cohorts analysis can also work for clusters of things. Organizations can use cohort analysis to understand the trends and patterns of related or similar devices over time that can be used to optimize their maintenance, repair and upgrade and end of line (EOL) decisions.
Being able to compare or benchmark the performance and operations of one device against a similar group or cluster of similarly-performing devices can be used to deliver operational benefits in the following areas:
- Device performance optimization
- Predictive maintenance
- Repair scheduling optimization
- Inventory and MRO management
- Obsolete and excessive (O&E) inventory reduction
- Supply chain optimization
- Asset utilization
- Network performance optimization
- Load balancing
- Capacity planning
- Product design
- Salvage optimization
- End of Life / Retirement Management
In fact, nearly any analytics that you can perform on humans (with the exception of emotional analysis like sentiment analysis, though I swear there are times when my car *hates* me) can be performed on things.
Summary
Many of the behavioral analytics that we perform on humans can also be performed on things because just as humans exhibit different behavioral tendencies, so do things. And we can use Analytic Profiles (for humans) and Digital Twins (for things) to capture and quantify those behavioral tendencies.
Future blogs will further explore the role of Digital Twins in helping organizations monetize their IOT strategies.
Sources:
“What is Cohort Analysis?”
https://corporatefinanceinstitute.com/resources/knowledge/other/cohort-analysis/
“Cohort analysis”
https://en.wikipedia.org/wiki/Cohort_analysis
MMS • RSS
Article originally posted on Data Science Central. Visit Data Science Central
In an attempt to put the patient first in healthcare, Congress and President Obama in 2015 approved a bipartisan bill for United States healthcare reform. The bill is known as “Medicare Access and CHIP Reauthorization Act of 2015”, or MACRA. Among the major provisions of MACRA is the Quality Payment Program. Under the Quality Payment Program, physicians, and nurses receive positive, neutral, or negative Medicare payment adjustments based upon a “Patient Satisfaction Score”; that is, patient satisfaction scores have a direct impacton how physicians, physician assistants, nurses, and hospital’s get paid by Medicare.
Managing the broader healthcare goal of “improving the quality and effectiveness of patient care” from a single, highly generalized measure is a major concern for physicians and hospitals. These “patient satisfaction scores” can drive unintended patient treatment consequences. For example, some patients may have preconceived expectations about treatments and medicines based upon what they read on sites like WebMD. Patients may become dissatisfied when physicians prescribe more relevant treatments, and that patient dissatisfaction may be reflected in the patient satisfaction scores. As a result, physicians may feel pressured to consent to patient demands for unnecessary tests or to overprescribe pain medications to avoid being penalized on patient satisfaction surveys and receiving a lower reimbursement – a situation that may be contributing to today’s opioid epidemic.
My nephew is an Emergency Room doctor, and he confirmed that there is lots of pressure on hospitals, physicians and nurses to do what the patient wants (in order to get higher patient satisfaction scores) versus doing what’s right for the patient (which might lead to lower patient satisfaction scores). I know that I get frustrated when my doctor tells me to exercise more and eat more healthy foods. I know that’s what’s right for me, but I could easily penalize the doctor for telling you “what you need to hear” versus “what you want to hear” (i.e., eat more chipotle and watch more TV while lying on the couch).
Setting the right metrics is a tricky effort, because as John Smale, former CEO of Procter & Gamble use to say:
“You are what you measure, and ultimately, you measure what you reward”
That is, people will do what they are paid to do. If hospitals, physicians and nurses are reimbursed to increase patient satisfaction, then doing what the patient wants is the rationale choice.
Baseball Analogy: Importance of The Right Measures
To understand how a healthcare organization could create measures that drive a more strategic “Improving the Quality and Effectiveness of Patient Care” business initiative, let’s take a look at how baseball measures the “value and effectiveness of a player.” Being able to quantify the value and effectiveness of a baseball player is critical to major league baseball success as it impacts decisions around contracts, contract extensions, reassignments and trades. Baseball and the use of sabermetrics provide good lessons in how to leverage data and analytics in an attempt to determine or predict a player’s value. And while sabermetrics has only been around formally since 1980, statistics and baseball have gone hand-in-hand for over a century.
Let’s say, for example, we are trying to determine the value of a hitter. Today, Mike Trout (California Angels) and Bryce Harper (Washington Nationals) are considered two of the best hitters in professional baseball. Their offensive performance statistics – both career-wise and for the current season – speak for themselves (see Figure 1).

Figure 1: Trout and Harper’s Offensive Performance
And while there is an extensive set of offensive productivity measures against which to judge a hitter’s performance, it isn’t just hitting that determines a player’s value. Fielding effectiveness is another consideration, and both Harper and Trout excel in that category as well:
- Bryce Harper is considered the #1 fielding Right Fielder by MLB Player Rankings
- Trout also considered by Bleacher Reportas #1 fielding Center Fielder
Baseball has tried to create a single super metric – Wins Above Replacement or WAR – that is an attempt by the sabermetrics baseball community to summarize a player’s total contributions in one statistic. WAR is all-inclusive and provides a useful reference point for comparing players (see Figure 2). 
Figure 2: Components of the Offensive WAR Calculation
However, even with WAR there is no single measure. There are many subcategories of offensive WAR including:
- Offensive Wins Above Replacement
- Batting Runs From Weighted Runs Above Average
- Base-running Runs From Weighted Runs Above Average
- Runs Above Replacement
- Offensive Runs Above Average
- Offensive Wins Above Average
- W-L Percentage Of Offensive Wins Above Average
- Average Team Runs Per Game With Player
The sabermetrics community warns against using a single metricto evaluate the effectiveness and value of a player. No single measure can truly determine a baseball player’s value, and likewise no single measure can be used to determine the quality and effectiveness of patient care. Baseball gets it!
Applying Baseball Sabermetrics Lesson to Healthcare
Applying our sabermetrics lesson to healthcare, we’d want to capture a diverse set of measures that we could use to measure and drive progress in “improving the quality and effectiveness of patient care.” For example, we could create a “Quality of Care” score for each patient visit that could be comprised of the following sub-measures:
- Patient Satisfaction
- Readmissions
- Hospital Acquired Infections
- Physician / Nurse Satisfaction Score
- Recovery Days / Rehab Days
- Percentage Total Recovery
- Cost of Care
Role of Patient Analytic Profiles
To support the “Improve the Quality and Effectiveness of Patient Care” business initiative, we would want to create an Analytic Profile for each patient (as well as creating analytic profiles for the physicians, nurses, ER and OR).
Analytic Profiles capture the organization’s analytic assets to facilitate the refinement and sharing of those analytic assets across multiple use cases. An Analytic Profile consists of metrics, predictive indicators, segments, scores, and business rules that codify the behaviors, preferences, propensities, inclinations, tendencies, interests, associations and affiliations for the organization’s key business entities.
Patient Analytic Profiles are important because they allow hospitals and care givers to use a more holistic set of measures to determine the quality and effectiveness of patient care. For example, we could create a Patient Analytic Profile that captures key predictive metrics and scores for each patient that measure overall patient health and wellness including Diet Score, Exercise Score, Stress Score and an overall Wellness Score (see Figure 3).

Figure 3: Patient Analytic Profile
See “Analytic Profiles: Key to Data Monetization” for more details on the Analytic Profiles concept.
Summary
Creating one single measure against which to monitor any complicated business initiative (like determining the quality and effectiveness of patient care) is naïve. Baseball, with over a century of statistics experience, knows that no single measure can be used to determine the value or effectiveness of a baseball player. And relying upon the public’s opinion as the single measure of effectiveness is greatly flawed.
The public is not always a reliable source of what’s good and what’s not good. Remember the Internet phenomenon movie called “Snakes on a Plane”, a film that is now universal shorthand for “hideously bad”?
MMS • RSS
Article originally posted on InfoQ. Visit InfoQ
Christian Deger, chief architect at RIO – a Brand of Volkswagen Truck & Bus, recently shared a set of patterns and practices for implementing cloud native continuous delivery at the Continuous Lifecycle Conference in London. Deger covered patterns for isolated deployment pipelines (thanks to containerization), product teams empowered with delivery ownership (both process and infrastructure wise), and, finally, dynamic, immutable and composable infrastructure (avoiding monoliths, instead distinguishing between macro and micro infrastructure).
Continuous integration (CI) and Continuous delivery (CD) are critical to support autonomous teams frequently deploying independent services into dynamically created infrastructure. Applying cloud native concepts and modern infrastructure-as-code to the software delivery system allows “quickly creating decoupled pipelines for new services that are readily wired up into the platform, and everything is driven by code”, per Deger’s words.
Having a reliable delivery system in place that can withstand disaster and provide feedback without wait time has become a pre-requisite for modern software delivery. Containerizing the CI/CD infrastructure allows for:
- isolated builds: a clean container with the required agent profile (for instance, one application might require Java 8 while another is still running on Java 7) is created and lives only for the duration of the build
- elasticity: each build gets its own container agent, removing wait time and improving resource usage
Defining this infrastructure as code allows restoring delivery from zero (for instance in case of disaster) and avoids snowflake CI/CD servers whose configuration will inevitably drift when changes made via UI are not captured in version control.
Deger stressed the importance of being able to set up a new pipeline (for a new service) quickly and predictably as the first task on any project (otherwise there’s a danger of teams adding more responsibilities to existing services just to avoid a long bootstrap time). Having the pipeline (stages, tasks, dependencies, artifacts, etc) defined as code/configuration further allows swift recovery from disaster, as the pipeline can be quickly re-created and changes to the service can be delivered with a minimum delay. Most pipeline orchestration tools support pipeline-as-code (albeit with distinct implementations) today.
Deger recommends version controlling the pipeline definition together with the corresponding service code since autonomous teams need to own the full delivery pipeline. In fact, Deger suggests that each service should have its own code repository with the actual service code, but also the pipeline definition and the infrastructure code. Changes to the latter should go through the pipeline just like regular application changes, making them traceable and repeatable. This means infrastructure creation or updates need to be triggered dynamically from the pipeline.
Avoiding infrastructure monoliths (either with a single repo containing definitions for all of the services, or definitions grouped by layers such as databases, compute instances, or middleware) is fundamental for Deger. He recommends instead creating independent infrastructure stacks aligned with service boundaries (micro-infrastructure) and leave only the small set of cross-cutting, slowly changing, non-service specific aspects (such as networking and security) in a global stack (macro-infrastructure). Services import parameters from the macro-infrastructure that they share in order to be able to run inside it.
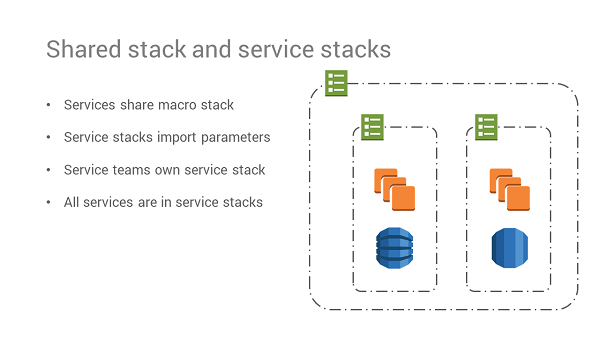
Slide image courtesy of Christian Deger
Another key idea from the talk was the notion of decoupling (or controlling) dependencies between services at multiple levels, not just in terms of application code. Besides an isolated pipeline for each service, other dependencies – such as base images (AMI, Docker, etc.) for the service – should be static (against a specific version), avoiding for example that an image update can trigger several pipelines simultaneously and possibly end in a risky re-deploy of a large part of the live system.
Perhaps the most polemic recommendation from Deger was to dispense with staging environments in the pipeline. With a high rate of changes in services (at least hourly), Deger claims it’s nearly impossible to test a new version of a service against the live versions of all the other services (in a staging environment). This either leads to wait times as staging becomes a bottleneck or to release monoliths where changes to multiple services are coupled together for testing in staging and only then deployed.
Instead, by relying on consumer-driven contract tests and reducing time to repair (MTTR) in production to a minimum, changes to services can be deployed independently and monitored to make sure they are working as expected in production. To further reduce impact, the deployment strategy should rely on canary releases (in particular monitoring closely the error rate, latency and load on new instances), feature toggles (quickly turn off a broken feature) and blue-green deployments (previous version of live environment available for quick rollback, at least if there were no database changes). In some particular cases (for example a major code refactoring) a dark launch might make sense. The new version is deployed and fed the same requests as the live environment to control if responses are functionally correct and the new instances can handle the load.
Throughout the talk, Deger reinforced several times the importance of teams owning the service from delivery (team is responsible for their own pipeline and CI instance) to infrastructure (team defines micro-stack where service runs) and runtime (micro-stack includes operability features like logging and monitoring). He recommends sharing patterns, practices, and guidelines, but not centralizing the actual work, as teams will lose autonomy and dependencies to other teams will slow down delivery.
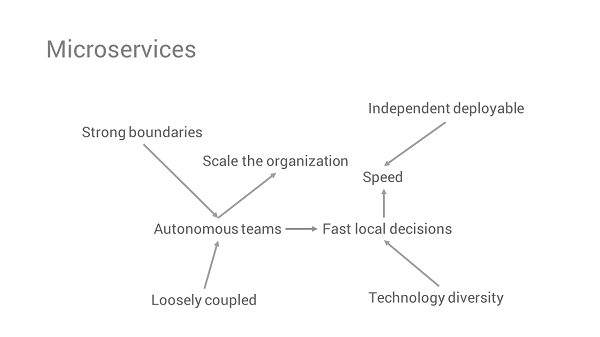
Slide image courtesy of Christian Deger
MMS • RSS
Article originally posted on InfoQ. Visit InfoQ
Microsoft announced the general availability (GA) of Azure SQL Data Sync, a service allowing customers to synchronize data between Azure SQL Databases and any of other SQL endpoints unidirectionally or bidirectionally. Furthermore, this release includes a few new capabilities in configuration, faster database schema refresh, and a more secure data synchronization process.
The GA release of Azure SQL Data Sync was a follow-up from its previous version last year in June – the Azure SQL Data Sync Refresh including several significant improvements like new Azure portal support, PowerShell and REST API support, and enhancements to security and privacy. This release includes a few further improvements too, according to the blog post about the release; Xiaochen Wu, senior program manager, Azure SQL Database, mentions:
- Better configuration experience – More reliable configuration workflow and more intuitive user experience.
- More reliable and faster database schema refresh – Load database schema more efficiently using the new SMO library.
- More secured data synchronization – We reviewed the end-to-end sync workflow and ensured user data are always encrypted at rest and in transit. Data Sync service now meets GDPR compliance requirement.
With Azure, SQL Data Sync enterprises can enable a hybrid SQL deployment and allow local data access from both Azure and on-premises applications. Furthermore, they can deploy their data-driven applications globally and have a local copy of the data in each region, and thus can keep data synchronized across all the regions. In a theregister article about the release, Richard Speed said:
By pointing applications at their local copy of the database, Microsoft reckons that access time and responsiveness will be improved significantly and latency and connection failures reduced.
SQL Azure Data Sync service requires a central hub database in Azure and a few member databases in Azure or on-premise. Next, a database administrator configures the databases as a Sync group and specifies the direction of data between member databases and the central hub database (either uni- or bidirectional). Finally, when the sync process starts the databases will receive Insert, Update and Delete triggers, which will lead to a push data changes into a table that eventually finds its way to the Hub. Next, the member databases pull this data. The Sync group contains a Conflict Resolution Policy, which handles conflicts by applying the policy Hub Wins – the Hub will overwrite data in the member or vice versa with the Member Wins. Note that with multiple members, the final value depends on which member syncs first.
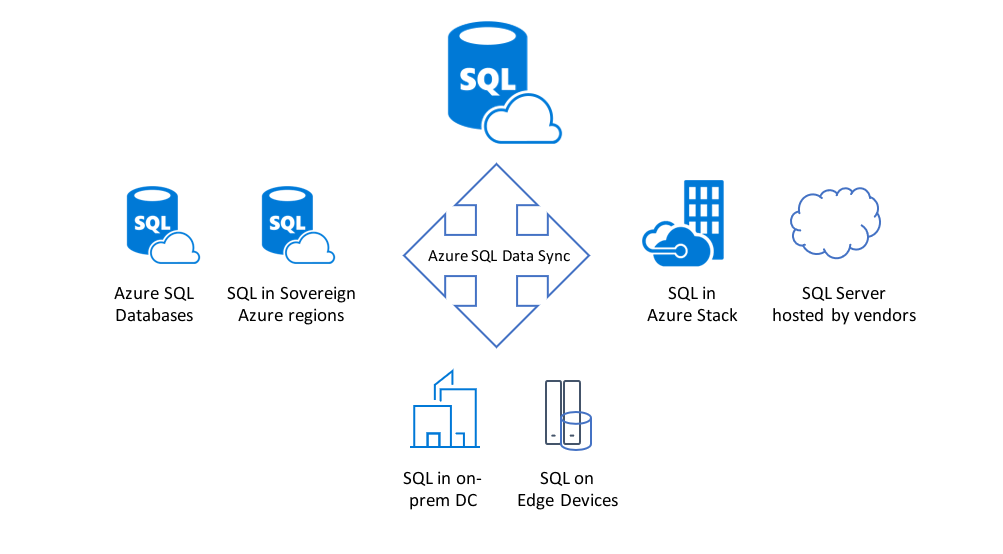
Source: https://azure.microsoft.com/en-us/blog/announcing-the-general-availability-of-azure-sql-data-sync/
Azure SQL Data Sync does have various limitations, ranging from no support for Timestamps to eventual consistency. Furthermore, data sync uses triggers for database changes, and these can impact performance according to the documentation. However, the intent of SQL Azure Data Sync service, according to Richard Speed in the same theregister article, is:
To be fair, Microsoft is clear that users should not use this technology for disaster recovery or scaling up Azure workloads, nor is it intended to replace the Azure Database Migration Service, to shift on-premises SQL to Redmond’s cloud. The software maker sees it filling a niche for customers who want an up-to-date copy of their data for reporting and analytics purposes.