Month: February 2021

MMS • RSS
Article originally posted on Data Science Central. Visit Data Science Central

Big data analytics is concerned with examining data to uncover correlations, hidden patterns, customer preferences and market trends that can enhance decision-making. People are advancing the data science careers to become data analysts and data scientists who together are transforming data competitively.
By using analytics, institutions of higher learning are seeking to gain a competitive advantage over their rivals in the industry. Here are the key benefits of using big data analytics in higher education.
Facilitates adaptation
Big data analytics is commonly applied in the smart learning industry driven by growing e-learning acceptance in universities and colleges. By identifying data trends, you can form new classes, modern teaching strategies, and great methods to bring satisfaction among students.
Community colleges are dominated by adults who have to balance families and work with their education. Having a flexible schedule can allow them to adapt easily so that they can realize their academic goals. With the advanced technology, many students find online learning more convenient than evening or weekend classes.
According to tech experts from the coursework writing services, since online learning is ideal for classes that are not highly practical, big data can reflect the specific numbers behind a trend. For instance, it is easy to establish why a particular class enrollment has been consistent compared to another. Thus, you can adjust how you offer courses accordingly to ensure you are giving the students the best.
Customer personalization
Customer satisfaction is one of the key drivers of building business brands. Most successful institutions use big data effectively hence contributing towards improved user experience.
As mentioned on AssignmentHolic, if you want to promote a product or develop content, you need to focus on email marketing. Big data can allow you to design effective ways of personalizing content to make it more appealing. With specialized personalization software, you can determine the content that each student should receive.
With a predictive analysis of big data, you can deliver more than the expected recommendations. The machine learning algorithms are optimized to apply the behavioral data that is already available. Data becomes more useful when you want to determine what the students might be interested in.
Having big data analytics tools that can understand your customers’ position is important in building brand loyalty. Having a campaign that can evolve with your customers to appeal to their interests can improve subscriber retention and improve the customer base.
Improves marketing
Specialty companies collaborate with colleges and universities to attract people who are interested in higher-learning facilities. They use data in various ways and this is distributed via social media and email.
Much of the data comes from places that students visit frequently as they are preparing to go to college. Strategic data mining allows universities and colleges to make marketing relevant. If an institution has an excellent program and a student indicated that they want to enroll in that program, marketing materials about the program may be available.
The universities should market carefully to avoid cases of making the prospects overwhelmed with excessive correspondence. Universities can use big data platforms to track the outcomes of the marketing efforts. If, for instance, a student calls regarding some materials they received via email, the institution may want to send other materials.
Enhances operational efficiency
When your institution is running, you may spend time trying to improve the efficiency of operations. Operational efficiency revolves around streamlining processes, getting and feedback from team members, and technological innovation.
Colleges and universities use big data analytics to enhance processes and keep your business geared towards innovation. They can forecast and predict results concerning student enrollment with greater precision. This may allow them to embark on accurate planning to grow businesses.
According to the reports of the assignment help services, you can continually improve operational efficiency by incorporating important business metrics in the data analytics processes. A growing institution needs to track data analytics in terms of students’ retention, new student acquisition, and revenue. Revenue data needs to be continually mined to determine trends and find the meaning behind results.
Creates revenue opportunities
Institutions should evaluate the performance of departments or courses according to performance indicators such as the revenue or the number of students. They can utilize portfolio analysis to gain insights into market dynamics.
Understanding customers and their respective needs can be used to drive the performance indicators in the right direction. Colleges can benefit from revenue growth by aligning the direction to the students’ needs and having an accompanying message they can resonate with.
Big data can be analyzed to create insights to facilitate better decisions and create strategies to generate more revenue. Institutions can use big data analytics to understand what happened in the past and determine how events took place the way they did.
This can help the institution to redefine the revenue growth objectives and act accordingly. Institutions can use analytics tools to understand customer concerns better and make changes that can increase revenue.
Saves costs
Optimal allocation of resources is crucial in meeting goals in higher education and data is key to efficiency. Data can give you insights regarding the numbers of students enrolling in different sections of classes. If, for instance, a class has four sections and only one is full, the rest can be merged to save space, energy, and time.
From the infrastructure perspective, cloud-based systems can be used to cut storage costs significantly, thereby relieving pressure from the IT department. If data were to be sorted manually, it might be time consuming and expensive.
Data analytics can allow your employees to spend time on more beneficial tasks. An analytics program can automate most of the tedious work and the convenience of digital information enhances quick access to data that is cost-efficient in the long-run.
The higher education recruitment effort is also made easier. By checking past school performance, you can identify the prospective learners who may succeed in the institution and those who are likely to drop out. This can allow you to develop acceptance processes that can maximize the return on investment.
Conclusion
Businesses have moved from traditional data analysis to advanced and effective big data analytics. The institutions of higher learning that adopt big data analytics can stay competitive in the market and attain overall growth. They can fix issues and address the urgent needs while uncovering hidden insights. Those that fail to adopt the technology may find themselves struggling to attain their goals.
MMS • RSS
Article originally posted on Data Science Central. Visit Data Science Central

Big data is becoming a much-talked-about phenomenon across different fields, from marketing to IT. There’s an abundance of information on mining data resources, but the effect of analytics is only seen if it can bring meaningful change.
As far as eLearning is concerned, you have to ask yourself what you will do with the charts and stats. If you need to learn how to manage big data in eLearning effectively, here are some tips that you can use.
- Find resources for your key data.
According to the reports of the , many eLearning professionals have a problem with where to get big data. Rather than trying to choose the best source, try to broaden your scope more and get a large amount of data. No matter how large the data is, you can always narrow it down. You can look into some data resources: focus group findings, website stats, social media polling, learning management system analytics, etc.
- Have clear objectives for your data
You must make sure you clearly define the objectives and goals for the data you are collecting. Why are you collecting it? What goal do you want to achieve from analyzing the data? For instance, if the objective is “Employee Skill Management,” you have to be clear on the skills that need improvement and the metrics that define improvement.
- Rationalization of data
It is essential to rationalize your big data. The truth is, not all data that you gather at the point can be useful to you. Some of the data will be actionable in line with your set objectives or goals, and some won’t. This is why you have to rationalize your data depending on your objectives and goals of your analysis.
- Narrow down the data
Once you have your data resource, you should compile the data/information you need and narrow it down.
Some data will have more value than others to you depending on what you need at the time. This is why it is essential to set your objectives first to know which data you need. Make sure you are specific.
For instance, if the goal is to improve employee performance, you have to identify the tasks or skills to focus on and measure their proficiency levels. However, the fact that you aren’t using the data now doesn’t mean you won’t use it later.
- Use data analysis tools.
After collating the data, you need the right data analysis tool to analyze the data. Most of the time, corporate Learning Management Systems (LMS) come with analysis tools for big data. However, if it doesn’t come with a data analysis tool, then you need to get other third-party tools such as Google Analytics to get the work done. This will help you get an idea of the interaction of your student with the online course.
- Look for patterns and trends in eLearning
As you analyze your data, patterns and trends in eLearning will start to emerge.
If you choose data to address your objectives and goals, you will get your answers from these trends and patterns. For example, LMS analytics may make you realize that your simulations are too basic. This would mean that learners don’t get as much experience and skills to boost their performance. So you must add more realistic elements in your eLearning and conduct a thorough analysis of your tasks.
As stated in an eLearning help with dissertations and dissertation writing service, not every trend you notice in your analysis and ideas comes to mind at the time. After analyzing the data, take those notes and create your next line of action.
- Create a priority list
Having several goals to reach means that you have to create a priority list for your big data. This will allow you to focus on one thing at a time. Look up the most urgent problems, address them first, and determine which problem can wait for the longest. If there are issues stopping your online learners from fully enjoying the benefits of the online course, you should deal with them immediately.
For instance, if a module is too challenging, it can easily frustrate online learners. This will decrease their engagement and motivation. Carry out an analysis of your online learners’ feedback, identify their problems, and seek to improve the overall course.
- Protect your big data
Big data is an asset that you should passionately protect as it is precious. Make sure you encrypt your source and verify all your information. According to the reports of the data security from Essaygeeks, retailers use security measures like data masking to ensure the safety of their consumer information. As an eLearning professional, you must do the same as well. Ensure your learner information is secure. Be sure to put authentication protocols and secure connections in place.
- Know when to or not to outsource
You can manage your big data by yourself if you have enough resources, but if you are working with limited resources, then you should try to outsource it. The good thing is, numerous big data consultants can do the work well for you. These consultants can help with monitoring and analyzing your information. They can help you discover other sources of data that are untapped. Chief data officers can help you boost the ROI from your eLearning by helping you to identify areas where you can improve and pinpoint patterns that you missed.
Conclusion
Managing and analyzing big data is vital for everyone in the eLearning industry. You have to use big data to bridge performance gaps and improve tasks’ proficiency, especially if your current strategy isn’t producing these results.
MMS • RSS
Article originally posted on Data Science Central. Visit Data Science Central

This blog is the second part in a series. The first part is The Bayesian vs frequentist approaches: implications for machine learning – Part One
In part one, we summarized that:
There are three key points to remember when discussing the frequentist v.s. the Bayesian philosophies.
- The first, which we already mentioned, Bayesians assign probability to a specific outcome.
- Secondly, Bayesian inference yields probability distributions while frequentist inference focusses on point estimates.
- Finally, in Bayesian statistics, parameters are assigned a probability whereas in the frequentist approach, the parameters are fixed. Thus, in frequentist statistics, we take random samples from the population and aim to find a set of fixed parameters that correspond to the underlying distribution that generated the data. In contrast for Bayesian statistics, we take the entire data and aim to find the parameters of the distribution that generated the data but we consider these parameters as probabilities i.e. not fixed.
And also that:
Frequentists use three ideas to understand uncertainty i.e. null hypothesis, p-values and confidence intervals – which come broadly under statistical hypothesis testing for frequentist approaches.
Based on this background, we now explore the use of frequentist and Bayesian techniques in machine learning
Sampled from a distribution: Many machine learning algorithms make assumptions that the data is sampled from a frequency. For example, linear regression assumes gaussian distribution and logistic regression assumes that the data is sampled from a Bernoulli distribution. Hence, these algorithms take a frequentist approach
MLE vs MAP: Frequentists use maximum likelihood estimation (MLE) to obtain a point estimation of the parameters. Bayesians use Bayes’ formula to obtain the full posterior distribution. In this context, the posterior probability represents the conditional probability after the relevant evidence is taken into account. Based on the Bayesian theorem, the maximum a posteriori probability (MAP) estimate can be used to obtain a point estimate similar to the MLE.
Statistical paradigm: Both Bayesian and frequentist approaches are statistical paradigms and as such are used in multiple ways for the machine learning pipeline. For example in Bayesian hyperparameter optimization and Bayesian model selection
Small data and uncommon events Bayesian techniques are better suited when you are dealing with smaller data sizes, uncommon events
Generative classifiers: Naïve Bayes classifiers is a generative classifier based on the Bayes theorem. Assuming that the predictors are independent, Naïve Bayes performs well. See Naïve Bayes vs Logistic Regression
Unsupervised deep learning techniques like variational autoencoders can be understood as Bayesian inference problems
Markov Chain Monte Carlo (MCMC) techniques: Bayesian inference problems can sometimes be intractable. Methods like Markov Chain Monte Carlo (MCMC) can be used to implement a solution as a Bayesian inference problem.
Final notes
- The actual implementation of algorithms in APIs may include multiple techniques
- The discussion of frequentist vs Bayesian is only for model building and not for inference i.e. once a
In subsequent parts of this blog we will explore the difference between frequentist and Bayesian from the standpoint of parameterized models and statistical inference
Image source:
https://www.nps.gov/features/yell/slidefile/mammals/bison/Images/00230.jpg
MMS • Erik Costlow
Article originally posted on InfoQ. Visit InfoQ
Blizzard has published a blog discussing the way that their Diablo IV team debugs remote Linux binaries in Visual Studio through the use of Windows Subsystem for Linux (WSL).
Bill Randolph, Senior Software Engineer at Blizzard, explains the technique along with an explanation of why the team follows this structure.
…our team’s core competency is on Windows. Even our server programmers are most familiar with Windows development, and we appreciate the ability for all the programmers on our team to use a common toolset and knowledge base.
The other, and most important reason that we develop on Windows is the functionality and robust toolset provided by Visual Studio. There is nothing quite comparable in the Linux world, even if we were to develop natively in Linux.
Windows Subsystem for Linux is available for Windows 10 and provides users the ability to run multiple Linux distributions, with full shells and isolated environments, on a single computer. The experience is similar to virtual machines but does not require the same level of overhead for setting up and turning the VM on and off. Similarly instead of downloading each Linux distribution directly, users can install Ubuntu or other distributions directly through Microsoft’s AppStore.
The ability to debug Linux core dumps in WSL supports the backend services of Diablo IV rather than the frontend game that runs on Mac/Windows and consoles. Backend services support Blizzard’s Battle.net platform and include capabilities like online multiplayer, messaging, tournaments, and other features for how users interact with the game and other players.
Randolph explains the deployment structure for how builds occur, get deployed, and then how core dumps come back when unexpected errors occur. Builds occur on a Linux system (native, not WSL) and are then deployed through containers. An automated monitoring system detects when core dumps occur and brings the dump back along with the binary for further investigation by a member of the team.
The team is able to use a native Visual Studio analysis tool called Parallel Stacks, that provides a visual walkthrough and mapping between stacks and communication between threads. Similar to JDK Mission Control for Java developers, this gives a visual representation of what was happening on different threads as it relates to the stack or each thread.
This type of cross-platform build analysis is happening for many teams but is not suited for all cases. Randolph praises the capability.
Our team is very excited about the ability to debug Linux cores from our production environment in Visual Studio! It is a game changer for us, as it allows many more developers to actively diagnose problems “in the wild,” and it makes the powerful toolset of Visual Studio debugging available to all of us.
In favor of native Linux, JRuby developer Charles Nutter drew attention to a “subtle jab” at virtualized Linux environments written by laptop-maker System76, “Quickly compile your code with an 11th Gen Intel Core i7 CPU and up to 40GB RAM. Use all your favorite development tools in a native environment and drastically reduce post-deployment surprises.”
All development teams are free to make their own decisions about toolchains and techniques used based on their skillsets. The release date for Diablo IV has not yet been announced but the Visual Studio tools needed to debug Linux core dumps are available now.
MMS • RSS
Article originally posted on Data Science Central. Visit Data Science Central

Data integration involves combining the organization’s data from different sources to create one usable consolidated stream of data. When well-executed, data integration results in one accurate view which can be used for data analysis. With DQLabs, data integration is made seamless by utilizing AI-powered built-in connectors.
Benefits of Data Integration
- Gives a 360-degree view of the organization: This allows the management to make data-driven decisions that can lead to an increase in the organizations’ effectiveness and profitability.
- Utilization of all organization data: Most organizations are not able to utilize all the data that they correct because they can’t make sense out of it in isolation. Data integration brings together data that would otherwise not have been analyzed side by side.
- Access to up-to-date and enriched data: Data integration enriches the data by cleansing and deduplicating it as well as correcting formatting issues. It also provides real-time integrated data that can be used in strategy adjustment.
- Increases the value of the organization’s data: Because data is integrated and stored in a centralized system, the analyst can identify inconsistencies and come up with a plan of resolving them. They can also recommend changes that are to be made in the individual silos to increase the quality of data that are in them. Over time the process of data integration will increase the overall quality and value of the data stored.
Traditional Data Integration
Traditional extraction, transformation, and loading tools are slow, error-prone, and time-consuming. Data analysts spend a lot of time going through the data, comparing the schemas and formats. Where an organization has a large amount of data, this process can be very expensive and not end up providing the expected quality of consolidated data. The slow process of integration results in a delay in the generation of valuable insights to be used in decision making.
Traditional data integration also provides integrated data as batches and not real-time. The lack of real-time consolidated data means that the organization can’t get up-to-date reports.
Modern Data Integration
Augmented data integration tools provide an organization with real-time consolidated data. They also provide the ability to store, stream, and deliver any data when needed from any cloud warehouse. It is possible to perform an error check on streaming data thereby enriching it at a faster rate which reduces the time from integration to usable, accurate insight.
DQLabs utilizes AI/ML algorithms to provide a “just-in-time” data processing map and data management infrastructure that solves requirements for data fabric designs, augmented data design, and multi-cloud data management. By tracking the flow of data during the integration process, modern data integration tools can reduce the possibility of data loss or security breaches. This also ensures that individual data flow streams can be analyzed for inconsistencies, thus reducing the possibilities of errors.
MMS • Erik Costlow
Article originally posted on InfoQ. Visit InfoQ
Gluon founder Johan Vos recently appeared on the Airhacks.fx podcast, discussing the growing usage of JavaFX for cross-platform mobile apps in App Stored. Meanwhile, ControlsFX 11 has been released to add new cross-platform visual components.
The work builds on substantial work driven by the OpenJFX community and Gluon as both have coordinated work to enable cross-platform apps. In the podcast, Vos discusses the changes that happened between former Java graphical frameworks Swing and AWT, neither of which have a noteworthy mobile presence. Various to-do list style apps exist in OpenJFX as well as two games: SpaceFX, a space-shooter for defeating enemy ships and asteroids that requires JDK 13, and 2048FX, a block-based math puzzle game. Developers can obtain the source code directly to run on their computer or raspberry pi, then cross-compile each game to run on their mobile device through the GraalVM-based native packaging system.
SpaceFX includes full documentation for building and deploying the game into a development computer and Apple iOS. The developer, Gerrit Grunwald, includes additional documentation for running the game in a browser through use of JPro. Unlike the deprecated browser plugin of Applet and Web Start applications, JPro does not uses a plugin and instead uses native HTML, JavaScript, and CSS techniques combines with a backend system that manages some processing and storage. The resulting combination of tools is a single application built and development once that runs on a desktop/laptop through standard Java, runs on mobile devices through Gluon, and runs in a browser through JPro.
The same podcast discusses performance of native applications across different platforms. Native-compiled Java applications leverage GPU acceleration on different devices over OpenGL and EGL. Mac users also automatically leverage a new rendering pipeline through JEP-382, which facilitates an under-the-hood shift from Apple’s deprecation of OpenGL to favor their newer Metal framework. Developers of OpenJFX applications can be aware of this underlying shift but are not required to engage the framework at this level, as the rendering happens automatically inside OpenJFX under a layer of abstraction.
Abhinay Agarwal announced the release of ControlsFX 11 to add a new SpreadsheetView and TableView2 for improving graphical application presentation. ControlsFX features a large array of interactive graphical components for building JavaFX applications, all of which can be seen in the open source FXSampler application. This includes many common components, such as GridView, Notifications, sliders, a TaskProgressView, and many other controls.
The ControlsFX team has built out strong documentation to match the framework itself. The online and downloadable JavaDoc contains clear and concise information about each component including code samples for how to initially use and populate the component. For example the TaskProgressView documentation contains sample code to demonstrate a visual update of multiple background processes.
Developers looking at designing mobile applications can engage each tool to suit their needs. Standard Java implementations like Zulu and Adoptium as well as OpenJFX can be used freely, while Gluon (Gluon pricing) and JPro (JPro pricing) provide a mix of free and commercial products with different levels of usage.
MMS • RSS
Article originally posted on Data Science Central. Visit Data Science Central
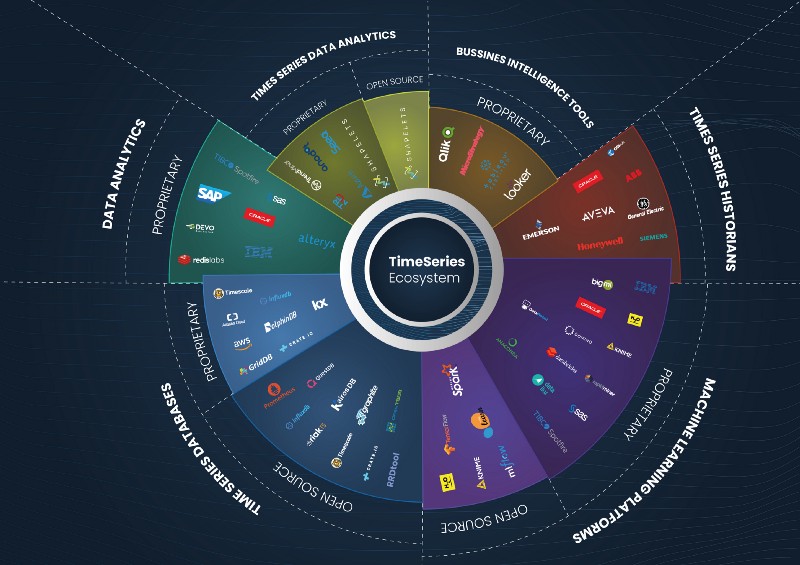
The Time-Series ecosystem
Time-series analysis has been studied for more than a hundred years, however, the extraordinary growth of data available from numerous sources and more frequent growth of data alongside the growth of computer power (GPU & Multicore) makes the analysis of large-scale time-series data possible today in a way that was not previously practical.
The use of time-series data has been traditionally linked to sectors where time is not just a metric but a primary axis, such as in finance, Industrial IoT, and energy. However, in the last 10 years, it is starting to be generally used in other sectors such as marketing, gambling, or any other sector where performance monitoring and time-series analysis is needed.
There are three main solutions in the ecosystem to treat, analyze, and visualize time-series data. These are Time-series Databases, Time-Series Data Analytics Solutions, and Machine Learning Platforms. Apart from these, there are also generalist data analysis and BI tools that incorporate some specific features for time-series, but our main focus will be on the first three solutions mentioned.
Let’s see who the main players from each solution are.
Time-Series Databases
A History of Historians
The very first technology used to digitalize and manage time-series data dates back to the 1980s in what is called operational historians. Historians are prehistoric versions of time-series databases mainly used in the industrial and manufacturing sector with a focus on collecting data from heterogeneous environments. They are typically used alongside Programmable Logic Controllers (ruggedized industrial digital computers) and Distributed Control Systems (Computerised control systems for a process or a plant) with their main task being to monitor all critical systems in industrial plants.
Some of these historians’ providers are big conglomerates, such as General Electric, ABB, or Emerson Electric. Meanwhile, the leaders in the sector are also software vendors offering this specific solution, such as AVEVA or the market leader Osisoft.
Industrial corporations keep using these solutions to monitor critical systems and are highly dependent on them.
The advantages of historians, which are mainly related to the manufacturing specification these products have been designed for, are the following:
- A great variety of connectors for data collection from all kinds of sensors.
- The capability to handle and compress a huge amount of data.
- Dashboarding for monitoring and data analysis.
- Aggregation, data cleansing, and data enrichment.
However, this specialization for the manufacturing sector also brings many drawbacks, such as:
- Most historians are built on massive amounts of old legacy systems and are not updated to modern best practices of software engineering.
- These solutions are expensive and costly to manage, run, and customize, which is the reason why most of them are offered alongside consulting services or a support team, which means an extra cost.
- These solutions are complex and difficult to integrate with modern systems.
The First Players
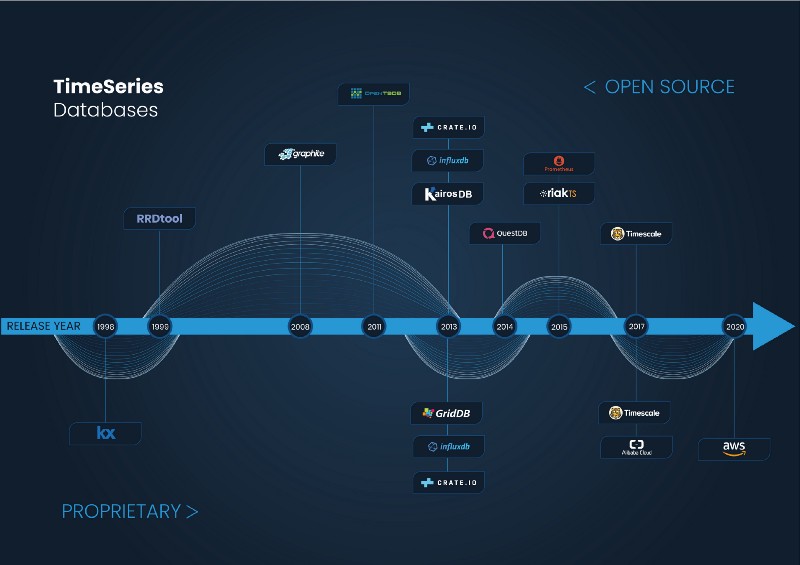
In the 90s, with the advent of new technological advances, the first time-series databases as we currently know appeared.
The first time-series database was most likely Kdb+, a proprietary solution for the financial sector created by an ex-Morgan Stanley and UBS employee, Arthur Whitney. Kdb+ is a column-based relational time-series database with in-memory capabilities, whose first release was in 1998. It is mainly used in high-frequency trading and was developed in a very peculiar language called q. Kdb+ is extensively used in the financial sector and is currently the second most popular time-series database in the world, according to the DB-Engine ranking. According to different reviews, Kdb+ is a very powerful tool but expensive and difficult to learn and work with. Around the same time, the first open-source time-series database, the RRD Tool, appeared. This piece of software came about after the initial creation of the MRTG program aimed to monitor the network of the students from De Monfort University of Leicester in the UK.
The creator of the RRD Tool is the Swiss engineer, Tobias Oetiker. The idea originally came from the program, MRTG, which he so happened to create while working as a system administrator trainee in 1995. Tobias was inspired to make another program that could be used as a standalone time-series database. Years later in the summer of 1999, Tobias was able to complete this program during a work exchange in San Diego, California with the company CAIDA. Tobias was able to release the first version of the RRD Tool, which continues to be one of the most popular time-series databases in the world.
Years later, a similar story happened with the open-source project Graphite. Graphite started out as a side project by Chris Davis, a software engineer working at the travel aggregator, Orbitz. Chris created this tool as a foundational monitoring tool to track the performance of their websites, applications, business services, and networked servers in 2006. The company authorized Chris to make it open-source, and the project was released in 2008 under the Apache 2.0 license. It quickly became a very popular tool that has been used by companies like Etsy, Booking.com, and even Github.
During this time, Kdb+ continued evolving up until today, offering new features and capabilities, while expanding its operations to other sectors. On the other hand, RRD Tool and Graphite have been maintained by the community, keeping its main features limited in terms of simple data models and standalone capacity.
Big Data Series
In the last 10 years, the rise of Big Data and the need for high scalability have caused the real emergence of many time-series databases projects and companies.
One of the main characteristics of this new wave of time-series solutions is that most of them are either open-source or at least offer an open-source version of their product.
Time-Series Databases release year
It is obvious that time-series data is becoming more and more popular. This popularity can clearly be seen in the classical DB-Engine graph that appears in almost every single time-series database blog page. This graph explains how over the last 24 months, time-series databases have been the fastest-growing category among different databases.
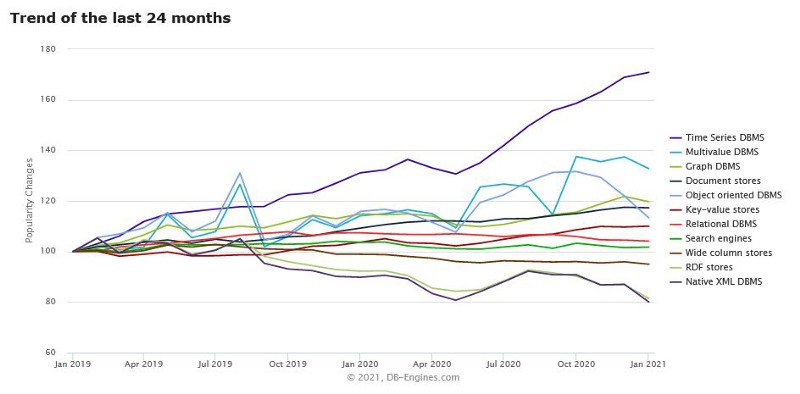
DB.Engines Databases trend as for Jan 2021
In terms of functionality, most time-series databases offer the ability to store time-series data in an efficient and scalable way, with the possibility to perform queries through SQL, NoSQL, or a DSL (in the case of influx with Flux). They also offer considerably basic analytics functionalities, mainly focused on data transformation or normalization.
As it usually happens in the database world, there is a hard fight between the main actors, regarding the high performance and scalability of databases. There are numerous posts and benchmark studies comparing the performance of one database versus another. In an interview with David G. Simmons, former Developer Evangelist of Influxdata and QuestDB, he was asked how he saw these benchmarks. His response brought great insight when he mentioned that his mother was a well-renown expert in benchmarking supercomputers and she used to say that “there are lies, damn lies, statistics, and then there are benchmarks.”
It is also worth mentioning that most time-series databases do not offer a visual layer, and what they usually do is to integrate with Grafana, or first with Prometheus and then with Grafana. Because of this, Grafana has successfully established itself as the default visualization tool for most time-series databases.
With regards to the most common solutions provided by the main time-series databases, there are three worth mentioning:
- DevOps and infrastructure monitoring on large scale deployments
- IoT monitoring
- Network monitoring
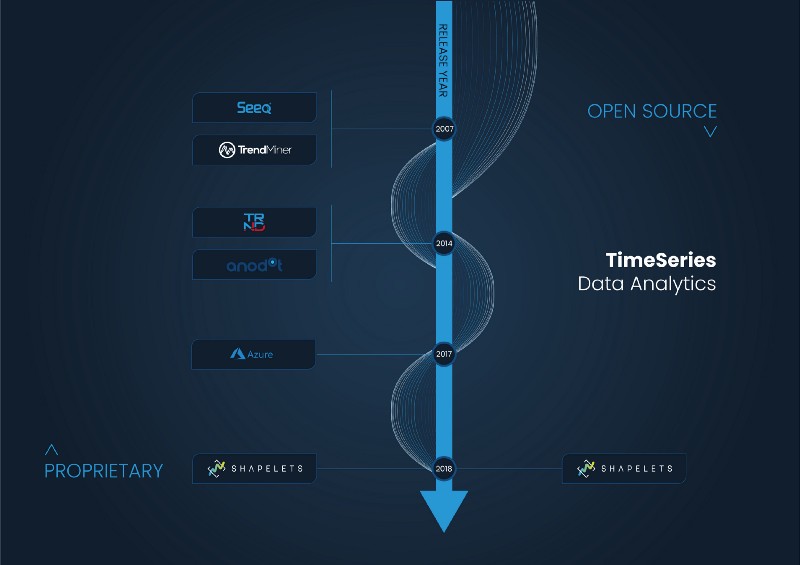
Time-Series Data Analytics Solutions
Data analysis solutions for time-series are relatively new in the market. They are not focused on collecting or storing data but rather on the analysis and the visualization of the data.
As well as modern time-series databases, these products have also appeared in the last 10 years with the rise of Big Data.
One of the main peculiarities of these solutions is that most of them are proprietary; their company size is smaller than historians or time-series database vendors.
Common features and use cases offered by these products are models of anomaly detection, aggregated statistical averages, pattern recognition, as well as classification and predictive models.
Among the more traditional time-series analytics platforms, Seeq, Trendminer, and Trendalyze stand out. These companies are focused on the industrial sector and offer their solutions as a complement to the analytical and BI part of operation historians. In general, the interfaces of these solutions usually have a very strong industrial look and feel with a resemblance to a large Excel dashboard.
Apart from these solutions, it is important to mention three other time-series analysis platforms that offer a more contemporary look and feel and are not only focused on industrial sectors. They are Anodot, Azure TS Insights, and Shapelets.
Anodot is an Israeli company that offers monitoring solutions in digital sectors, such as gambling and e-commerce, finance, and telecommunications.
Azure TS Insights is a Microsoft project, focused on IoT companies, that complements other Azure storage tools from the Redmont giant and offers a simple yet intuitive interface.
Finally, Shapelets is a Spanish company that offers an open-source library of innovative time-series analytics (pattern discovery, causality, motifs and discords) as well as a proprietary platform. Its use cases are focused on sectors such as energy, industry IoT, aeronautics, and health.
Time-Series Data Analytics solutions
Machine Learning Platforms, Data Analysis, and BI Tools with TS Features
Lastly, another important aspect to highlight is the tools that offer Machine Learning techniques, data analytics, as well as BI tools that have specific functionalities for time-series analysis.
Machine Learning solutions include H2O.ai, DataRobot, Knime, or Databricks (together with the tools of the Spark ecosystem). These solutions offer different options for automation, manipulation, and the creation of models with the capacity to find anomalies and make predictions using classic time-series algorithms.
These vendors usually offer proprietary and open-source products to engage with data scientists that are easily integrated with open-source machine learning libraries, such as Tensorflow, Scikit-Learn, or MLFlow.
Among the data analysis solutions, apart from the big players such as IBM, SAS, Oracle, etc., there is an endless number of software vendors, such as Redislabs, Devo, Alteryx, Datameer, etc. These software programs offer some functionality focused on time-series. Among the most common are anomaly detection, system and application monitoring, aggregations, and other simple operations for time-series modeling.
Finally, we must mention data visualization/ business intelligence software companies such as Tableau, Qlik, Power BI, Looker, and Microstrategy. These platforms offer proprietary software consisting of a visual layer for time-series exploration and some of them include simple built-in analytical functions.
In conclusion, the ecosystem of solutions for time-series data has grown exponentially in the last 10 years with the advent of new technologies to manage data more efficiently and in a distributed manner. New academic research, like the Matrix Profile, has also added many new analytic approaches to get insights from time-series data.
In evaluating the direction of time-series data, we can see that data storage is well established with various free options available. Even data monitoring and troubleshooting have been present in the time-series ecosystem for years. These are important solutions for time-series data, but what seems to be key in further advancing the time-series ecosystem are the tools to help identify the interesting data.
In the upcoming years, we can expect to discover new storage solutions with higher performance and better scalability, but the real advantages will come from the analysis of time-series data. As the creator of the RRD Tool, Tobias Oetiker, says the future of time-series software is in “automatic systems, whether you call it machine learning or [by any other term], which analyzes and shows you the interesting bits out of the huge amount of data we collect.”
MMS • RSS
Article originally posted on Data Science Central. Visit Data Science Central
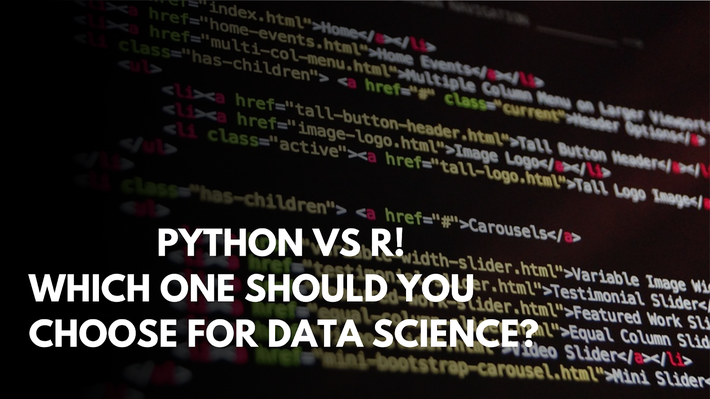
Increased consumption of data, more powerful computing, and the strong inclination towards data-driven decisions in business have made data science a crucial part of today’s business environment. According to IBM, there is a huge demand for data scientists and data analysts in the present time.
Python and R are the two most popular tools for programming for data science. Python and R both are open-source and free and were developed back in the early 1990s. For practitioners of machine learning and data science, these two tools are absolutely essential.
While both R and Python are competing to be the data scientist’s language of choice, it’s very hard to decide any one of them. So, in this article, we will be doing a comprehensive comparison between Python and R.
A Brief Overview of Python and R History

Python
Python was released back in late 1989 with a belief that emphasizes code readability and efficiency. Python is an object-oriented programming language, which means, it groups the code and the data into objects that can interact with one another. This modern approach allows data science practitioners to perform their work with better stability, code readability, and modularity.
Python’s suite of libraries includes popular tools like Keras, sci-kit-learn, and TensorFlow, which allows data scientists to develop advanced data models.
R
R is a procedural language developed back in 1992 and it remained the data scientist’s preferred programming language for years. R serves tonnes of advantages when it comes to building data models because it makes it easy to understand how complicated operations are carried out; however, at the loss of performance and code readability.
To help data science practitioners, R’s analysis-oriented community has developed open-source packages for specific complex models that a data scientist would otherwise have to build from scratch. R also maintains quality reporting with support for clean visualizations and frameworks for creating interactive web applications. Though there are few problems with R like a lack of key features like web frameworks and unit testing and slow performance.
Now, let us try to understand the usage of both R and Python in the data science process:
- Data Collection
- Data Exploration
- Data Modeling
- Data Visualization
Data Collection
Python
Python supports various kinds of data formats, be it CSVs or JSON sourced from the web. Even SQL tables can be directly imported into your code. Python’s requests library allows users to take data from different websites with just a line of code.
R
You can import data from CSV, Excel, and Txt files into R. SPSS and Minitab format files can also be turned into R data frames. Though R is not as versatile as Python at grabbing information from the web, it can handle data from all the common sources.
Data Exploration
Python
Python provides us data analysis libraries like Pandas to discover insights from the data. With this, you can sort, filter, and display data in a matter of seconds and the best part is that it can handle large amounts of data without any lags.
Pandas is formed into data frames, which can be redefined several times during a project. When required you can also clean the data by filling in non-valid values i.e, NaN (not a number) with a value that makes sense for numerical analysis.
R
R was primarily built for numerical and statistical analysis of large datasets, so no wonder it has so many options while doing data exploration. You can apply a variety of statistical tests to your data, build probability distributions, and use standard data mining and machine learning techniques.
Basic R functionality incorporates the basics of analytics, signal processing, statistical processing, random number generation.
Data Modeling
Python
Python has a library known as Numpy which you can use to do numerical modeling analysis while for calculation and scientific computing you can use SciPy which is open-source Python-based software for science, mathematics, and engineering. You can access tonnes of machine learning algorithms with the Scikit-learn library. Scikit-learn has an intuitive interface that allows you to tap into the power of machine learning.
R
To do special modeling analyses, sometimes you will have to rely on packages outside of R’s core functionality as it doesn’t have one of its own. Though there are loads of packages out there for analyses such as the Poisson distribution and mixtures of probability laws.
Data Visualization
Python
The IPython Notebook has tonnes of options to visualize data. To generate basic charts and graphs from the data embedded in your Python you can use the Matplotlib library. And in case you want more advanced graphs you can go for Plot.ly. It takes your data through its intuitive Python API and splutters out amazing graphs and charts that can help you manifest your point just exactly as you want it to.
R
When it comes to statistical analysis and demonstrating the results, R easily wins the game. R is best suited for scientific visualization and comes with several packages specially designed for the graphical display of results. With the base graphics module, you can make all of the basic plots and charts from the data matrices. And for complex scatter plots with regression lines, you can use ggplot2.
Conclusion
Python is a versatile programming language that you can pick up pretty easily even when you don’t have much experience with programming. Python can be used for a variety of tasks and learning it will immensely help you in your data science career.
On the other hand, R is specially designed for data analysis which is an integral part of data science. Learning R is crucial if you want to make a long-lasting career in data science.
Frankly, learning both R and Python is crucial and both have their respective uses and strengths.
MMS • Bruno Couriol
Article originally posted on InfoQ. Visit InfoQ
Evan You, creator of the Vue.js front-end framework, recently presented at the Vue Amsterdam 2021 conference the latest and future Vue developments.
You emphasized that Vue 3 was a huge release to which parts of the Vue ecosystem are currently adjusting to. Vue Router 4 and VueX 4 are now stable and support Vue 3. Other parts of the ecosystem (e.g., Nuxt, Vuetify, Quasar, Element Plus, Ant Design Vue are catching up.
Future developments in terms of development experience revolve around three axes: build tools, authoring experience, and IDE support. While Vue can be used as a drop-in runtime library, You sees Vue as a framework that is supposed to provide a cohesive and comprehensive development experience. You explained:
I am a Vue user as well; and every time I’m trying to spin up a Webpack-based Vue project, I have to go through the process of installing hundreds of megabytes of dependencies and then having to wait several seconds for a project to start up. […] I really miss the days where I could just open up an index.html, drop some code in it, and see it instantly start up, see it instantly reflect any changes I make.
[…] It seems to me the [that the] only logical conclusion is to figure out how to make things fast.
The Vite build tool, which is now framework-agnostic, is Vue’s attempt to deliver a fast build tool to Vue developers. Vite has taken some ideas from coincidental developments like Snowpack or WMR, and uses the ES modules support provided by modern browsers to speed up feedback loops in development. You said:
There are integrations — if you are primarily working with back-end frameworks like Rails or Laravel. There are already tools that allow you to use Vite in there, but you can also use Vite as a standalone Vue CLI equivalent for building SPAs [Single-Page Applications].
[…]
From my personal experience, some apps that would require more than 30 seconds to start with Webpack or Rollup […] now typically start within one or two seconds with a Vite-based setup. I believe this kind of speed improvement is so significant that it is worth rethinking how the whole tooling landscape should work.
In the short-term, Vite and the Vue CLI should co-exist, with a view to having them converge in the long term.
You further described ongoing experiments to improve the authoring experience. The <script setup > RFC experiments with a new script type in Vue’s single-file components that provides a more concise syntax for the setup function introduced in Vue 3’s Composition API. Another RFC lets developers declaratively describe stateful styles, with the compiled component leveraging CSS variables. The ref sugar RFC seeks to simplify the syntax of declaring and using reactive data (declared with the ref function in Vue 3’s composition API). The Vue developer community has been providing its comments to the ongoing RFCs.
In terms of IDE support, You emphasized that an increased number of users is expecting comprehensive type checking, code intelligence, and refactoring support in single-file component templates. Currently, Vetur, VueDX, and Volar are providing IDE support. You thinks that it is time to gather the results of these explorations in a single tool:
The problem is that the user experience right now can be a bit fragmented and confusing. If you’re starting a new project now, you have to decide which extension to use; or whether to go with the Visual Studio Code extension path; or go with the TypeScript plugin path; and how to get the best of all of these tools together without having to configure them individually.
Now I believe it’s time for us to sort of consolidate these efforts […] and present an official solution.
You estimated that 6 months after the release, around 8% of Vue apps are using Vue 3. You speculated that Vue 3 adoption may be slowed as users are waiting on parts of the ecosystem to support the new version. A better migration path and legacy browser support (IE11) may also help further adoption. You announced:
The next big focus [in the first half of 2021] will be the migration between Vue 2 and Vue 3. We want to figure out what’s the best way for people to migrate, or figure out what’s the best way to get the benefits of Vue 3 maybe without migration. [We also] want to figure out what’s the best way to keep the whole framework ecosystem moving forward with the given fact that Vue 2 is here to stay and the two major versions will coexist.
While the previously mentioned factors may have slowed down the adoption of Vue 3, it is also possible that Vue 3’s new features are not attractive enough or can be somewhat replicated in Vue 2. One developer detailed several ways to replicate or replace Vue 3 new features with Vue 2’s in an article titled Yes, Vue 3 is out but you probably don’t need it.
The Vue team also ambitions to provide better code reuse between Vue 2 and Vue 3, identify best practices for authoring libraries that work across versions, and rethink legacy browser support.
Vue.js Amsterdam is a yearly conference targeted at Vue developers with talks addressing the latest technologies and trends in software development.
MMS • Almir Vuk
Article originally posted on InfoQ. Visit InfoQ
Microsoft shipped out C# 9.0 as a part of the .NET 5 development platform release. .NET 5 is paired with C# 9.0, which brings many new features to the language. The new language features include records, init-only setters, top-level statements, pattern matching enhancements, target-typed new expressions, covariant returns and much more!
A big focus of C# 9.0 is an immutable representation of data shapes, and that is mainly represented with new record types and init-only properties. Usually, records are tagged as one of the most interesting new features in C# 9.0 version.
The record is a new immutable reference type in C#. The result of assigning them or changing the values is a creation of the copy of that object. This is the same way .NET treats the value types and the strings. Another immutable feature of the release are init-only properties, more precisely, init accessor, a variant of the set accessor which can only be called during object initialization for a particular property.
The biggest distinction from classes is that record types use value-based equality and they are immutable by default. Using them the whole immutable object is created, not just individual properties of it. Usually, to create immutable reference types, the C# forces you to write a bit of extra code.
There are a couple of advantages of records usage. They have more sense in a concurrent program with shared data. For those particular cases, the answer is the usage of records. They are the most elegant and useful feature to achieve immutability of your types in C#.
To create the record type, the record keyword needs to be used. In the example below, we can see the most simple example of creating a record type of a Person.
The Person record type below contains two read-only properties: FirstName and LastName. This is an immutable reference type and none of the properties can be modified once it’s been created.
public record Person
{
    public string LastName { get; }
    public string FirstName { get; }

    public Person(string first, string last) => (FirstName, LastName) = (first, last);
}
To create new value and represent a new state, C# 9.0 brings with-expressions support. The with-expression provides a copy of its record operand with the specified properties and fields which are modified. It is required that these properties have init or set accessor defined.
var person = new Person { FirstName = "Almir", LastName = "Vuk" };
var otherPerson = person with { LastName = "Casals" };
The complete specification for records immutable reference types can be found here.
Init-only setters are a new feature which can be declared in any type you want, not only in records. Init-only setters provide a nice approach to initialize an object without having to write a bunch of boilerplate code. They can be used for highlighting the property initializer syntax to set these values in creation expressions, but those properties are read-only once construction has completed. This can result in having a code which is easier to maintain and more readable. A common use-case scenario is for data transfer objects.The following example is contained in Microsoft’s official documentation. It shows the struct named WeatherObservation which has three properties with an init setter, and they are easily accessed by the ToString method.
public struct WeatherObservation
{
    public DateTime RecordedAt { get; init; }
    public decimal TemperatureInCelsius { get; init; }
    public decimal PressureInMillibars { get; init; }

    public override string ToString() =>
        $"At {RecordedAt:h:mm tt} on {RecordedAt:M/d/yyyy}: " +
        $"Temp = {TemperatureInCelsius}, with {PressureInMillibars} pressure";
}
More about init only setters can be found in the official language specification.
While writing simple programs and code files with C# it produces a lot of boilerplate code. Sometimes this can be overwhelming for beginners as it clutters up the code and adds levels of indentation to it. With C# 9.0 support of top-level statements, a simple hello world example looks like this:
using System;

Console.WriteLine("Hello World!");
It is important to notice that only one file in the project can use top-level statements, otherwise, the compiler will report an error. The error will be reported also if there is a combination of top-level statements with a declared program entry point method, like the Main method. Only one file can contain the statements and that would normally be in the Main method of a Program class.
As it is stated on the Microsoft documentation, “One of the most common uses for this feature is creating teaching materials. Beginner C# developers can write the canonical ‘Hello World!’ in one or two lines of code. None of the extra ceremony is needed. However, seasoned developers will find many uses for this feature as well. Top-level statements enable a script-like experience for experimentation similar to what Jupyter notebooks provide. Top-level statements are great for small console programs and utilities. Azure Functions are an ideal use case for top-level statements.”
With C# 9.0 you can also leave out the type on the right side. In case that there is a clear type that the expression is being assigned to. For example when there is a lot of repetition, like in an array or object initialization.
Point p = new (3, 5);

Point[] ps = { new (1, 2), new (5, 2), new (5, -3), new (1, -3) };
The details about target-typed new expression in the official language specification.
The minor but still important feature of this release is that local function declarations are now permitted to have attributes. Using them developers can make the coder cleaner and easier to read. David Fowler, software architect at Microsoft, already found a nice usage for it. In this Twitter post, he used the attribute for a local function inside of UseEndpoints middleware setup. There was a quite amount of comments and feedback about this feature exchanged there. More about the feature can be found in the official language specification.
C# 9.0 also brings new pattern matching improvements, more about pattern matching improvements can be found in the official language specification.
The full specification proposal for C# 9.0 is available. Also, the technical session presented at .NET Conf 2020 highlighting the new language features can be found on YouTube. C# 9.0 is included in the latest Visual Studio 2019 versions.