Month: May 2021

MMS • RSS
Article originally posted on Data Science Central. Visit Data Science Central

I got my second Pfizer Covid shot today, which means that I’m now part of the growing post-Pandemic population. Having been more or less in quarantine from the middle of March of 2020, I’m more than ready enough to leave behind the masks, to visit the coffeeshop and the barber and the gym, to be able to go into a restaurant without trying to eat around a 3-ply paper facial covering.
Concerns remain, of course, including strains of COVID-19 that seem to be resistant floating around, but we are also reaching a stage where the health care system is less and less likely to be overwhelmed by the virus, in whatever form it takes, which has always been the primary purpose of the lockdown. Here in Washington State, most restrictions should probably be dropped by the middle of June 2021.
However, in the next several months, it is very likely that the following scenario will be repeated over and over again. The company that you work for sends out email notices saying that, with the pandemic now in the rearview mirror, workers will be expected to return full time to the office, or face being fired.
Some people will do so without reservation, having missed the day-to-day interactions of being in an office. Many of them will be managers, will be older, and will likely be looking forward to being able to see everyone working productively just like the old days. While a broad oversimplification, let’s call them Team Extrovert. They thrive in the kind of social interactions that working in the office brings, and they enjoy the politics that comes from having a group of people forced to work in the same area daily.
The members of Team Introvert, on the other hand, are awaiting such emails with dread. For the first time in years, they’ve actually managed to be very productive because there have been far fewer unnecessary interruptions of their day, they could actually work later into the evening, could do so in an environment that they could control (more or less) and in general, could make the most of the time that they had.
Going back to work was going to mean giving up that flexibility. It will mean once again finding babysitters to get their kids to daycare or school, and dealing with a medical emergency will mean hours not working. It will mean losing a couple of hours a day in commuting on top of the eight-hour days that they work, will mean that if they are in meetings all day they will also have to spend the evenings getting the work done they couldn’t get done during the day. It will mean dealing with the unwanted sexual attention, the disapproval of the office gossips, the uncompensated late nights.
Evaluating Assumptions
The last year has been a boon for work researchers, as one study after another has field-tested several key assumptions about the work-life balance:

False: Technology Is Too Immature
“The technological underpinnings necessary to work from home were insufficient to being able to support it.”
Zoom came out of nowhere as a free-to-use telepresence platform to largely dominate the space in under a year. Market leaders in that space stumbled badly as they failed to recognize the need to be able to provide no-cost/low-cost telepresence software in the first months of the Pandemic. Microsoft pivoted quickly to provide similar software Teams for organizations that worked with their increasingly ubiquitous online Office suite, and Slack picked up the slack (in conjunction with a whole ecosystem of other tools) to fill out the collaboration space.
One significant consequence that’s now fully coming into fruition: Otter.ai – an online transcription service using machine learning-based algorithms, has now partnered with Zoom to enable auto-transcription (including figuring out who is speaking) and embedded call-to-action items into their generated output. This means that one of the most onerous tasks of conducting a meeting – creating an accessible record of the conversation – can happen automatically.
The upshot of this is that due to the pandemic, online teleconferences have suddenly become searchable and by extension manipulatable. The impact of this on businesses will be profound, if only because every meeting, not just those few that can afford to have a stenographer present, creates a referenceable record. This also has the potential to make meetings more productive, as it can help a manager identify who is actually providing valuable input, who is grandstanding, and who is being shut out. This form of collaboration is much harder to replicate in person.
False: Collaboration Requires Proximity
This is the watercooler argument. Collaboration, or so goes the story, is centered around the watercooler, where people can meet other people at random within the organization, and through conversations, learn about new ideas or work out problems. Admittedly, today the watercooler is more likely a Keurig coffee machine or it’s equivalent, but the idea – that collaboration occurs due to chance encounters between different people when in informal settings – is pretty much the same.
The problem with this is that it is a bit simplistic. Yes, ideas can come when people meet in informal settings, one of the reasons that conferences are actually pretty effective for stimulating new ideas, but the real benefit comes primarily due to the fact that the people involved are typically not in the same company, or in many cases not even in the same industry. Instead, during these encounters, people with different viewpoints (and different cultural referents) end up discussing problems that they have, and the approaches that they used to solve similar problems in different ways.
The key here is the differences involved. This is one of the reasons that consultants can be useful, but the more they become embedded within an organization, the less valuable their contributions. They are valuable primarily because they represent a different perspective on give problem, and it is the interaction that consultants have with a given, established group that can spark innovation.
Collaboration tools, such as Slack, provide both a way for disparate people to interact and provide a record of that interaction that can be mined after the fact. This kind of chat is largely asynchronous while being more immediate than other asynchronous communication channels such as email. Not surprisingly, programmers and technical people, in general, take to this form of collaboration readily, but members of Team Extravert (who tend to do better with face-to-face communication) often avoid utilizing this kind of collaboration because it doesn’t work as well for establishing social dominance, and because it isn’t synchronous.
False: Working in the Office Is More Secure
The idea that working in an office would be more secure than working remotely is a compelling one, since even a decade ago that would likely have been true. However, several changes, some pre-pandemic, some intra-pandemic, have changed that landscape dramatically.
For starters, by 2020, a significant number of companies had already begun moving their data infrastructures to the cloud, rather than using on-prem services. Sometimes the reasons came down to cost – you were no longer paying for physical infrastructure – but part of it also came down to the fact that cloud service providers had a strong incentive to provide the best protection they could to their networks. Most of the major data breaches that took place in the last ten years occurred not with large scale providers such as AWS or Azure, but with on-prem data storage facilities.
Additionally, once the Pandemic did force a lockdown, all of those supposedly secure on-premise data stores were left to sit idle, with skeleton crews maintaining them. The Pandemic hastened the demise of stand-alone applications, as these became difficult to secure, forcing the acceleration of web based services.
The global decision to move towards https: in 2017 also had the side effect of making man-in-the-middle attacks all but non-existent, and even keystroke analyzers and other sniffing tools were defeated primarily because the pandemic forced workers to distribute, making such hacking tools much less effective. Similarly, one of the biggest mechanisms for hacking – social hacking, where spies would go into company office buildings and note passwords and open ports or would conduct dumpster diving in company trash bins, was foiled primarily because the workforces was distributed.
Hacking still exists, but its becoming more difficult, and increasingly, companies are resorting to encrypted memory chips and data stores, and not social engineering, to keep data secure. Now, it is certainly possible that an enterprising data thief could make a surreptitious run of laptops at the local coffeeshop, but again, this is a high cost, low profit form of hacking.

False: Remote Workers Are Less Productive Than Onsite Workers
This is the tree falling in a forest principle: If people are not being watched over, how do you as a manager know that they are actually working rather than browsing the Internet for porn or otherwise wasting time. The reality is that you don’t. The question is whether you should assume that they will do the latter without some kind of oversight.
One of the most significant things to come out of the Agile movement is the shift in thinking away from allocation of hours as a metric of completion to whether or not the work itself is being done. DevOps has increasingly automated this process, with the notion of continuous integrated builds, which works not just for developing software but for assembling anything digital. In general, this means that there are tangible artifacts that come out of doing one’s work consistently, and a good manager should be able to judge whether someone is working simply by looking at what they are producing.
Indeed, this notion of an audit trail is something that remote workers are well aware of. With most productivity tools now tied into some kind of auditable dashboard, a manager should be able to tell when there are problems without in fact actually needing to see the people involved. However, for some managers this ability is a two edged sword, as their managers have access to the same dashboards, the same drawdown charts, and the same bug reports, rendering their oversight role redundant. This points to a bigger problem.
A number of recent studies have shown that when people have clear goals and targets, direct oversight can actually be counterproductive, because the workers, far from doing their best work, become worried that they are being judged unfairly for taking risks that could provide benefits. Put another way, this heavy oversight makes it harder for them to concentrate, which is what they are being paid for in the first place. In this light, the worker is branded a criminal who is setting out to deliberately steal from or sabotage their employers. Not surprisingly, this can become a self-fulfilling prophecy, as these employees leave to find better employment under less stringent oversight, causing disruption in their wake.
Managing a remote workforce is different, and can be especially difficult when one’s definition of management comes down to ensuring that workers are engaged and on task. There are comparatively few jobs, especially in-office jobs, that require 9 to 5 engagement. People need time to think, to plan, and to re-engage in interrupted tasks. This is especially true when dealing with mental activities. Context switching, reorganizing thoughts and concentration to go from one task to another, takes time, and the more the need for concentration, the longer such context switching takes.
One interesting phenomenon that has taken hold during the Pandemic has been that many businesses now concentrate their meetings during the middle of the week, rather than scheduling them at random through the week. arguably, this can be seen as creating a longer weekend, but in practice, what seems to happen is that people tend to use their Mondays and Fridays (or one of the weekend days) as days to concentrate on specific tasks without interruption. This helps them accomplish more with less stress. Workers still may provide a written report at the end of the day (or the week) summarizing what they’ve done, but this becomes part of a work routine, rather than an interruption, per see.
False: On-Site Work Improves Company Morale and Employee Loyalty
I’ve attended a few company picnics, holiday parties, and corporate retreats over the years. They are supposed to enliven morale and increase esprit de corps, but, in reality, they are fields filled with social land mines where you interact as little as possible with anyone that is not in your immediate group for fear of running afoul of a Senior Vice President or, worse, the Head of Human Services.
Company culture is an artificial construct. It does have its place, but all too often the putative company culture is set out in an employer’s handbook that everyone is supposed to read but few actually do. The actual company culture is mostly imitative, where one follows the whims and actions of the senior stake-holders in the company, even if these are potentially toxic.
Ironically, as the pandemic fades as a factor, corporate get-togethers may actually replace being in the office as the dominant mode of interaction. There are signs that this is already happening, especially as corporations become more distributed.

False: Everyone Wants To Return To The Office
Managers tend to be extroverts. They prefer face-to-face interaction, and in general are less likely to want to read written reports, even though these usually contain more information about how the projects are going. In some cases, written reports also make it harder to achieve deniability in case something does go wrong, though in this case you could argue that this is just a sign of bad management.
However, a significant percentage of the knowledge worker-based workforce are introverts. Introverts make up roughly 30% of the population, but that 30% corresponds to writers, designers, artists, programmers, analysts, architects, librarians, scientists, musicians, and other people who spend much of their time working in comparative solitude. When you factor this in, the number of people who are actually likely to be in offices probably comes closer to 55-60% of everyone who was in an office before.
This changes the dynamics of returning to the office (not returning to work itself, as none of these people deliberately stopped working) considerably. Most were more productive in the last eighteen months than they have been in years. Because they could work with minimal interruption (and that mostly asynchronous) and because they could control their environment, those largely introverted workers were able to use their skills more effectively.
Additionally, without the need to hire locally, companies could hire people anywhere. This had some unintentional side effects, as workers in San Franciso and New York migrated in droves towards smaller communities that were within an air-flight commute if need be, but were no longer forced into paying seven digits for a small house. A lot of companies made such positions contingent upon onsite-post-covid, but that provision may be impossible to enforce, especially as tightening labor markets in this critical sector make it a no-brainer for many people to opt to work elsewhere that has a more liberal work-from-home policy.
A recent Linked-In study made the startling discovery that, in their survey of members, if given a choice between working from home and a $30K bonus to return, 67% said they would prefer the work from home option. While this isn’t necessarily scientific, it hints at the reluctance that many people have to going back to the daily grind.
Are We At a Tipping Point?
As workers come reluctantly back to the office, there are several points of uncertainty that may very well derail such efforts.
- The pandemic is not yet over. One of the principle reasons for the initial lockdown was to keep the healthcare system from being overwhelmed. In those places where the lockdown was followed closely, this never happened. In those places where it wasn’t, the healthcare system was overwhelmed. With multiple variants still arising, and a vaccine that likely still needs additional tweaking, the prospect of the pandemic continuing (or flaring back up) for at least another year is not out of the question.
- Social resistance. Ironically, there are now many people who have taken to heart the social restrictions, and it will still be months, if not years, before, the habits ingrained into people during the pandemic are overcome.
- The threat of lawsuits. If a person goes back into the office, contracts COVID-19, and is left dead or crippled, is the employer liable? This really hasn’t been tested in the courts yet, and until it is, employers will be reluctant to be the first ones to find out.
- Worker mobility. Similarly, a tightening job market and two demographic trends are seeing many people retiring in 2021, fewer people entering the job market, and the natural consequences of ignoring employee loyalty playing out with more defections to new opportunities.
- Tech Trends. The technology for doing work from anywhere is clearly in the direction of distributed work. This means that financially, the benefits of bringing people in-house are far outweighed by distributing that same workforce.

What Do Managers Do Now?
If your company has not already been planning a post-pandemic strategy, hoping that things will return to normal, it’s likely getting almost too late to do so. Things will not return to the way that they were pre-pandemic, simply because the pandemic has accelerated where we would most likely have been ten years from now to today. This means that the post-pandemic organization is going to look (and act) very different than what it was in 2019.
There are several things that can be done to make the transition as painless as possible for all concerned.
Is The Office Even Required?
A number of companies had been skirting the edges of going fully virtual even before the pandemic, and as the lockdowns dragged on, decided to make the jump to a facility-less existence. The move cut down considerably on business costs, and when the need to meet in person (or meet with clients) came up, these same companies would rent out hotel conference space at a considerable savings. These companies and others like them are crunching the numbers to see if having the extensive physical presence is really all that necessary any more.
Evaluate Worker Safety
The pandemic is not going away. Rather, we are reaching a stage where COVID-19 is becoming manageable and survivable for most, albeit still a very dangerous disease for some. Before workers can return to the office, establishing a vaccine screening protocol should be considered carefully, with workers who are not yet vaccinated being considered high risk for return, and social distancing protocols should likely be taken into account for some time even when lockdowns are rolled back. It may also be worth bringing back employees in staggered tranches, with enough time between these (at least a month) to determine whether or not the virus is still spreading locally.
Triage
Identify those positions that absolutely must be on premises at all times, those that need to be on premises 2-3 days a week, and those that can work comfortably remotely. Be critical about your assumptions here: a facilities manager needs to be available or have back up, but an analyst or programmer usually does not. If someone is already working remotely and are at a physical remove, leave them there. After six months, re-evaluate. Chances are pretty good that you might you need fewer people onsite than you think.
Make Management and Reporting Asynchronous
To the extent possible, make tracking and reporting something that does not rely solely upon face-to-face meetings. Whether this involves utilizing Zoom or Teams-like meetings more, Slack, various DevOps tools or distributed office productivity tools, take advantage of the same tools (many of them part of the Agile community) that your teams are already using to communicate in an auditable fashion. Additionally, every day, each person should include a log entry at the end of the day indicating where they are, what they are working on, and what issues are needed. It is the responsibility of the managers to ensure that if conversations DO NEED to happen, that they are facilitated.
Move Towards 3-2-2
Move as many of your meeting as possible towards the center of the work week – Tuesday through Thursday – then treat Monday and Friday as concentration days, with minimal meetings but higher expectations. Demos and reports should always be held during a midweek-block. Similarly, identify core hours for availability during the week for team collaboration.
Improve Onboarding
Onboarding, whether of a new employer to the company or to a different group, is when you are most likely to see new hires quit, especially if badges or other access issues delay the process. Identify an onboarding partner within the group who is responsible for helping the newbie get access to what they need in a timely fashion, and who can help these new hires get ramped up as fast as possible. While this is useful for any new recruit, it’s especially important in distributed environments.
Buddy Up
When possible, buddy up coworkers in the same team so that they are also in the same time zone. If your operation is on the US East Coast but you have workers in Denver and Seattle, then those workers should be paired off. This provides an additional channel (and potential backup) for communication, while at the same time keeping people from having to work awkward hours because of time zone differences. This holds especially true for transnational teams.
Eliminate Timesheets
You are hiring people for their technical or creative expertise, not their time in seat. You can track hours through other tools (especially agile ones) for determining how long tasks take for planning purposes, but by moving to a goal oriented, rather than hour oriented approach, you reward innovation and aptitude rather than attendance.
Make Goals Clear
On the subject of goals, your job as manager is to make sure that the goals that you want out of your hires are clear. This is especially true when managing remote workers, where it is easier to lose sight of what people are doing. You should also designate a number two who can work with the other team members at a more technical or creative level but can also help ensure that the goals are being met. This way, you, as a remote manager, can also interface with the rest of the organization while your number two interfaces with your team (this is YOUR partner).
Hold Both Online and Offline Team Building Exercises
Start with the assumption that everyone is remote, whether that’s a desk in the same building, a coffeeshop, their house, or a beach with good wifi access. Periodically engage in activities that help promote team building, from online gaming to coffee klatches but that don’t require physical proximity. At the same time, especially as restrictions ease, plan on quarterly to annual conventions within the organization, perhaps in conjunction with conferences that the organization would hold otherwise. Ironically, it is likely that these meetings will become more meaningful because in many cases the only real contact you otherwise have with the organization is a face in a screen.
Don’t Penalize Remote Workers Or Unduly Reward Onsite Ones
Quite frequently, organizations have tended to look upon remote work as a privilege rather than a right, and it is a privilege that comes at some cost: if you’re not in the office, you can become effectively invisible to those that are. This means that when establishing both personal and corporate metrics, that you take this bias, along with others, into account to determine who should be advanced. Additionally, if your goal is near to full virtualization, it’s worth taking the time to identify who is most likely to be against such virtualization and understand their objectives. There are people who want to build personal fiefdoms who see virtualization as being deleterious to those ends. That too can contribute to corporate culture, and in a very negative way.
Summary
There are signs that many parts of the world are now entering into a period of overemployment, where there will simply not be enough workers to fill the jobs that are available. The pandemic has forced the issue as well, accelerating trends that were already in place by at least half a decade if not more. Because of this, company strategists who are relying upon the world going back to the way things were before are apt to be shocked when they don’t.
Planning with the assumption that work from anywhere is likely to be the dominant pattern of employment is likely to be a safe bet. For most organizations it provides the benefit of being able to pull upon the talents of people without having to physically disrupt their lives, giving them an edge against more traditional organizations that can’t adapt to that change. With better productivity and collaboration tools, the mechanisms increasingly exist to make remote work preferable in many respects to onsite work, but it does require management to give up some perceived control and discomfort with adaptation. Finally, the workers themselves may have the final say in this transition, voting with their feet if they feel there are better opportunities with more flexibility elsewhere.
Kurt Cagle is the Community Editor of Data Science Central, and the Producer of The Cagle Report, a weekly analysis of the world of technology, artificial intelligence, and the world of work.
MMS • RSS
Posted on mongodb google news. Visit mongodb google news

MongoDB, Inc. (NASDAQ:MDB) price closed higher on Friday, May 28, jumping 0.1% above its previous close.
Get the hottest stocks to trade every day before the market opens 100% free. Click here now.
A look at the daily price movement shows that the last close reads $291.64, with intraday deals fluctuated between $291.17 and $298.31. The company’s 5Y monthly beta was ticking 0.72 while its P/E ratio in the trailing 12-month period read 0. Taking into account the 52-week price action we note that the stock hit a 52-week high of $428.96 and 52-week low of $186.27. The stock lost -2.82% on its value in the past month.
MongoDB, Inc., which has a market valuation of $18.11 Billion, is expected to release its quarterly earnings report on June 03, 2021. The company stock has a Forward Dividend ratio of 0, while the dividend yield is 0. It is understandable that investor optimism is growing ahead of the company’s current quarter results. Analysts tracking MDB have forecast the quarterly EPS to grow by -$0.37 per share this quarter, while the same analysts predict the annual EPS to hit -$1.43 for the year 2021 and up to -$0.94 for 2022. In this case, analysts estimate an annual EPS growth of 0.44% for the year and -0.34% for the next year.
On the technical perspective front, indicators give MDB a short term outlook of 50% Sell on average. Looking at the stock’s medium term indicators we note that it is averaging as a 50% Sell, while an average of long term indicators are currently assigning the stock as 50% Sell.
Here is a look at the average analyst rating for the stock as represented on a scale of 1.00 to 5.00, with the extremes of 1.00 and 5.00 suggesting the stock is strong buy or strong sell respectively. Specifically, 18 analysts have assigned MDB a recommendation rating as follows: 4 rate it as a Hold; 13 advise Buy while none analyst(s) assign an Outperform rating. 1 analyst(s) have tagged the MongoDB, Inc. (MDB) stock as Underperform, with none recommending Sell. In general, analysts have rated the stock Overweight, a scenario likely to bolster investors out for an opportunity to add to their holdings of the company’s shares.
If we dive deeper into the stock’s performance we see the positive picture represented by the PEG ratio, currently standing at 0. The overview shows that MDB’s price is at present 6.93% off the SMA20 and 1.55% from the SMA50. The Relative Strength Index (RSI) metric on the 14-day timeframe is pointing at 55.27, with weekly volatility standing at 3.02%. The indicator jumps to 4.99% when calculated based on the past 30 days. MongoDB, Inc. (NASDAQ:MDB)’s beta value is holding at 0.72, while the average true range (ATR) indicator is currently reading 12.71. Considering analysts have assigned the stock a price target range of $265-$445 as the low and high respectively, we find the trailing 12-month average consensus price target to be $375. Based on this estimate, we see that current price is roughly -9.23% off the estimated low and 52.43% off the forecast high. Investors will no doubt be excited to see the share price rise to $384, which is the median consensus price, and at that level MDB would be +31.53% from current price.
Turning out attention to how the MongoDB, Inc. stock has performed in comparison to its peers in the industry, here’s what we find: MDB’s stock is +0.1% on the day and +25.78% in the past 12 months, while Paypal Holdings (PYPL) traded +0.21% in the last session and was positioned +67.74% up on its price 12 months ago. Another comparison is with Square (SQ) whose stock price was up 0.73% in the last trading session, and has flourished +174.44% over the past year. Also, Zoom Video Communications Cl A (ZM) showed uptrend of 0.1% while its price kept floating at 25.78% over the past year. As for MongoDB, Inc., the P/E ratio stands at 0 lower than that of Paypal Holdings’s at 59.24 and Square’s 365.39. Elsewhere in the market, the S&P 500 Index has rallied 0.08% in last trading session, with the Dow Jones Industrial also saw a positive session on the day with +0.19%.
An analysis of the MongoDB, Inc. (NASDAQ:MDB) stock in terms of its daily trading volume indicates that the 3-month average is 882.02 Million. However, this figure declines on the past 10-day timeline to an average of 519.6 Million.
Get the hottest stocks to trade every day before the market opens 100% free. Click here now.
Current records show that the company has 62.1 Million in outstanding shares. According to data from Thomson Reuters, insiders’ percentage holdings are 5.22% of outstanding shares while the percentage share held by institutions stands at 86.64%. The stats also highlight that short interest as of May 13, 2021, stood at 5.33 Million shares, which puts the short ratio at the time at 8.22. From this we can glean that short interest is 8.59% of company’s current outstanding shares. Notably, we see that shares short in May fell slightly given the previous month’s figure stood at 5.47 Million. But the -18.69% downside, the stock’s price has registered year-to-date as of last trading, will likely reignite investor interest given the prospect of it rallying higher ahead.
Article originally posted on mongodb google news. Visit mongodb google news
MMS • RSS
Posted on mongodb google news. Visit mongodb google news

Global Operational Database Management Systems (OPDBMS) Software Market 2021 report share informative data figures as well as important insights with COVID19 impact analysis regarding some of the market component which is considered to be future course architects for the market. This includes factors such as market size, market share, market segmentation, significant growth drivers, market competition, different aspects impacting economic cycles in the market, demand, expected business up-downs, changing customer sentiments, key companies operating in the Operational Database Management Systems (OPDBMS) Software Market, etc. In order to deliver a complete understanding of the global market, the report also shares some of the useful details regarding regional as well as significant domestic markets. The report presents a 360-degree overview and SWOT analysis of the competitive landscape of the industries.
Top Key players of Operational Database Management Systems (OPDBMS) Software Market Covered In The Report:
IBM
SQLite
MongoDB
Microsoft
RavenDB
MarkLogic
SAP
InterSystems
EnterpriseOB
Oracle
MariaDB
Amazon Web Services(AWS)
DataStax
ArangoDB
Google
Couchbase
Redis Labs
Key Market Segmentation of Operational Database Management Systems (OPDBMS) Software:
On the basis of types, the Operational Database Management Systems (OPDBMS) Software market from 2015 to 2025 is primarily split into:
Cloud-based
On-premises
On the basis of applications, the Operational Database Management Systems (OPDBMS) Software market from 2015 to 2025 covers:
Relational Database Management
Nonrelational Database Management
Operational Database Management Systems (OPDBMS) Software Market Region Mainly Focusing:
— Europe Operational Database Management Systems (OPDBMS) Software Market (Austria, France, Finland, Switzerland, Italy, Germany, Netherlands, Poland, Russia, Spain, Sweden, Turkey, UK),
— Asia-Pacific and Australia Operational Database Management Systems (OPDBMS) Software Market (China, South Korea, Thailand, India, Vietnam, Malaysia, Indonesia, and Japan),
— The Middle East and Africa Operational Database Management Systems (OPDBMS) Software Market (Saudi Arabia, South Africa, Egypt, Morocco, and Nigeria),
— Latin America/South America Operational Database Management Systems (OPDBMS) Software Market (Brazil and Argentina),
— North America Operational Database Management Systems (OPDBMS) Software Market (Canada, Mexico, and The USA)
(A free report data (as a form of Excel Datasheet) will also be provided upon request along with a new purchase.)
Factors such as industry value chain, key consumption trends, recent patterns of customer behaviors, overall spending capacity analysis, market expansion rate, etc. The report also incorporates premium quality data figures associated with financial figures of the industry including market size (in USD), expected market size growth (in percentage), sales data, revenue figures and more. This might enable readers to reach quicker decisions with data and insights at hand.
Key Highlights from Operational Database Management Systems (OPDBMS) Software Market Study:
Income and Sales Estimation –
Historical Revenue and deals volume is displayed and supports information is triangulated with best down and base up ways to deal with figure finish market measure and to estimate conjecture numbers for key areas shrouded in the Operational Database Management Systems (OPDBMS) Software report alongside arranged and very much perceived Types and end-utilize industry. Moreover, macroeconomic factors and administrative procedures are discovered explanation in Operational Database Management Systems (OPDBMS) Software industry advancement and perceptive examination.
Assembling Analysis –
The Operational Database Management Systems (OPDBMS) Software report is presently broken down concerning different types and applications. The Operational Database Management Systems (OPDBMS) Software market gives a section featuring the assembling procedure examination approved by means of essential data gathered through Industry specialists and Key authorities of profiled organizations.
Competition Analysis –
Operational Database Management Systems (OPDBMS) Software Leading players have been considered relying upon their organization profile, item portfolio, limit, item/benefit value, deals, and cost/benefit.
Demand and Supply and Effectiveness –
Operational Database Management Systems (OPDBMS) Software report moreover gives support, Production, Consumption and (Export and Import).
Major Points Covered in Table of Contents:
•Operational Database Management Systems (OPDBMS) Software Market Overview
•Global Operational Database Management Systems (OPDBMS) Software Market Competition by Manufacturers
•Global Operational Database Management Systems (OPDBMS) Software Production Market Share by Regions
•Global Operational Database Management Systems (OPDBMS) Software Consumption by Regions
•Global Operational Database Management Systems (OPDBMS) Software Production, Revenue, Price Trend by Type
•Global Operational Database Management Systems (OPDBMS) Software Market Analysis by Applications
•Company Profiles and Key Figures in Operational Database Management Systems (OPDBMS) Software Business
•Operational Database Management Systems (OPDBMS) Software Manufacturing Cost Analysis
•Marketing Channel, Distributors, and Customers
•Market Dynamics
•Global Operational Database Management Systems (OPDBMS) Software Market Forecast
•Research Findings and Conclusion
•Methodology and Data Source
In a word, the Operational Database Management Systems (OPDBMS) Software Market report provides major statistics on the state of the Operational Database Management Systems (OPDBMS) Software industry with a valuable source of guidance and direction for companies and individuals interested in the market. At the end, Operational Database Management Systems (OPDBMS) Software Market Report delivers a conclusion which includes Research Findings, Market Size Evaluation, Global Market Share, Consumer Needs along with Customer Preference Change, Data Source. These factors will raise the growth of the business overall.
Any query? Enquire Here For Discount Or Report Customization
Contact Us:
Web:www.qurateresearch.com
E-mail:[email protected]
Ph: US – +13393375221
Note: In order to provide more accurate market forecast, all our reports will be updated before delivery by considering the impact of COVID-19.
Elon Musk’s Mars desire can prove to be the diciest human mission ever
Jupiter’s Moon Europa might have a core hot enough fuelling seafloor volcano
JNew Dark Matter Map Uncovers Secret Bridges Between Galaxies
Article originally posted on mongodb google news. Visit mongodb google news
Nosql Database Market – Major Technology Giants in Buzz Again | DynamoDB, ObjectLabs …
MMS • RSS
Posted on nosqlgooglealerts. Visit nosqlgooglealerts
A new research study from JCMR with title Global Nosql Database Market Research Report 2029 provides an in-depth assessment of the Nosql Database including key market trends, upcoming technologies, industry drivers, challenges, regulatory policies & strategies. The research study provides forecasts for Nosql Database investments till 2029.
The report does include most recent post-pandemic market survey on Nosql Database Market.
Competition Analysis : DynamoDB, ObjectLabs Corporation, Skyll, MarkLogic, InfiniteGraph, Oracle, MapR Technologies, he Apache Software Foundation, Basho Technologies, Aerospike
Request Free PDF Sample Report @: jcmarketresearch.com/report-details/1114162/sample
Commonly Asked Questions:
- At what rate is the market projected to grow
The year-over-year growth for 2020 is estimated at XX% and the incremental growth of the market is anticipated to be $xxx million.
Get Up to 40 % Discount on Enterprise Copy & Customization Available for Following Regions & Country: North America, South & Central America, Middle East & Africa, Europe, Asia-Pacific
- Who are the top players in the market?
DynamoDB, ObjectLabs Corporation, Skyll, MarkLogic, InfiniteGraph, Oracle, MapR Technologies, he Apache Software Foundation, Basho Technologies, Aerospike
- What are the key market drivers and challenges?
The demand for strengthening ASW capabilities is one of the major factors driving the market.
- How big is the North America market?
The North America region will contribute XX% of the market share
Enquiry for segment [email protected] jcmarketresearch.com/report-details/1114162/enquiry
This customized report will also help clients keep up with new product launches in direct & indirect COVID-19 related markets, upcoming vaccines and pipeline analysis, and significant developments in vendor operations and government regulations
Geographical Analysis:
North America: United States, Canada, and Mexico.
South & Central America: Argentina, Chile, and Brazil.
Middle East & Africa: Saudi Arabia, UAE, Turkey, Egypt and South Africa.
Europe: UK, France, Italy, Germany, Spain, and Russia.
Asia-Pacific: India, China, Japan, South Korea, Indonesia, Singapore, and Australia.
Market Analysis by Types: [Type]
Market Analysis by Applications: [Application]
Some of the Points cover in Global Nosql Database Market Research Report is:
Chapter 1: Overview of Global Nosql Database Market (2013-2025)
Definition
Specifications
Classification
Applications
Regions
Chapter 2: Market Competition by Players/Suppliers 2013 and 2018
Manufacturing Cost Structure
Raw Material and Suppliers
Manufacturing Process
Industry Chain Structure
Chapter 3: Sales (Volume) and Revenue (Value) by Region (2013-2018)
Sales
Revenue and market share
Chapter 4, 5 and 6: Global Nosql Database Market by Type, Application & Players/Suppliers Profiles (2013-2018)
Market Share by Type & Application
Growth Rate by Type & Application
Drivers and Opportunities
Company Basic Information
Continue
Note: Please Share Your Budget on Call/Mail We will try to Reach your Requirement @ Phone: +1 (925) 478-7203 / Email: [email protected]
Find more research reports on Nosql Database Industry. By JC Market Research.
- Database Performance Monitoring System Industry Analysis, Market Size, Share, Trends, Growth and Forecast 2021 – 2029
- Database Replication Software Industry Analysis, Market Size, Share, Trends, Growth and Forecast 2021 – 2029
- Database Operation and Maintenance Management System Industry Analysis, Market Size, Share, Trends, Growth and Forecast 2021 – 2029
Thanks for reading this article; you can also get individual chapter wise section or region wise report version like North America, Europe or Asia.
About Author:
JCMR global research and market intelligence consulting organization is uniquely positioned to not only identify growth opportunities but to also empower and inspire you to create visionary growth strategies for futures, enabled by our extraordinary depth and breadth of thought leadership, research, tools, events and experience that assist you for making goals into a reality. Our understanding of the interplay between industry convergence, Mega Trends, technologies and market trends provides our clients with new business models and expansion opportunities. We are focused on identifying the Accurate Forecast in every industry we cover so our clients can reap the benefits of being early market entrants and can accomplish their Goals & Objectives.
Contact Us: https://jcmarketresearch.com/contact-us
JCMARKETRESEARCH
Mark Baxter (Head of Business Development)
Phone: +1 (925) 478-7203
Email: [email protected]
Connect with us at – LinkedIn
Document Databases Market SWOT Analysis including key players Couchbase, MongoDB, Amazon
MMS • RSS
Posted on mongodb google news. Visit mongodb google news
Los Angeles, United State, – including Q4 analysis The report named, Global Document Databases Market has been added to the archive of market research studies by JCMR. The industry experts and researchers have offered reliable and precise analysis of the Document Databases in view of numerous aspects such as growth factors, challenges, limitations, developments, trends, and growth opportunities. This report will surely act as a handy instrument for the market participants to develop effective strategies with an aim to reinforce their market positions. This report offers pin-point analysis of the changing dynamics and emerging trends in the Global Document Databases Market.
Get PDF template of Document Databases @jcmarketresearch.com/report-details/1114792/sample
Additionally, it provides a futuristic perspective on various factors that are likely to boost the Global Document Databases Market growth in the years to come. Besides, authors of the report have shed light on the factors that may hamper the growth of the Global Document Databases Market.
The report also helps in understanding the Global Document Databases Market through key segments including application, product type, and end user. This analysis is based on various parameters such as CGAR, share, size, production, and consumption.
The leading industry experts have also scrutinized the Global Document Databases Market from a geographical point of view, keeping in view the potential countries and their regions. Market participants can rely on the regional analysis provided by them to sustain revenues.
The report has also focused on the competitive landscape and the key strategies deployed by the market participants to strengthen their presence in the Global Document Databases Market. This helps the competitors in taking well-versed business decisions by having overall insights of the market scenario. Leading players operating in the Document Databases comprising , Couchbase, MongoDB, Amazon, MarkLogic, Aerospike, Neo Technology, Basho Technologies, DataStax, Oracle, MapR Technologies are also profiled in the report.
What the Report has to Offer?
- Document Databases Market Size Estimates: The report offers accurate and reliable estimation of the market size in terms of value and volume. Aspects such as production, distribution and supply chain, and revenue for the Document Databases are also highlighted in the report
- Document Databases Analysis on Market Trends: In this part, upcoming market trends and development have been scrutinized
- Document Databases Growth Opportunities: The report here provides clients with the detailed information on the lucrative opportunities in the Document Databases
- Document Databases Regional Analysis: In this section, the clients will find comprehensive analysis of the potential regions and countries in the global Document Databases
- Document Databases Analysis on the Key Market Segments: The report focuses on the segments: end user, application, and product type and the key factors fuelling their growth
- Document Databases Vendor Landscape: Competitive landscape provided in the report will help the companies to become better equipped to be able to make effective business decisions
Get Customized full Document Databases Report in your Inbox within 24 hours @ jcmarketresearch.com/report-details/1114792/enquiry
How can the research study help your business?
(1) The information presented in the Document Databases report helps your decision makers to become prudent and make the best business choices.
(2) The report enables you to see the future of the Document Databases and accordingly take decisions that will be in the best interest of your business.
(3) It offers you a forward-looking perspective of the Document Databases drivers and how you can secure significant market gains in the near future.
(4) It provides SWOT analysis of the Document Databases along with useful graphics and detailed statistics providing quick information about the market’s overall progress throughout the forecast period.
(5) It also assesses the changing competitive dynamics of the Document Databases using pin-point evaluation.
Get Special up to 40% Discount on full research report @ jcmarketresearch.com/report-details/1114792/discount
The report answers several questions about the Global Document Databases Market includes:
What will be the market size of Document Databases market in 2029?
What will be the Document Databases growth rate in 2029?
Which key factors drive the market?
Who are the key market players for Document Databases?
Which strategies are used by top players in the market?
What are the key market trends in Document Databases?
Which trends and challenges will influence the growth of market?
Which barriers do the Document Databases markets face?
What are the market opportunities for vendors and what are the threats faced by them?
What are the most important outcomes of the five forces analysis of the Document Databases market?
Buy Instant Full Copy Global Document Databases Report 2029 @ jcmarketresearch.com/checkout/1114792
Find more research reports on Document Databases Industry. By JC Market Research.
About Author:
JCMR global research and market intelligence consulting organization is uniquely positioned to not only identify growth opportunities but to also empower and inspire you to create visionary growth strategies for futures, enabled by our extraordinary depth and breadth of thought leadership, research, tools, events and experience that assist you for making goals into a reality. Our understanding of the interplay between industry convergence, Mega Trends, technologies and market trends provides our clients with new business models and expansion opportunities. We are focused on identifying the “Accurate Forecast” in every industry we cover so our clients can reap the benefits of being early market entrants and can accomplish their “Goals & Objectives”.
Contact Us: https://jcmarketresearch.com/contact-us
Mark Baxter (Head of Business Development)
Phone: +1 (925) 478-7203
Email: sales@jcmarketresearch.com
Connect with us at – LinkedIn
Article originally posted on mongodb google news. Visit mongodb google news
MMS • Nicholas Mitchell
Article originally posted on InfoQ. Visit InfoQ
Transcript
Mitchell: Welcome to this talk on scaling and optimizing the training of predictive models. My name is Nicholas Mitchell. I’m a machine learning engineer at Argo AI, working on the perception stack for autonomous vehicles. I’m also a researcher at the University of Augsburg in Germany. This presentation will cover some work that I completed earlier this year. There are a lot of moving parts, so we’ll stay quite high level.
Challenges in Modern ML
Let’s begin by having a brief look at the challenges of modern machine learning projects, especially those in industry. It’s common knowledge that data sets keep growing as we get better sensors and more sensors. This means compute and storage need to grow with any solution that we might come up with. The complexities around the models and the size of the complexity keeps growing, especially when we think that modern machine learning normally means deep learning. These are being improved year on year at drastic rates, so time to optimize these models, generally also increases as we have bigger models and more intricate models. There’s a cost tradeoff to be had when we keep in mind that we’re in industry. I think about the design decisions for scale, there’s a need for efficiency and for flexibility. We need things that are going to work for quite a long time. We need this flexibility to allow us to be faster if we need to be faster, or to maybe save money if we need to be a bit more frugal with our training resources. There are often production constraints. Maybe we need a model for a specific task and we have a specific budget in terms of time or in terms of compute, or in terms of money, so we need to keep that in mind.
Who Might Benefit?
Given these challenges, what do I talk about in this presentation and who might benefit? I assume you have a working model, so my model is training. I assume you have the problems, however, that you have large data sets that may continue growing and so you might want to think about how to distribute this training. What are some tools for that? You might want to also keep fine-tuning your model either on new data coming in, or you want to keep tweaking the model so you want to know how to tinker with hyperparameters of a model to squeeze the last drop of performance out of it. We also want to do it efficiently, so we need to think of a way that allows us to change our approach over time without reinventing the whole training pipeline.
The Star of the Show
We’re talking about machine learning. The star of the show here in this story is, of course, the predictive model itself. However, for the sake of this talk, let’s keep it generic when we think about the model. Let’s think about something that takes an input and returns an output, so really just any predictive model. A specific goal that you have when you’re also approaching one of these projects might mean changing some parts of the pipeline, and ways to optimize that model. Again, the model itself is not the focus of this talk, and we’ll maybe generalize to some common models later on.
The Supporting Characters
Let’s look at the supporting characters of the story. There are three of them. When we do modern machine learning the compute is a big aspect of it. This is the physical hardware, or rather, how to get access to it. The second part is then the orchestrator, so once we start thinking about a lot of data in a distributed setting, we need someone to hook everything together for us. That’s the orchestrator. Then we have the brains. This is going to be the optimizer which is going to be approaching the question of how to deal with all of these hyperparameters. For each of these, here are some of the tools that I’m going to refer to, the ones that I’ve worked with. I’ll explain compute and orchestrator at a high level. I assume a lot of software engineers are fairly familiar with these tools, or a variant of these tools. I’ll spend a little bit more time explaining the brains, this AutoML, and how the optimization could work for a machine learning model, distributed setting.
The Compute
The compute, this is perhaps the easiest decision. It might already be decided for you, but based on your company or based on your location, you might already be using AWS, Azure, or Google Cloud. One thing if you are at the very beginning, and you still have the chance to think about it, is the on-premise versus cloud discussion. If you are, for example, a small company, it might be worthwhile actually investing in a couple of good computers to have in your office, as opposed to using the cloud. There’s a reference at the end that will maybe help you decide if you’re still in the early stages. Beyond picking a provider, probably one of those in the top right, it’s also important to then look at the type of instances that they offer for their cloud computing, which hardware is available. What you need for your specific model. If you need a lot of CPU power to quickly churn through some lightweight models, or whether you need big, heavy GPUs for training one big monolithic neural network, for example.
The Orchestrators
The orchestrators, these two, Docker and Kubernetes, they together offer quite a lot. First looking at Docker, we can think of Docker as a way of managing our dependencies. Everything is configured in a file, and that can be checked into a Git repository. It can be shared so we can get some reproducibility and also easy collaboration, because we just send a Docker file to somebody and they can exactly repeat our experiment, given the source code. It also allows a fine-grained interface to the hardware. Through the Docker API, it’s possible to also constrain, for example, the number of CPU cores or the number of GPUs that are visible to a task. It’s quite key when you come to a distributed setting, and we might want to, for example, use several of the GPUs on one physical machine. We can make sure that each instance of a model that’s training only sees what it needs.
Kubernetes, one which Docker really sits, it’s a way to efficiently scale and manage different services. In our case, one service might be training our model one time. There’s a way to bring those all together, and allow automatic scaling, so more or less compute can be configured automatically through Kubernetes. It offers some fault tolerance, so if something goes wrong, it can restart it. It also allows us some way to introduce networking and allow our jobs to communicate with each other, and maybe only certain jobs need to speak to other certain services in your training pipeline. Kubernetes can manage all of that for you.
The Brains
The third character here, the brains. We can treat this as a black box. If we do so then it will be this sentence here. You would say, “I tried this configuration for my model and this was what the model did. That was the result. Please tell me, what should I do next?” The AutoML team in Freiburg, Hannover, the two universities in Germany, they have a range of optimization tools. The one I’m going to be talking about is based on these components, hyperband and Bayesian optimization. Hyperband is a way to efficiently try a lot of configurations. It’s like doing a random parameter search, but very systematically and less randomly breaking it down. We’ll go into that. The Bayesian optimization here, the definition straight from Wikipedia, so usually employed to optimize expensive to evaluate functions. What is more expensive than a modern ResNet-101 model? These come together, and the implementation is the BOHB – HyperBandster. This is essentially the combination of hyperband and Bayesian optimization. They’re important concepts.
Hyperband
Let’s look at the first concept, which is hyperband, and how that works, how we might use it. Let’s imagine we begin here with a graph. This is looking at our model when we’re training. On the y-axis here, we have an error metric, so this can be the loss of the model, for example. We can see on this axis that lower is then better, of course. On the x-axis, we have time, and the time here is how long the model is training for. This can be the wall time for example of a model. That’s generally equivalent to money because we’re paying for our compute by time, usually.
If we were to train naively, what we would generally do is a parameter grid search, for example, or a random search. What this might end up with is, we start training a model. We see, over time, we have a loss curve, which comes down and we end up here, so not quite enough target area. We try a lot of these random search fashion, and we have some of this. Maybe one converges quickly and ends up doing terribly. Maybe some just are terrible in the beginning. Perhaps there’s a lot, which just have this gray zone where models form bad convergence, or would need a lot of time, a lot more data. In the end, we found a fairly good solution here, not quite in our target area, but not bad. However, if we think about the total cost of doing this is equivalent to the length of all of these lines. Every line there is time spent training, time on compute. This is a lot of black ink here on the paper.
Let’s start the graph again, and this time let’s explain what hyperband does. Hyperband first looks at your time, and you would define a budget and how much time you’re going to allow. The hyperband would then proceed to break down the time into three rounds. We’re going to have round one, round two, and round three. This is all configurable. We would begin by training some models as was done before, maybe by random selection or parameter grid. We have some loss curves as before, terrible one. One that converged very quickly. One that was going quite well here. One quite slowly, and maybe we get, again, all of this noise here. What hyperband would then do is look at these and take the most promising only to continue into round two. There’s a culling of the weaker models. We would say this one is good, this one is good. Maybe let’s take the best three, the best lower proportion. Then, let’s just take a couple of random ones here and here, selected from this mass just because they might turn out well.
Then with these five, we continue. This one doesn’t do so well. This one continues. This one continues, maybe. This one goes down, comes the best. This one just pans out. We do the same again, here. We take maybe this one and this one, and then maybe randomly select one of these two. In the final step, we continue training down. We end up with here, one, which is in our target area. The target area is generic, but we’ve reached quite a good performance here. If we look back and think about the line lengths, if we were to add up the length of all these lines, it’s actually way less than in the previous case. We’ve reached here a better solution in this fictive example, but we’ve spent a lot less compute. That’s the main idea behind hyperband, so quicker convergence.
Bayesian Optimization
Let’s go back and just put that together with Bayesian optimization. This is the graph straight from the paper about this, BOHB. We can see here that from the orange lines, hyperband on its own has a very quick convergence of 20x speedup at the beginning compared to a random search. At the end, it doesn’t perform so well, however. The red line on the other hand, the Bayesian optimization is very slow to converge at the beginning, but reaches a really nice performance towards the end after training for a long time. The green line here is simply the combination of those two, so we’ve got the BOHB, getting the quick convergence of hyperband, and then Bayesian optimization coming in strong at the end to squeeze out the last performance points. We have a well-trained model here, and we’ve given a lead to a random search, we’ve got a 55 times speedup. That’s the optimizer. We’ll see now how that fits into the broader scheme here.
The Basic Loop
The basic training loop we see here for training a machine learning model, for example. In the middle, we start with the model. We’ve defined a model which needs an input and gives an output. There’s a configuration, which normally says how the model should be run, should be executed. It can hold things like learning rates for neural networks, or it can hold a number of trees in random forests. The other thing that the model needs access to is, of course, the data. Those two flow into the model, the model trains. There is some performance metric, how well is the model doing, and this loop continues. The model is then maybe tweaked, or it gets feedback, and it continues training until we’re happy. At the end, we have this gray line. At that point, that’s where we would probably take our model and go into production, and deploy it and get some real world feedback. Then this basic loop would continue making any tweaks you see fit.
The Better Loop
Bring in the tools that I spoke about earlier, we can augment this basic loop to the better loop. Here, the only additions are those towards the top. We have an optimizer in the picture now, and we can see, all of this is encompassed with Docker and Kubernetes. Then running, in this example, on AWS. In this case, the model, again, needs to receive a configuration and have access to the data. It’s the optimizer that’s controlling the configuration. The optimizer here, the BOHB sees a configuration defined, a configuration space. It will in the first round, select some configurations, a couple of those, and it wants the model to train on those configurations. Then the performance metrics will be fed back to the optimizer which can then say, “Based on these performance metrics I’m seeing, which configurations should I choose next to optimize? Which ones should I definitely avoid?” It’s a smarter way to search the configuration space.
Taking now Docker, Kubernetes, and scalability of compute into account, what we notice is the optimizer says, “I want to try these n configurations, maybe 5, maybe 20. Then I wait for the results of all of those to come back.” That’s a very parallelizable problem, really. What we can do here very easily with Kubernetes, is just say, I’m going to have five models. This could be five instances on AWS, each of which gets a configuration. It gets the Docker image to run a model with that configuration, and five results are then sent out and come back to the optimizer. This can continue. Now we’ve just basically cut the time required by five. The optimizer can optimize more quickly because it’s getting feedback more quickly. That’s the general overview of how these things fit together. It’s also a good benefit of this abstraction here. We have a Docker which can run a model. The model is something that is generic, so something that takes some configuration and returns some performance metric to be optimized. This model can really be anything. This setup here with the scalability, and this optimizer can basically optimize any model that can return an error metric. This doesn’t have to be just a neural network. It doesn’t even have to be just a machine learning problem. It could be anything. It could be the analytical solvers used for motion planning, for example, in robotics.
An Example Run
One example with some real numbers just to get a feel for it. I’ve trained one large model, for example, with 80 GPUs, which was 10, 8 GPU instances. I said to the optimizer that it can have three full training cycles. For example, if the model needed 100 epochs to train 100 times through the data, I said to the optimizer, you’re going to have 300 epochs budget and use them as you see fit. I had a 10 dimensional hyperparameter grid. That means 10 different parameters were being searched at the same time. This ran for a total of three days in this case with that compute. Another thing that you could think about here of reusing the schematic in the slide before, is if we were to just provide one configuration, so the optimizer really had nothing to do, we would still really be able to take advantage of the scalability. We could automatically scale up our training to just use 8 GPUs or 100 GPUs, depending on if we have priority to train our model quickly, or not. It’s another flexibility that is offered to the machine learning engineer in this case.
Open-source Software FTW
All of this was done with open-source software, which is amazing in my opinion. The main ones here are, I used Python for all of the scripting, and then Docker, Kubernetes, AutoML, all based on Ubuntu. I used PyCharm. All of that was free. I used TensorFlow here for some of the neural network components. Another tool to help multi-GPU training of models is Horovod. I recommend people look at that if they need multi-GPU training. For logging of all of these experiments, there’s the ML-Flow library, which could then log the progress for example of each of the configurations that were being trained, so I didn’t need to wait to the end to see results. I could see that in real-time while they were all training.
See more presentations with transcripts
MMS • RSS
Article originally posted on Data Science Central. Visit Data Science Central
- The Non-Fungible Token (NFT) craze is an environmental blitz.
- What’s behind the massive energy use.
- Solutions to the problem.
The high environmental toll of NFTs
A couple of weeks ago, I wrote an article outlining the Non-Fungible Token (NFT) process. For a brief moment, I considered turning some of my art into NFTs. That moment soon passed after I realized the staggering environmental toll behind buying and selling NFTs. While fads come and go with little impact (anyone remember Cabbage Patch dolls?), NFTs are unique in that they not only cause environmental harm when they are first bought and sold, but they continue to consume vast amounts of energy every time a piece is resold. In other words, while purchasing used goods, like clothing or housewares, has a fraction of the environmental impact of buying new, the same is not true of NFTs. Every time any NFT transaction takes place, whether it’s for a newly minted piece or for a resale, massive amounts of energy are required to fuel the transaction.
Why do NFT Transactions Consume So Much Energy?
The enormous environmental costs associated with NFTs is tied to the way the network they are built on is secured. Ethereum, the blockchain which holds the NFTs, uses a compute intensive Proof-of-work (PoW) protocol to prevent double spending, economic attacks, and other manipulations [1]. PoW was designed to be computationally inefficient: Basically, the more complexity involved in creating one, the higher the security [2].
The validation of ownership and transactions via PoW is based on search puzzles of hash functions– cryptographic algorithms that map any-size inputs of any size to a unique output of a fixed bit length. These challenging puzzles, which must be solved by networks, increase in complexity according to the price of cryptocurrency, how much power is available, and how many requests there are for new blocks [3]. As NFTs take off, demand surges and the entire systems struggles to keep up, fueling demand for more and more warehouses, more cooling, and more electricity consumption.
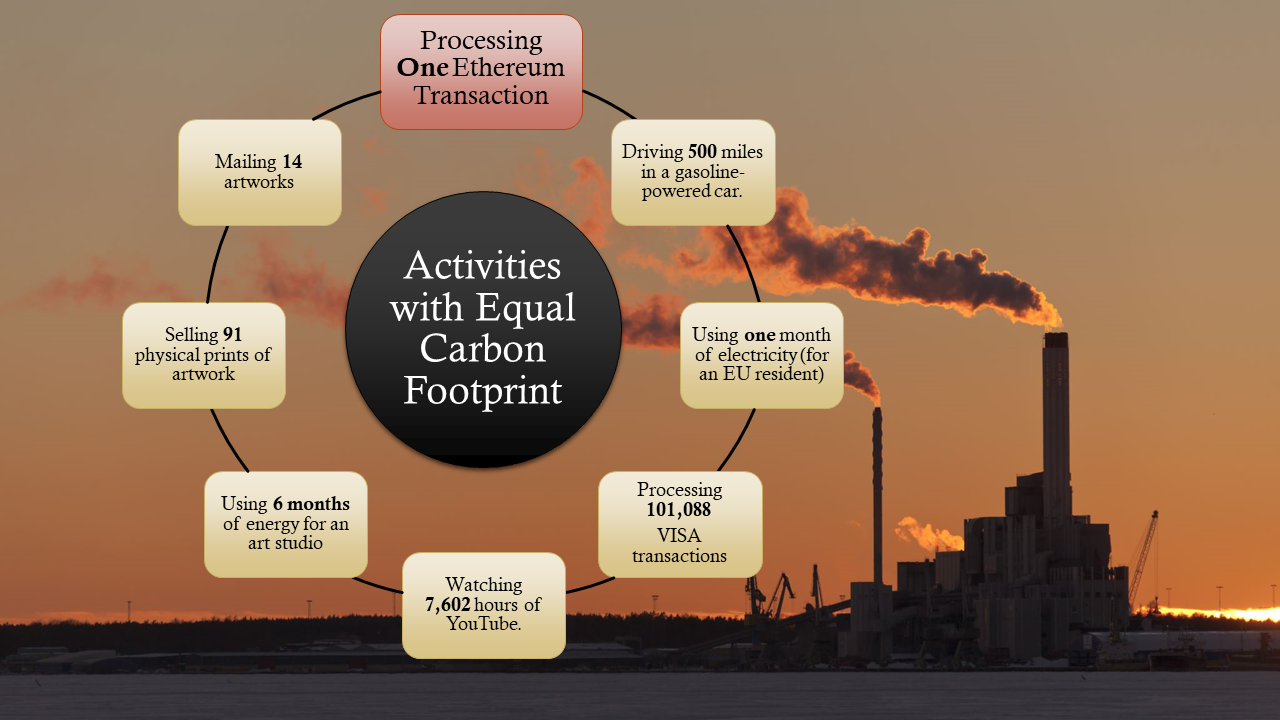
Many organizations and individuals have attempted to ballpark the exact carbon footprint of NFTs, and most of those paint the process in a poor light. A single NFT transaction has been estimated to have a carbon footprint equal to the energy required to:
- Keep the lights on for 6 months (or more) in an art studio [4].
- Produce 91 physical art prints [5]
- Mail 14 art prints [6],
- Process 101,088 VISA transactions [7],
- Watch 7,602 hours of YouTube [7],
- Drive 500 miles in a standard American gas-powered car [8].
Although it is challenging to ascertain the exact environmental cost of NFTs, much work has been reported on the more established Bitcoin, which runs on similar principles. For example, Elon Musk’s recent dabbling with PoW-based Bitcoin used so much energy in just a few days, that is negated the amount of carbon emissions reduced by every Tesla ever sold [9].
Digital artist Everest Pipkin, writing on the state of cryptoart in a blog post, states
“This kind of gleeful wastefulness is, and I am not being hyperbolic, a crime against humanity” [10].
What is the Solution?
Steps have been taken toward more energy efficiency. For example, Ethereum is attempting to move to a more energy efficient consensus mechanism called proof-of-stake (PoS). However, this is faltering out of the starting gate. A post on the Ethereum website states “…getting PoS right is a big technical challenge and not as straightforward as using PoW to reach consensus across the network.” [11] In other words, while we wait (potentially for years) for Ethereum to “get in right”, we’re busy polluting the atmosphere like it’s 1972.
Some digital artists have attempted to make their transaction carbon neutral by planting trees or creating sustainable farms, but their efforts have backfired. For example, artist John Gerrard recently created a “carbon-neural” NFT video piece called Western Flag [12]. The carbon-neutrality was a result of investment in a “a cryptofund for climate and soil”. However, Gerrard’s piece caused more buzz for NFTs, fueling more creations by more artists—most of whom did not even attempt to offset their transactions by planting trees [9]; Not that planting trees to alleviate emissions guilt works anyway. Critics have equated tree planting offset schemes as nothing more than a fig leaf [13].
“Robert” by Zac Freeman.

The real solution? Pass this fad by. Instead, support artists who create sustainable art, like assemblage artist Zac Freeman. Freeman, a resident artist at CoRK arts district in Jacksonville, Florida, creates art in the real-world from found objects: throwaway items like used Lego bricks, paper clips and plastic bottle tops.
“If I can get my art in front of 10,000 people and get them to think about disposable goods and cultural consumerism,” says Freeman, “I’ve achieved my goal.”
For the environmental cost of a single NFT transaction, you can get Zac (or any other artist) to ship you 14 prints. Or, for the price of one animated flying cat with a pop-tart body [14], you can commission Zac to create assemblage pieces of your entire extended family. I know which option I would choose.
References
Carbon Footrprint Image: By Author
“Robert” by Zac Freeman. Used with the artist’s permission. http://zacfreeman.com/
[2] The Unreasonable Cost of Cryptoart
[3] The Carbon Footprint of Bitcoin
[4] NFTs Are Hot. So Is Their Effect on the Earth’s Climate
[6] What Are NFTs, And What is Their Environmental Impact?
[7] Ethereum Energy Consumption
[8] NFT Climate Change.
[9] Non-fungible tokens aren’t a harmless digital fad – they’re a disaster for our planet
[10] Can fashion ever be sustainable?
[11] Ethereum Upgrades.
[12] Western Flag Spindletop Texas
[13] Tree-planting to offset carbon emissions: no cure-all
[14] Why an Animated Flying Cat With a Pop-Tart Body Sold for Almost $600,000
Trending: Database Management Systems (DBMS) Market Growth Analysis, Recent Trends and …
MMS • RSS
Posted on mongodb google news. Visit mongodb google news

LOS ANGELES, United States: QY Research offers an overarching research and analysis-based study on, “Global Database Management Systems (DBMS) Market Report, History and Forecast 2016-2027, Breakdown Data by Companies, Key Regions, Types and Application“. This report offers an insightful take on the drivers and restraints present in the market. Database Management Systems (DBMS) data reports also provide a 5 year pre-historic and forecast for the sector and include data on socio-economic data of global. Key stakeholders can consider statistics, tables & figures mentioned in this report for strategic planning which lead to success of the organization. It sheds light on strategic production, revenue, and consumption trends for players to improve sales and growth in the global Database Management Systems (DBMS) Market. Here, it focuses on the recent developments, sales, market value, production, gross margin, and other significant factors of the business of the major players operating in the global Database Management Systems (DBMS) Market. Players can use the accurate market facts and figures and statistical studies provided in the report to understand the current and future growth of the global Database Management Systems (DBMS) market.
This report includes assessment of various drivers, government policies, technological innovations, upcoming technologies, opportunities, market risks, restrains, market barriers, challenges, trends, competitive landscape, and segments which gives an exact picture of the growth of the global Database Management Systems (DBMS) market.
| Top Companies/Manufacturers: | BMC Software, Oracle, IBM, Broadcom, Couchbase Server, Enterprise DB Software Solution, Embarcadero Technologies, MongoDB, HP, InterSystems, MetaMatrix, Microsoft, Neo Technology, SAP, SAS Institute, Pitney Bowes, Bradmark Technologies, TIBCO, Vision Solutions, VoltDB |
| Market Segment by Product Type: | Database Application Builder Database Encryption Backup Recovery Data Scaling Replication |
| Market Segment by Application: | Banking & Financial Government Hospitality Healthcare and Life Sciences Education Media & Entertainment Professional Service Telecom & IT |
Get PDF Sample Copy of the Report Database Management Systems (DBMS) market
https://www.qyresearch.com/sample-form/form/3169991/global-database-management-systems-dbms-market
Do You Have Any Question Or Specific Requirement? Ask to Our Industry Expert:
Competitive Landscape
Competitor analysis is one of the best sections of the report that compares the progress of leading players based on crucial parameters, including market share, new developments, global reach, local competition, price, and production. From the nature of competition to future changes in the vendor landscape, the report provides in-depth analysis of the competition in the global Database Management Systems (DBMS) market.
Key questions answered in the report:
- What is the growth potential of the Database Management Systems (DBMS) market?
- Which product segment will grab a lion’s share?
- Which regional market will emerge as a frontrunner in the coming years?
- Which application segment will grow at a robust rate?
- What are the growth opportunities that may emerge in the Interactive Patient Engagement Systems industry in the years to come?
- What are the key challenges that the global Database Management Systems (DBMS) market may face in the future?
- Which are the leading companies in the global Database Management Systems (DBMS) market?
- Which are the key trends positively impacting the market growth?
- Which are the growth strategies considered by the players to sustain hold in the global Database Management Systems (DBMS) market
Table of Contents
1 Market Overview of Database Management Systems (DBMS)
1.1 Database Management Systems (DBMS) Market Overview
1.1.1 Database Management Systems (DBMS) Product Scope
1.1.2 Database Management Systems (DBMS) Market Status and Outlook
1.2 Global Database Management Systems (DBMS) Market Size Overview by Region 2016 VS 2021VS 2027
1.3 Global Database Management Systems (DBMS) Market Size by Region (2016-2027)
1.4 Global Database Management Systems (DBMS) Historic Market Size by Region (2016-2021)
1.5 Global Database Management Systems (DBMS) Market Size Forecast by Region (2022-2027)
1.6 Key Regions, Database Management Systems (DBMS) Market Size (2016-2027)
1.6.1 North America Database Management Systems (DBMS) Market Size (2016-2027)
1.6.2 Europe Database Management Systems (DBMS) Market Size (2016-2027)
1.6.3 Asia-Pacific Database Management Systems (DBMS) Market Size (2016-2027)
1.6.4 Latin America Database Management Systems (DBMS) Market Size (2016-2027)
1.6.5 Middle East & Africa Database Management Systems (DBMS) Market Size (2016-2027) 2 Database Management Systems (DBMS) Market Overview by Type
2.1 Global Database Management Systems (DBMS) Market Size by Type: 2016 VS 2021 VS 2027
2.2 Global Database Management Systems (DBMS) Historic Market Size by Type (2016-2021)
2.3 Global Database Management Systems (DBMS) Forecasted Market Size by Type (2022-2027)
2.4 Database Application Builder
2.5 Database Encryption
2.6 Backup
2.7 Recovery
2.8 Data Scaling
2.9 Replication 3 Database Management Systems (DBMS) Market Overview by Application
3.1 Global Database Management Systems (DBMS) Market Size by Application: 2016 VS 2021 VS 2027
3.2 Global Database Management Systems (DBMS) Historic Market Size by Application (2016-2021)
3.3 Global Database Management Systems (DBMS) Forecasted Market Size by Application (2022-2027)
3.4 Banking & Financial
3.5 Government
3.6 Hospitality
3.7 Healthcare and Life Sciences
3.8 Education
3.9 Media & Entertainment
3.10 Professional Service
3.11 Telecom & IT 4 Database Management Systems (DBMS) Competition Analysis by Players
4.1 Global Database Management Systems (DBMS) Market Size by Players (2016-2021)
4.2 Global Top Players by Company Type (Tier 1, Tier 2 and Tier 3) & (based on the Revenue in Database Management Systems (DBMS) as of 2020)
4.3 Date of Key Players Enter into Database Management Systems (DBMS) Market
4.4 Global Top Players Database Management Systems (DBMS) Headquarters and Area Served
4.5 Key Players Database Management Systems (DBMS) Product Solution and Service
4.6 Competitive Status
4.6.1 Database Management Systems (DBMS) Market Concentration Rate
4.6.2 Mergers & Acquisitions, Expansion Plans 5 Company (Top Players) Profiles and Key Data
5.1 BMC Software
5.1.1 BMC Software Profile
5.1.2 BMC Software Main Business
5.1.3 BMC Software Database Management Systems (DBMS) Products, Services and Solutions
5.1.4 BMC Software Database Management Systems (DBMS) Revenue (US$ Million) & (2016-2021)
5.1.5 BMC Software Recent Developments
5.2 Oracle
5.2.1 Oracle Profile
5.2.2 Oracle Main Business
5.2.3 Oracle Database Management Systems (DBMS) Products, Services and Solutions
5.2.4 Oracle Database Management Systems (DBMS) Revenue (US$ Million) & (2016-2021)
5.2.5 Oracle Recent Developments
5.3 IBM
5.3.1 IBM Profile
5.3.2 IBM Main Business
5.3.3 IBM Database Management Systems (DBMS) Products, Services and Solutions
5.3.4 IBM Database Management Systems (DBMS) Revenue (US$ Million) & (2016-2021)
5.3.5 Broadcom Recent Developments
5.4 Broadcom
5.4.1 Broadcom Profile
5.4.2 Broadcom Main Business
5.4.3 Broadcom Database Management Systems (DBMS) Products, Services and Solutions
5.4.4 Broadcom Database Management Systems (DBMS) Revenue (US$ Million) & (2016-2021)
5.4.5 Broadcom Recent Developments
5.5 Couchbase Server
5.5.1 Couchbase Server Profile
5.5.2 Couchbase Server Main Business
5.5.3 Couchbase Server Database Management Systems (DBMS) Products, Services and Solutions
5.5.4 Couchbase Server Database Management Systems (DBMS) Revenue (US$ Million) & (2016-2021)
5.5.5 Couchbase Server Recent Developments
5.6 Enterprise DB Software Solution
5.6.1 Enterprise DB Software Solution Profile
5.6.2 Enterprise DB Software Solution Main Business
5.6.3 Enterprise DB Software Solution Database Management Systems (DBMS) Products, Services and Solutions
5.6.4 Enterprise DB Software Solution Database Management Systems (DBMS) Revenue (US$ Million) & (2016-2021)
5.6.5 Enterprise DB Software Solution Recent Developments
5.7 Embarcadero Technologies
5.7.1 Embarcadero Technologies Profile
5.7.2 Embarcadero Technologies Main Business
5.7.3 Embarcadero Technologies Database Management Systems (DBMS) Products, Services and Solutions
5.7.4 Embarcadero Technologies Database Management Systems (DBMS) Revenue (US$ Million) & (2016-2021)
5.7.5 Embarcadero Technologies Recent Developments
5.8 MongoDB
5.8.1 MongoDB Profile
5.8.2 MongoDB Main Business
5.8.3 MongoDB Database Management Systems (DBMS) Products, Services and Solutions
5.8.4 MongoDB Database Management Systems (DBMS) Revenue (US$ Million) & (2016-2021)
5.8.5 MongoDB Recent Developments
5.9 HP
5.9.1 HP Profile
5.9.2 HP Main Business
5.9.3 HP Database Management Systems (DBMS) Products, Services and Solutions
5.9.4 HP Database Management Systems (DBMS) Revenue (US$ Million) & (2016-2021)
5.9.5 HP Recent Developments
5.10 InterSystems
5.10.1 InterSystems Profile
5.10.2 InterSystems Main Business
5.10.3 InterSystems Database Management Systems (DBMS) Products, Services and Solutions
5.10.4 InterSystems Database Management Systems (DBMS) Revenue (US$ Million) & (2016-2021)
5.10.5 InterSystems Recent Developments
5.11 MetaMatrix
5.11.1 MetaMatrix Profile
5.11.2 MetaMatrix Main Business
5.11.3 MetaMatrix Database Management Systems (DBMS) Products, Services and Solutions
5.11.4 MetaMatrix Database Management Systems (DBMS) Revenue (US$ Million) & (2016-2021)
5.11.5 MetaMatrix Recent Developments
5.12 Microsoft
5.12.1 Microsoft Profile
5.12.2 Microsoft Main Business
5.12.3 Microsoft Database Management Systems (DBMS) Products, Services and Solutions
5.12.4 Microsoft Database Management Systems (DBMS) Revenue (US$ Million) & (2016-2021)
5.12.5 Microsoft Recent Developments
5.13 Neo Technology
5.13.1 Neo Technology Profile
5.13.2 Neo Technology Main Business
5.13.3 Neo Technology Database Management Systems (DBMS) Products, Services and Solutions
5.13.4 Neo Technology Database Management Systems (DBMS) Revenue (US$ Million) & (2016-2021)
5.13.5 Neo Technology Recent Developments
5.14 SAP
5.14.1 SAP Profile
5.14.2 SAP Main Business
5.14.3 SAP Database Management Systems (DBMS) Products, Services and Solutions
5.14.4 SAP Database Management Systems (DBMS) Revenue (US$ Million) & (2016-2021)
5.14.5 SAP Recent Developments
5.15 SAS Institute
5.15.1 SAS Institute Profile
5.15.2 SAS Institute Main Business
5.15.3 SAS Institute Database Management Systems (DBMS) Products, Services and Solutions
5.15.4 SAS Institute Database Management Systems (DBMS) Revenue (US$ Million) & (2016-2021)
5.15.5 SAS Institute Recent Developments
5.16 Pitney Bowes
5.16.1 Pitney Bowes Profile
5.16.2 Pitney Bowes Main Business
5.16.3 Pitney Bowes Database Management Systems (DBMS) Products, Services and Solutions
5.16.4 Pitney Bowes Database Management Systems (DBMS) Revenue (US$ Million) & (2016-2021)
5.16.5 Pitney Bowes Recent Developments
5.17 Bradmark Technologies
5.17.1 Bradmark Technologies Profile
5.17.2 Bradmark Technologies Main Business
5.17.3 Bradmark Technologies Database Management Systems (DBMS) Products, Services and Solutions
5.17.4 Bradmark Technologies Database Management Systems (DBMS) Revenue (US$ Million) & (2016-2021)
5.17.5 Bradmark Technologies Recent Developments
5.18 TIBCO
5.18.1 TIBCO Profile
5.18.2 TIBCO Main Business
5.18.3 TIBCO Database Management Systems (DBMS) Products, Services and Solutions
5.18.4 TIBCO Database Management Systems (DBMS) Revenue (US$ Million) & (2016-2021)
5.18.5 TIBCO Recent Developments
5.19 Vision Solutions
5.19.1 Vision Solutions Profile
5.19.2 Vision Solutions Main Business
5.19.3 Vision Solutions Database Management Systems (DBMS) Products, Services and Solutions
5.19.4 Vision Solutions Database Management Systems (DBMS) Revenue (US$ Million) & (2016-2021)
5.19.5 Vision Solutions Recent Developments
5.20 VoltDB
5.20.1 VoltDB Profile
5.20.2 VoltDB Main Business
5.20.3 VoltDB Database Management Systems (DBMS) Products, Services and Solutions
5.20.4 VoltDB Database Management Systems (DBMS) Revenue (US$ Million) & (2016-2021)
5.20.5 VoltDB Recent Developments 6 North America
6.1 North America Database Management Systems (DBMS) Market Size by Country (2016-2027)
6.2 United States
6.3 Canada 7 Europe
7.1 Europe Database Management Systems (DBMS) Market Size by Country (2016-2027)
7.2 Germany
7.3 France
7.4 U.K.
7.5 Italy
7.6 Russia
7.7 Nordic
7.8 Rest of Europe 8 Asia-Pacific
8.1 Asia-Pacific Database Management Systems (DBMS) Market Size by Region (2016-2027)
8.2 China
8.3 Japan
8.4 South Korea
8.5 Southeast Asia
8.6 India
8.7 Australia
8.8 Rest of Asia-Pacific 9 Latin America
9.1 Latin America Database Management Systems (DBMS) Market Size by Country (2016-2027)
9.2 Mexico
9.3 Brazil
9.4 Rest of Latin America 10 Middle East & Africa
10.1 Middle East & Africa Database Management Systems (DBMS) Market Size by Country (2016-2027)
10.2 Turkey
10.3 Saudi Arabia
10.4 UAE
10.5 Rest of Middle East & Africa 11 Database Management Systems (DBMS) Market Dynamics
11.1 Database Management Systems (DBMS) Industry Trends
11.2 Database Management Systems (DBMS) Market Drivers
11.3 Database Management Systems (DBMS) Market Challenges
11.4 Database Management Systems (DBMS) Market Restraints 12 Research Finding /Conclusion 13 Methodology and Data Source
13.1 Methodology/Research Approach
13.1.1 Research Programs/Design
13.1.2 Market Size Estimation
13.1.3 Market Breakdown and Data Triangulation
13.2 Data Source
13.2.1 Secondary Sources
13.2.2 Primary Sources
13.3 Disclaimer
13.4 Author List
About Us:
QYResearch always pursuits high product quality with the belief that quality is the soul of business. Through years of effort and supports from huge number of customer supports, QYResearch consulting group has accumulated creative design methods on many high-quality markets investigation and research team with rich experience. Today, QYResearch has become the brand of quality assurance in consulting industry.
Article originally posted on mongodb google news. Visit mongodb google news
Global NoSQL Databases on Enterprise Storage Market Outlook 2021, Pricing Strategy, Industry …
MMS • RSS
Posted on nosqlgooglealerts. Visit nosqlgooglealerts

Research N Reports Market Research has recently published a research study on Market NoSQL Databases on Enterprise Storage Market. The Global NoSQL Databases on Enterprise Storage Market Report, Trends, Size, Share, Analysis, Estimations and Forecasts to 2028. To calculate the market size, the report considers revenue generated from the sales of products under the scope of the report. The report also considers the revenues to be generated from the sales of the product, which is expected to be launched into the market during the forecast period. This well-drafted report involves the current market status, historical data, and prediction outlook.
FREE : Request Sample is Available @ https://www.researchnreports.com/request_sample.php?id=223623 #utm_source=Aniket&utm_medium=May2021
The report is based on the synthesis, analysis, and interpretation of information about the global Market NoSQL Databases on Enterprise Storage Market collected from specialized sources. The research analyst has derived insights using a mix of primary and secondary research with an aim to provide a holistic picture of the market. The primary research is based on vendor briefings, telephone, and online surveys, along with interviews with industry experts and centers of influence. Whereas, secondary research focused on studying company reports & publications, webinars & podcasts, industry journals & publications, proprietary tools & databases.
The report on the global Market NoSQL Databases on Enterprise Storage Market categorizes the breakdown of global data by major players, regional analysis, and segmentation. It also investigates the market status, growth rate, market share, and future trends.
Global Market NoSQL Databases on Enterprise Storage Market: Regional Analysis
- North America ( United States)
- Europe ( Germany, France, UK)
- Asia-Pacific ( China, Japan, India)
- Latin America ( Brazil)
- The Middle East & Africa
Inquire or share your questions if any before purchasing this report @ https://www.researchnreports.com/enquiry_before_buying.php?id=223623#utm_source=Aniket&utm_medium=May2021
The report also presents the vendors/manufacturers landscape and a corresponding detailed analysis of the top vendors/manufacturers operating in the global Market NoSQL Databases on Enterprise Storage Market. The top vendors/manufacturers included in the report are the companies that generate maximum revenues in the global market. In addition, it discusses the major drivers influencing the market growth and the challenges faced by the market players and the market as a whole. It also examines key emerging trends and their influence on current and future market scenarios. Most importantly, the report offers valuable insights on the future trends within the market across the different stages of the overall market.
A detailed study of the global economic conditions and other economic indicators is conducted to assess their impact on the current market conditions and to make informed predictions about future market scenarios. The report also covers a detailed analysis on current COVID-19 pandemic conditions and its future impacts on the growth of overall market.
Detailed segmentation of the market offered in this report provides key information on the subjects that combinedly contribute to the revenue of the market, the report enlightens current trends and future prospect based on individual segmentation to deliver meaning insights that helps to take better business decisions.
The study objectives of this report are:
- To study and analyze the global NoSQL Databases on Enterprise Storage size (value and volume) by the company, key regions/countries, products and application, history data from 2020 to 2028, and forecast to 2028.
- To understand the structure of NoSQL Databases on Enterprise Storage by identifying its various sub-segments.
- To share detailed information about the key factors influencing the growth of the market (growth potential, opportunities, drivers, industry-specific challenges and risks).
- Focuses on the key global NoSQL Databases on Enterprise Storage manufacturers, to define, describe and analyze the sales volume, value, market share, market competition landscape, SWOT analysis, and development plans in the next few years.
- To analyze the NoSQL Databases on Enterprise Storage with respect to individual growth trends, future prospects, and their contribution to the total market.
- To project the value and volume of NoSQL Databases on Enterprise Storage submarkets, with respect to key regions (along with their respective key countries).
- To analyze competitive developments such as expansions, agreements, new product launches, and acquisitions in the market.
- To strategically profile the key players and comprehensively analyze their growth strategies
Exclusive Offer: Ask for Discount on this Premium Report https://www.researchnreports.com/ask_for_discount.php?id=223623#utm_source=Aniket&utm_medium=May2021
Frequently Asked Questions
- What are the key factors driving Market NoSQL Databases on Enterprise Storage Market expansion?
- What will be the value of Market NoSQL Databases on Enterprise Storage Market during 2021- 2028?
- Which region will make notable contributions towards global Market NoSQL Databases on Enterprise Storage Market revenue?
- What are the key players leveraging Market NoSQL Databases on Enterprise Storage Market growth?
Also, Research Report Examines:
- Competitive companies and manufacturers in global market
- By Product Type, Applications & Growth Factors
- Industry Status and Outlook for Major Applications / End Users / Usage Area
Thanks for reading this article; you can also get individual chapter-wise sections or region-wise report versions like North America, Europe, or Asia.
About Us:
Research N Reports is a new age market research firm where we focus on providing information that can be effectively applied. Today being a consumer-driven market, companies require information to deal with the complex and dynamic world of choices, where relying on a soundboard firm for your decisions becomes crucial. Research N Reports specializes in industry analysis, market forecasts and as a result getting quality reports covering all verticals, whether be it gaining perspective on current market conditions or being ahead in the cutthroat global competition. Since we excel at business research to help businesses grow, we also offer to consult as an extended arm to our services which only helps us gain more insight into current trends and problems. Consequently, we keep evolving as an all-rounder provider of viable information under one roof.
Contact Us:
Sunny Denis
(Sales Manager),
Research N Reports
10916, Gold Point Dr,
Houston, TX, 77064,
+1-510-420-1213,
MMS • RSS
Article originally posted on Data Science Central. Visit Data Science Central

Bothe MEAN and MERN are full stack frameworks with Java coded components. The difference is that MEAN uses Angular JS while MERN uses the React JS developed by Facebook. Both aids developers to make reactive and intuitive UI. To understand which stack is the better one, we need to understand the underlying differences between them.
DIFFERENCES BETWEEN MEAN AND MERN
- MEAN: Components include Mongo DB, Angular JS, Express, and Node.
MERN: Components include Mongo DB, React JS, Express, and Node. - MEAN: JavaScript development stack.
MERN: Open source JavaScript library. - MEAN: Uses Typescript language.
MERN: Uses JavaScript and JSX. - MEAN: Copnent based architecture.
MERN: None. - MEAN: Regular DOM.
MERN: Virtual DOM. - MEAN: Steep learning curve.
MERN: Better documentation. - MEAN: Bidirectional data flow.
MERN: Unidirectional dataflow.
Both tech has high class features and immense functionality. The slight upper hand that MERN enjoys is in the learning curve. MERN is easier to grasp because the learning curve differs between Angular JS and React JS. Let us take a deeper dive into the benefits of MEAN and MERN stacks to understand the power of each of these stacks fully.
BENEFITS OF MEAN AND MERN
MEAN STACK
- All types of applications can be developed easily.
- Various plug ins and widgets have compatibility with this stack. For development that has a stricter time frame, this comes in handy.
- The functionality skyrockets due to the availability of plug ins.
- Developers enjoy community support since the framework is open source.
- Real time testing is possible with the built-in tools.
- A single language is used for back end and front end. This increases coordination and gets applications to respond faster.
MERN STACK
- Front end and back end are covered by a single coding script.
- The entire process can be completed using only JAVA and JSON.
- Seamless development through the MVC architecture.
- Real time testing through built-in tools.
- Runs on an open source community and the source code can be easily modified.
According to Hacker Rank development skill report, 30% of developers went with Angular JS while 26% stayed with React JS. The report also mentions that 30% of the programmers wanted to learn React JS and 35.9% of developers prefer to develop using React JS, thus MERN stands slightly above MEAN when it comes to popularity.
As far as we know, in terms of ease of understanding and popularity, MERN is at the forefront now. Let us take a detailed comparison to understand who will win the race in 2021.
MEAN vs MERN : A DETAILED COMPARISON
Scalability, Security: Both MEAN and MERN are equally secure. However, in terms of scalability, MERN is at the forefront.
- MVC: For enterprise level apps, a complete architecture needs to be maintained. MEAN is the better option for this.
- UI: For an advanced and simple UI, MERN is the go-to stack. MERN facilitates user interaction.
- CRUD: For CRUD (create, read, update, delete), MERN is the ideal stack. The React JS handles data changes quickly and has a good user interface as well.
- Support: The Angular JS in MEAN supports HTTP calls and unites the back-end. Enterprise level app development will require third party.
- libraries. On the other hand, React JS improves functionality through its supplementary libraries. MEAN scores slightly above in this section.
MEAN enhances the experience through the use of third party extensions while MERN would require additional configurations to do this.
In aspects of the learning curve, UI, scalability, and CRUD, MERN stack scores more than MEAN stack. However, in the aspects of community support and MVC MEAN stays ahead. In terms of security both are at par. However, the application of the stacks depend entirely on the business needs.
MEAN is more affordable, and is the first choice for startups and SMEs. Switching between clients and servers is easier. For real time web apps, MEAN is definitely the best choice. In MERN, the Virtual DOM enhances user experience and gets the developer’s work done faster. A stable code is maintained by React JS due to a unidirectional data flow. For coding for Android and IOS using JavaScript, MERN is definitely the way to go.
TAKE AWAY
Companies like Accenture, Raindrop, Vungle, Fiverr, UNIQLQ, and Sisense among others use MEAN in their tech stacks. Brands such as UberEats, Instagram, and Walmart use MERN stack. Both the stacks provide an incredible user experience. Stability and scalability can be achieved with both stacks.
From this we can conclude that enterprise level projects require MEAN over MERN. MERN makes rendering UI simpler. Both are reliable for a quick front end development.
MEAN is good for large scale application. MERN is good for faster development of smaller applications.
At Orion we have an excellent team that can help you with all your MEAN and MERN stack development needs.