Month: July 2018

MMS • RSS
Article originally posted on Data Science Central. Visit Data Science Central
Summary: Now that we’ve detailed the four main AI-first strategies: Data Dominance, Vertical, Horizontal, and Systems of Intelligence, it’s time to pick. Here we provide side-by-side comparison and our opinion on the winner(s) for your own AI-first startup.
 In our last several articles we’ve taken a tour of the four major strategies for creating a successful AI-first company. So which one is best?
Since we’re going to offer a side-by-side comparison you may want to refer first to the foundation articles on the four strategies:
Horizontal versus Vertical, and
Here’s How They Stack Up

Proprietary Data
There is wide agreement that controlling a unique data set is the most effective way to create a defensible moat. The exception is the Horizontal strategy which investors regard as fully exploited, that is the leaders have created dominant positions and are unlikely to be unseated. Since the IP in ML/AI cannot reasonably be protected, control and dominance of the data is the remaining strong play.
Systems of Intelligence companies are less defensible on this dimension. Since they don’t own the System of Record or the Systems of Engagement, they must rely on network effect of many users and a superior UI to attract and retain customers. It also suggests that existing SOR or SOE dominant vendors may move in as direct competitors either by acquisition or as soon as the market is shown to be viable.
Finding any sort of external data that can be claimed as proprietary and blended with the SOR data and manipulated with the ML/AI layer would seem to be the only protection.
Subject Matter Expertise / Narrow Industry Focus
This element leads back to finding a true hair-on-fire problem to be solved. Today these are all industry specific. This may in fact be the most difficult part for founders to identify. Bringing in industry respected leaders and SMEs early to the team not only brings focus and strength to the solution but will also create trust when it’s time to go to market.
In the Systems of Intelligence strategy the focus is on processes across industries so the SME component will focus on the process desired. It’s likely that SOI-based companies will also want to narrow their industry focus to just a few similar industries to make implementation configuration less complex blending with the Vertical strategy.
AI Must Deliver the Core Value
In the Vertical strategy, the lead advocate Bradford Cross, himself a VC is trying to build an investment thesis for selecting among AI-first startups. His position is that only AI can or must deliver really break through differentiation in the solution offered.
Cross also proposes that traditional ML, especially MLaaS tools don’t offer sufficient differentiation or only incremental improvement in the solution.
However, when we look at the example companies from the Data Dominance strategy (Blue River, Axon, and Stitch Fix), as well as those implementing the Systems of Intelligence strategy, it looks like a great deal can be accomplished with a mix of traditional ML and some AI.
Our take is that founders should try to envision AI-first strategies where they can offer true break through solutions, but not throw out the contribution of traditional and much easier ML.
There is even an argument that in developing a Minimum Viable Data Product that it’s easier to create earlier generations of the product with ML until the users help you focus in on what’s important. Speed is more important than complexity or even full functionality early in the MVP process.
Full Stack Products
The Data Dominance and Vertical strategies both suggest that a full stack solution is desirable or even a requirement. If there’s an issue here it’s in how to interpret full stack.
Bradford Cross of the Vertical strategy makes a major issue of this taking the position that the complete solution and complexity of a true full stack solution creates its own additional moat.
Our observation is that while fully solving the customer’s problem is important, it’s possible to get carried away with what full stack means. See our example of the full stack predictive maintenance solution in the Vertical/Horizontal review as an object lesson in not getting carried away. The full stack suggested there by BCG would require building an app equivalent to an SAP or PeopleSoft ERP. That might be a good goal, but you can probably wow your customer with something more limited and achievable.
So Which is Best?
If we were awarding points we’d have to say that the Data Dominance and Vertical strategies are in the lead. The best evidence of this is where VCs are putting their investments and that clearly is in these two similar but slightly different buckets. The question is still open as to whether any of these AI-first companies can grow to IPO scale.
Of the example companies we held out, Axon was already public before introducing an AI product. This is more of the data-side-car strategy from the old Horizontal days, but their treatment of AI with the Data Dominance strategy may be their ticket to growth.
Blue River Technology was recently acquired by John Deere. This was no acquihire and the tail may wag the dog. It may be that Blue River will show the traditional equipment manufacturer how to survive and thrive into the future.
That leaves Stitch Fix which is still growing nicely. Too early to say if they’ll make it to IPO. Or will Amazon scoop them up? Their positioning using data dominance remains unique and very different from Amazon’s usual way of selling fashion.
Other articles on AI Strategy
Comparing AI Strategies – Systems of Intelligence
Comparing AI Strategies – Vertical versus Horizontal.
What Makes a Successful AI Company
AI Strategies – Incremental and Fundamental Improvements
Other articles by Bill Vorhies.
About the author: Bill Vorhies is President & Chief Data Scientist at Data-Magnum and has practiced as a data scientist since 2001. Bill is also Editorial Director for Data Science Central. He can be reached at:
MMS • RSS
Posted on nosqlgooglealerts. Visit nosqlgooglealerts

For most admins, data normalization is a key concept that comes to mind when they think of a relational database….
But for users of Amazon DynamoDB — which follows a NoSQL, nonrelational database model — normalization could also play a role.
In a relational database, normalization helps ensure data integrity, as it involves structuring data in such a way that it’s not stored multiple times. To achieve this, admins store data in different tables and connect those tables via relationships.
Data normalization and DynamoDB
While the normalization process is largely associated with relational databases, there are exceptions. For example, there is a type of NoSQL database — called a wide-column store — that uses tables, rows and columns. To store unstructured data, the formats and names of the columns in these types of NoSQL databases can vary on the row level. In essence, a wide-column store NoSQL database — including Amazon DynamoDB — is a dimensional key-value store.
So, when would data normalization make sense with Amazon DynamoDB? Here are three examples.
1. To store large items
The maximum item size in Amazon DynamoDB is 400 KB. To store items larger than this, admins can either use an S3 bucket or a separate, normalized DynamoDB table. If they use the DynamoDB table, they can break the larger items into smaller chunks and then organize relationships between those chunks to re-create the item in an application.
2. Frequent data updates
Admins provision DynamoDB tables with capacity units for read and write operations. A capacity unit is defined as one operation — read or write — per second for an item up to 1 KB in size. If an organization constantly updates data, it will quickly consume the provisioned write units and will need to upgrade the limits — which isn’t cheap — to avoid performance issues.
In some situations, an application might be slow and totally unreachable. If this is the case, update normalized data — the smaller, necessary fields — rather than unstructured data, as Amazon DynamoDB calculates updates based on the entire item, not the portion of that item that needs updates.
3. Expected application behavior
If admins can organize their application data into separate tables for frequently accessed versus not frequently accessed, they can apply data normalization to them and save money with different read and write capacity unit configurations. This isn’t easy in most modern web and mobile applications, but admins can monitor how an application uses Amazon DynamoDB to help optimize performance and cut costs.
Of course, planning is key to any good database design, so an organization should review official AWS documentation on relational modeling in Amazon DynamoDB before it makes any unnecessary changes to a table’s layout.
MMS • RSS
Article originally posted on Data Science Central. Visit Data Science Central
Social media has exploded. And it is rapidly becoming the choice of marketers who want to gain a large audience, spread their brands and develop relationships that will result in trust and ultimately sales.
But competition is fierce, and marketers who must craft content are finding it increasingly difficult to cover all of the social media platforms they want to. One of the solutions is to use AI-powered tools to save manpower and to improve efficiency.
Use of AI Tools on Social Media
The AI tools available now allow marketers to generate more content faster; bots can analyze the performance of content; AI tools find and sort data on customer profiles by mining information of users; AI tools are also used to monitor all comments of users/consumers; and marketers even use AI to collect data on influencers and match the right influencers to their brands.
One Key AI Use – Translation
There are more than two billion users of Facebook, and the majority are not English-speaking. And as businesses and their marketers are increasing their attempts to reach a global audience, the need for translation of social media posts is real.
In the past, Facebook has used a machine translation program, which was less than ideal, for certain.
Now, Facebook has developed an improved translation service, powered by neural networks, a type of AI. It is called “convolution neural network (CNN).”
While in the past, the Facebook translation program performed translation, word by word, this new AI-based translation focuses on phrases and, over time, phrases and phrases within context of the content.
According to Facebook, its new translations are more accurate than previous machine translations. As well, the AI machines continue to “teach” themselves to interpret large language data sets, in order to understand natural language, including idioms and slang. So far, accuracy has increased by about 20% over earlier machine translations.
The Beauty of Facebook’s New AI Translation Feature
Here’s the thing. There are two key features that users will love:
- They will have the option to automatically translate anything into an array of languages. If something is posted in English, and someone in France has their preferred language listed as French, any post will automatically be translated into French. Think of the benefit to marketers when they can simply post something in English and not worry about a translation into the languages of consumers they are targeting globally.
- Users in foreign countries will have the option to “fix” translation errors. This is huge. Recipients of translated posts have the option to go in and correct translation errors; they are thus allowing the machines to learn more and use those corrections in any future translations they do. Over time, user involvement in this process will mean that marketers get their messages across without laborious manual translations.
Where Does This Leave the Competition
Facebook has obviously set the bar AI translation. While its function is not by any means perfect, it is a massive improvement over previous translation activity. And, as its machines continue to get better at natural language processing, translations will become more accurate.
Until then, of course, marketers will continue to use the most reputable and largest translation companies to localize their messages for foreign audiences. But, as the Bob Dylan song says, “The Times, They are a’Changin.’”
There is certainly the incentive for other social media platforms to develop their own AI translation functions too. Google is also moving forward on AI translation. Social media platforms like Instagram, Twitter, and others will have to get on board as well, if they want to remain competitive and continue to capture a large share of the reading and viewing market.
Marketers will gravitate toward those channels that offer accurate AI translations, as they strive to reach global markets. The savings in time and money are just too attractive. And the opportunities to connect with a global audience for marketing purposes is just too critical.
The Future is Now
AI is disrupting almost every sector of the economy. Social media should be no different. AI is already providing marketers with a wealth of data they can use to reach their audiences on social media platforms. Translation through AI technology is a logical outcome, as marketers are continually finding ways to streamline and spread their brand messages to a wider audience. There will soon come a day when accurate and contextually correct translations are available on all social media platforms – automatically, with no need for additional work on the part of brand marketers.
MMS • RSS
Article originally posted on InfoQ. Visit InfoQ
New York City has created an Automated Decision Systems Task Force to demand accountability and transparency in how algorithms are used in city government. The final report of the task force is due in December 2019. This task force is the first in the United States to study this issue.
Background
In December 2017, the New York City Council passed the country’s first bill to demand accountability in how algorithms are used in city government. That bill mandated that a task force study how city agencies use algorithms. This task force will report on how to make these algorithms understandable to the public.
The original proposal by Council Member James Vacca, mandated that the source code for the algorithms be made public. Some policy experts warned that openness might create security risks, or provide a way for people to game the public benefits system. Technology companies argued that they might be required to disclose proprietary information. The disclosure requirement was dropped in favor of the task force.
What the Law States
An automated decision system is defined as “a computerized implementations of algorithms, including those derived from machine learning or other data processing or artificial intelligence techniques, which are used to make or assist in making decisions.”
The law requires the task force to accomplish at least 6 goals in their final report. They need to identify which city agencies should be subject to review. They need to recommend procedures so that people affected by an algorithmic decision can request an explanation upon what the decision was based, as well as how adverse impacts can be addressed. They also should explain the development and implementation of a procedure in which the city may determine if an automated decision system used by a city agency “disproportionately impacts persons based upon age, race, creed, color, religion, national origin, gender, disability, marital status, partnership status, caregiver status, sexual orientation, alienage or citizenship status”. Recommendations for processes for making information available for automated decision systems will allow the public to meaningfully assess how they work, and are used by the city, as well as the feasibility of archiving automated decisions and the data used.
The members of this task force are not limited to experts in algorithmic design and implementation, but can include people who understand the impact of algorithms on society. Meeting participants can be limited if it “would violate local, state or federal law, interfere with a law enforcement investigation or operations, compromise public health or safety, or result in the disclosure of proprietary information.”
While the final report should be publicly available, no recommendation is required if it “would violate local, state, or federal law, interfere with a law enforcement investigation or operations, compromise public health or safety, or would result in the disclosure of proprietary information.”
This task force has no legal authority to force, or penalize city agencies that do not comply with their recommendations.
Background to the Controversy
The investigation of bias and infringement on rights in algorithmic decision making is only beginning.
Predictive policing programs in Chicago and New Orleans are being scrutinized for violations of due process and privacy. The public is often unaware of the use of these tools.
Even the creators of algorithms often cannot fully explain how the software came to the conclusion that was reached.
Several city agencies are starting to use decision systems. The Fire Department uses the Risk-Based Inspection System (RBIS) to predict where fires might start. Part of the RBIS is the Fire Cast tool that uses data from five city agencies to analyze 60 risk factors to predict which buildings are most vulnerable to fire outbreaks. These buildings are then prioritized for inspections, the data being available to all the city’s 49 fire companies.
The Police Department uses algorithms for the data obtained from body cameras and facial recognition.
Algorithms are also used by the Department of Transportation, the Mayor’s Office of Criminal Justice, the Department of Education, and the Department of Social Services. Students are matched with schools. Teacher performance is assessed. Medicare fraud is investigated.
Problems with the Current Legislation
Julia Powels, a research fellow at NYU’s Information Law Institute as well as at Cornell Tech, described two problems with the task force’s mission which resulted from a compromise between the original legislation and what passed.
First, if the agencies and contractors do not cooperate, good recommendations will not be made. There is no easily accessible information on how much the City of New York spends on algorithmic services, or how much of the data used is shared with outside contractors. The Mayor’s office rejected any requirement for mandated reporting to be in the legislation based on the argument that it would reveal proprietary information. If too much leeway is given to claims of corporate secrecy, there will be no algorithmic transparency.
The other problem with the current law is that it is unclear how the city can change the behavior of companies that create automated-decision making systems. Frank Pasquale, a law professor at the University of Maryland, argues that the city has more leverage than the vendors.
Members of the Task Force
The members of this task force are not limited to experts in algorithmic design and implementation, but can include people who understand the impact of algorithms on society. It will be composed of individuals from city agencies, academia, law, industry experts, and nonprofits and think tanks. It is expected that representatives will be chosen from the Department of Social Services, the Police Department, the Department of Transportation, the Mayor’s Office of Criminal Justice, the Administration for Children’s Services, and the Department of Education
The task force is co-chaired by Emily W. Newman, Acting Director of the Mayor’s Office of Operations, and Brittny Saunders, Deputy Commissioner for Strategic Initiatives at the Commission on Human Rights.
Impact
New York City could have an impact with algorithms similar to California with auto emission standards. Being one of the largest cities in the world, it may make wide enough use of algorithms such that it might be easier to meet whatever standards it creates in all jurisdictions. Altering algorithms for different locations, however, might be easier with software than mechanical devices. This is illustrated by the ability of software to calculate different sales tax regulations in different states, cities, towns, counties, etc. though out the United States. On the other hand, New York is one of the most valuable sources of demographic data in the world. Restricting the use here, might encourage other locations to do the same.
In any case, the argument over the fairness of algorithmic decisions, and the need to use them, is not going away.
MMS • RSS
Article originally posted on Data Science Central. Visit Data Science Central
Forrester published a report titled “The Sorry State of Digital Transformation in 2018” (love the brashness of the title) that found that 21% of 1,559 business and IT decision makers consider their digital transformations complete. Complete? Say what?!
The concept of “Digital Transformation” is confusing because many CIO’s (at least 21%) and their business counterparts think “Digital Transformation” is about deploying digital technologies (like smartphones, tablet and “native cloud” applications) to convert manual and analog processes into digital processes. It’s the word “Digital” that is confusing because it immediately steers the conversation towards technology.
So let me try something different – I don’t want to achieve digital transformation, I want to achieve “Intelligence Transformation” where intelligence is defined as: “The ability to continuously learn and evolve with every interaction.”
I want to embed “intelligence” into every one of my products, processes and services. I want to create products, processes and services that are continuouslylearning and evolving from every interaction, whether that interaction is with a customer, employee, partner or even another machine. Which then leads me to my definition of “Intelligence Transformation”: The application of advanced analytic capabilities to create continuously learning and adapting processes, products, and assets that improve business and operational efficiency, enhance customer value, mitigate compliance and security risk, and uncover new monetization opportunities”
It’s not a focus on the “what” (visual perception, speech recognition, language translation, neural networks, machine learning), but a focus on the “why” (operational efficiency, risk mitigation, customer value).
Intelligence Transformation Elements
In my simplified world of teaching, I like to boil things down to their basics. What I’ve found in teaching at the University of San Francisco School of Management is that if you don’t explain something succinctly in the classroom, you’ll immediately be faced with 30 raised hands.
So here are the three elements that comprise Intelligence Transformation:
- Big Data. Big Data is the fuel behind the intelligence transformation because it is within the growing bounty of structured and unstructured data that patterns, relationships and insights are buried. The more data, the better. And the more accurate, more granular, more complete (with robust metadata) and lower latency the data, the better.
- Advanced Analytics. Advanced Analytics includes the bevy of advanced analytic tools (statistics, data mining, predictive analytics, machine learning, deep learning, reinforcement learning) that we use to tease out or uncover customer, product and operational insights out of that growing bounty of data. See “Artificial Intelligence is not “Fake” Intelligence” blog.
- Intelligent Applications. Applications are the vehicle for delivering actionable insights (think prescriptive and preventative recommendations) AND capturing the resulting interactions and actions of the humans and machines as they interact with the application. See “The Future Is Intelligent Apps” blog.
That’s it. Sure we can expand that list to the point where it’s so confusing that 21% of CIOs will think they’ve achieved Intelligence Transformation. But what’s the point of doing that (unless you are a technology vendor or an analyst, where confusion and FUD seem to be your best sales tools).
Intelligence Transformation is about how effective the organization is at leveraging big data and advanced analytics to create intelligent value creation processes. Intelligence Transformation is about how the economics of big data and advanced analytics can re-engineer your business models (see Figure 1).

Figure 1: Big Data Business Model Maturity Index
I’m in Bali this week to lead a workshop with Hitachi Vantara’s top Asia-Pac customers. You can bet that this topic will be top of the agenda!
MMS • RSS
Article originally posted on InfoQ. Visit InfoQ
Pymetrics, an AI start-up that specializes in providing recruitment services for organizations, has recently open-sourced their bias detection algorithms on Github. The tool, also known as Audit AI, is used to mitigate discriminatory patterns that exist within training data sets which influence or improve the probability of a population being selected by a machine learning algorithm.
As more and more workloads are being automated by processes leveraging machine learning, it is important to ensure these algorithms don’t develop biases that create un-fair advantages. Pymetrics seeks to ensure that machine learning algorithms remain fair.
The overall goal of this research is to come up with a reasonable way to think about how to make machine learning algorithms more fair. While identifying potential bias in training datasets and by consequence the machine learning algorithms trained on them is not sufficient to solve the problem of discrimination, in a world where more and more decisions are being automated by Artifical Intelligence, our ability to understand and identify the degree to which an algorithm is fair or biased is a step in the right direction.
Organizations are increasing their focus on diversity, but there have been some concerns about how algorithms that learn biases, may actually undermine these diversity efforts. Recently, France declared their desire to be an AI powerhouse and being able to compete on the global stage. In March of this year, President Emmanuel Macron outlined his national strategy for AI which includes spending $1.85 billion USD over the next five years to develop the ecosystem that can compete with Silicon Valley and China. Making this level investment in AI hasn’t come without some careful consideration for the president:
I think that AI could totally jeopardize democracy. For instance, we are using artificial intelligence to organize the access to universities for our students That puts a lot of responsibility on an algorithm. A lot of people see it as a black box, they don’t understand how the student selection process happens. But the day they start to understand that this relies on an algorithm, this algorithm has a specific responsibility. If you want, precisely, to structure this debate, you have to create the conditions of fairness of the algorithm and of its full transparency. I have to be confident for my people that there is no bias, at least no unfair bias, in this algorithm.
For France, having fair algorithms ensures there are no bias in terms of gender, age or other individual characteristics. Without building fairness and transparency into the algorithms, President Macron expects that “people will eventually reject this innovation”.
Pymetrics’ clients include companies in consumer-goods, technology and research firms. As part of Pymetrics’ offering, they provide a set of games for candidates to play. These games are usually played early in the recruitment process and ignore characteristics like race, gender and level of education. Instead, candidates are evaluated based upon 80 traits, including memory and attitude towards risk. Pymetrics is then able to measure candidates against existing top performers to predict future success for that role.
Pymetrics chose to open source Audit AI for social responsibility reasons. Priyanka Jain, a product lead at Pymetrics, explains:
As creators of technology, we feel really strongly it’s our responsibility to build AI that is creating a future that we all want to live in, and if we have a way to help other creators of technology continue to build that feature as well, it’s our responsibility to share it.
Within the Github repository, developers can find a Python library which has been built on pandas and sklearn that implements these “fair” machine learning algorithms and two example datasets that cover German credit and student performance scenarios.
MMS • RSS
Article originally posted on Data Science Central. Visit Data Science Central
This article was written by Bob Hayes
A recent survey of over 16,000 data professionals showed that the most common challenges to data science included dirty data (36%), lack of data science talent (30%) and lack of management support (27%). Also, data professionals reported experiencing around three challenges in the previous year. A principal component analysis of the 20 challenges studied showed that challenges can be grouped into five categories.
Data science is about finding useful insights and putting them to use. Data science, however, doesn’t occur in a vacuum. When pursuing their analytics goals, data professionals can be confronted by different types of challenges that hinder their progress. This post examines what types of challenges experienced by data professionals. To study this problem, I used data from the Kaggle 2017 State of Data Science and Machine Learning survey of over 16,000 data professionals (survey data collected in August 2017).
Barriers and Challenges at Work
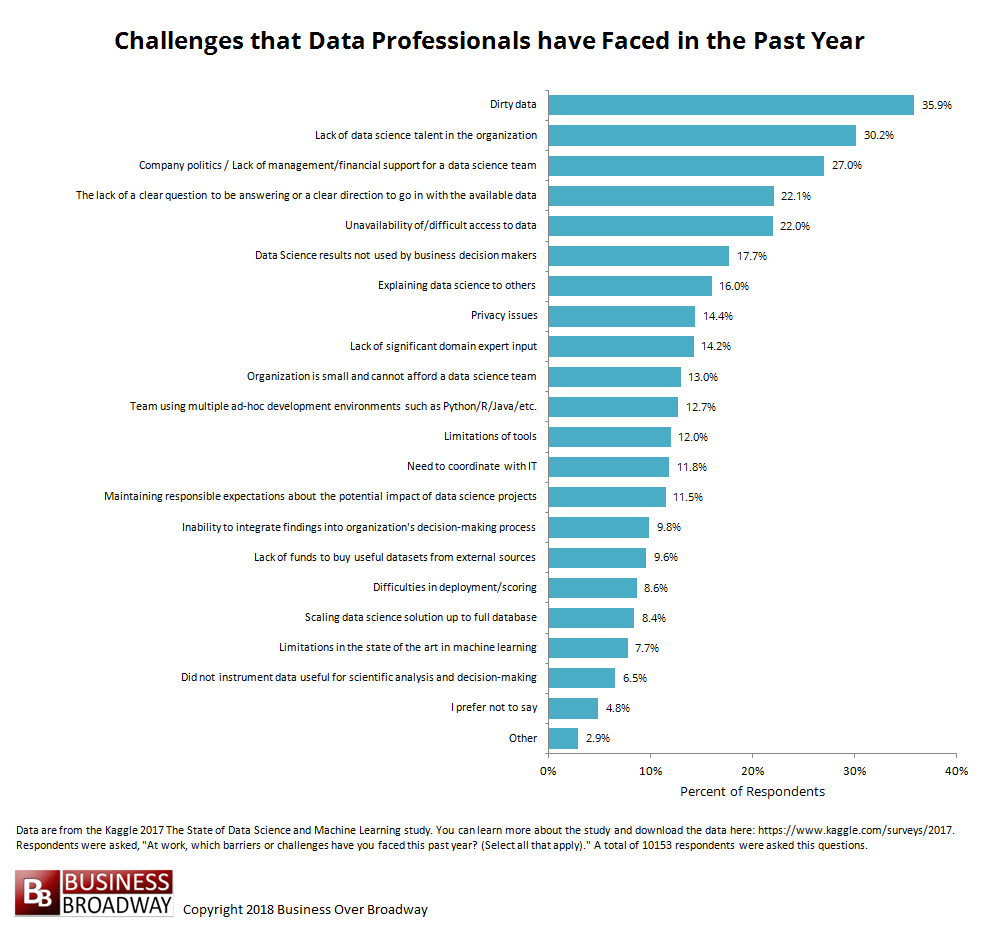
The survey asked respondents, “At work, which barriers or challenges have you faced this past year? (Select all that apply).” Results appear in Figure 1 and show that the top 10 challenges were:
- Dirty data (36% reported)
- Lack of data science talent (30%)
- Company politics (27%)
- Lack of clear question (22%)
- Data inaccessible (22%)
- Results not used by decision makers (18%)
- Explaining data science to others (16%)
- Privacy issues (14%)
- Lack of domain expertise (14%)
- Organization small and cannot afford data science team (13%)
Results revealed that, on average, data professionals reported experiencing three (median) challenges in the previous year. The number of challenges experienced varied significantly across job title. Data professionals who self-identified as a Data Scientist or Predictive Modeler reported using four platforms. Data pros who self-identified as a Programmer reported only one challenge.
To read the rest of this article, click here. To read more articles like this, click here.
DSC Resources
- Free Book: Applied Stochastic Processes
- Comprehensive Repository of Data Science and ML Resources
- Advanced Machine Learning with Basic Excel
- Difference between ML, Data Science, AI, Deep Learning, and Statistics
- Selected Business Analytics, Data Science and ML articles
- Hire a Data Scientist | Search DSC | Classifieds | Find a Job
- Post a Blog | Forum Questions
MMS • RSS
Article originally posted on Data Science Central. Visit Data Science Central
 Spark is a powerful tool which can be applied to solve many interesting problems. Some of them have been discussed in our previous posts. Today we will consider another important application, namely streaming. Streaming data is the data which continuously comes as small records from different sources. There are many use cases for streaming technology such as sensor monitoring in industrial or scientific devices, server logs checking, financial markets monitoring, etc.
In this post, we will examine the case with sensors temperature monitoring. For example, we have several sensors (1,2,3,4,…) in our device. Their state is defined by the following parameters: date (dd/mm/year), sensor number, state (1 – stable, 0 – critical), and temperature (degrees Celsius). The data with the sensors state comes in streaming, and we want to analyze it. Streaming data can be loaded from the different sources. As we don’t have the real streaming data source, we should simulate it. For this purpose, we can use Kafka, Flume, and Kinesis, but the simplest streaming data simulator is Netcat.
First off, run Netcat as a data server with the following command:
nc -lk 8080
Then, we enter the sensors data to it:
21/01/2001 1 1 2322/01/2001 2 0 2023/01/2001 3 1 15
24/01/2001 4 1 10

25/01/2001 5 0 5
Next, we will listen to this server at the port 8080 with the help of Spark Streaming module. Note, that we can send more data with nc during streaming program execution.
In contrast to the previous posts, we will not perform our example in the Spark shell. >We’ll save it as a streaming.py file in a Spark home directory. The folder name could be spark-2.3.0-bin-hadoop2.7 (depending on the Spark version that you have).
Counting by values
Let’s start with the simple example. We want to calculate how many records came from each sensor.
First off, we have to make some imports:
from pyspark import SparkContextfrom pyspark.streaming import StreamingContext
Then, we begin the program with a common line:
if __name__ == "__main__":
The first important step in every streaming program is initializing StreamingContext. Add the following lines in your program:
sc = SparkContext(appName="PythonStreamingCountByValue")ssc = StreamingContext(sc, 30)
In the last line, 30 is the batch duration.
Now, we should create a DStream that will receive data from the Netcat connecting to hostname:port, like localhost:8080.
ds = ssc.socketTextStream('localhost', 8080)
It is necessary to say that DStream is the continuous sequence of RDD.
The next step is to split our DStream lines to elements and select the second column (sensor number) of our streaming data. This can be achieved with map(func) transformation. The map simply applies the func to each element of the stream.
data = ds.map(lambda line: int(line.split(" ")[1]))
Then, by applying countByValue transformation, we will count how many times the data came from each sensor during this batch.
data_count = data.countByValue()
Finally, let’s print the result:
data_count.pprint()
With the code above, we’ve defined the algorithm of our data transformation. To start the execution, we need to start StreamingContext with the following line:
ssc.start()
Then we have to set up when to stop Spark Streaming:
ssc.awaitTermination()
If we enter the following input to the Netcat,
01/02/2001 1 1 2301/02/2001 2 0 1201/02/2001 3 1 22
02/02/2001 1 1 25

02/02/2001 2 0 15

02/02/2001 3 0 10
we will get the output like below.
-------------------------------------------Time: 2018-06-22 16:30:30-------------------------------------------
(3, 2)

(1, 2)

(2, 2)
As you can see from the table, the data have come twice from each sensor.
Complete code:
from pyspark import SparkContextfrom pyspark.streaming import StreamingContext
if __name__ == "__main__":

        sc = SparkContext(appName="PythonStreamingCountByValue")

        ssc = StreamingContext(sc, 30)


        ds = ssc.socketTextStream('localhost', 8080)


        data = ds.map(lambda line: int(line.split(" ")[1]))

        data_count = data.countByValue()

        data_count.pprint()


        ssc.start()

        ssc.awaitTermination()
To run the streaming program, execute:
./bin/spark-submit streaming.py
Filtering
Let’s move to another common task in streaming – filtering. Say we want to accept messages only from online sensors. The filter transformation will help us with this. It returns only the records for which the previously defined function returns true.
Now you may change your program or save it as another file. Whatever you choose, keep the skeleton of the program the same except the lines:
data = ds.map(lambda line: int(line.split(" ")[1]))data_count = data.countByValue()data_count.pprint()
These lines are the main ones in our program (transformations take place here and the result is printed), so in the examples below we’ll change only these lines.
Replace them with the following ones. (Maybe you’d want to update the appName too)
data = ds.map(lambda line: line.split(" ")).map(lambda l: (l[0],int(l[1]),int(l[2]),int(l[3])))data_filter = data.filter(lambda line: line[2]==1)
data_filter.pprint()
In the table below, there are input and output for this task
01/02/2001 1 1 2302/02/2001 2 0 1003/02/2001 3 1 25
02/02/2001 2 0 10

01/02/2001 1 1 22

04/02/2001 4 1 24

02/02/2001 1 1 19

05/02/2001 5 0 13

06/02/2001 6 1 26
-------------------------------------------Time: 2018-07-05 09:08:00-------------------------------------------
('01/02/2001', 1, 1, 23)

('03/02/2001', 3, 1, 25)

('01/02/2001', 1, 1, 22)

('04/02/2001', 4, 1, 24)

('02/02/2001', 1, 1, 19)

('06/02/2001', 6, 1, 26)
Complete code:
from pyspark import SparkContextfrom pyspark.streaming import StreamingContext
if __name__ == "__main__":

        sc = SparkContext(appName="PythonStreamingFiltration")

        ssc = StreamingContext(sc, 30)


        ds = ssc.socketTextStream('localhost', 8080)


        data = ds.map(lambda line: (line.split(" ")))

        .map(lambda l: (l[0],int(l[1]),int(l[2]),int(l[3])))

        data_filter = data.filter(lambda line: line[2]==1)

        data_filter.pprint()


        ssc.start()

        ssc.awaitTermination()
The maximum temperature of the sensor
Now we’ll make our program more interesting. Let’s assume that we need to know what is the highest temperature of our sensors. To get this information, we should use reduce transformation with max function. The max function gives us the maximum value and the reduce transformation returns the value, calculated by aggregating the element of RDD with the defined function (max in our case).
Again, leave the program skeleton the same. Replace the lines, where transformations take place and the result is printed, with the following ones:
temperature = ds.map(lambda line: int(line.split(" ")[3]))result = temperature.reduce(max)result.pprint()
In the case of the same input you will get the result:
-------------------------------------------Time: 2018-06-14 12:42:00-------------------------------------------
25
Complete code:
from pyspark import SparkContextfrom pyspark.streaming import StreamingContext
if __name__ == "__main__":

        sc = SparkContext(appName="PythonStreamingNetworkMaxTemperature")

        ssc = StreamingContext(sc, 30)


        ds = ssc.socketTextStream('localhost', 8080)

        temperature = ds.map(lambda line: int(line.split(" ")[3]))

        result = temperature.reduce(max)

        result.pprint()


        ssc.start()

        ssc.awaitTermination()
Conclusions
Streaming data is widely used in various practical applications. One of the most popular streaming application is the receiving data from different sensors in real-time mode. There are many instruments for streaming data analysis (Flink, Storm, Kafka, Spark, Samza, Kinesis, etc.), among which Apache Spark is one of the most popular due to its convenience and simplicity. Apache Spark has a special library for streaming. In this article, we’ve made a brief overview of Spark Streaming functionality and applied a few basic functions to our data. We have shown that only with several lines of code it is possible to obtain useful information from the datastream, analyze and print it.
MMS • RSS
Article originally posted on Data Science Central. Visit Data Science Central
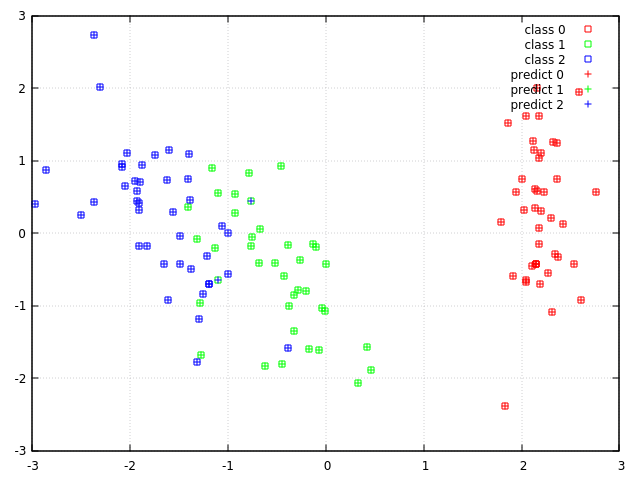
Shark-ML is an open-source machine learning library which offers a wide range of machine learning algorithms together with nice documentation, tutorials and samples. In this post I will show how to use this library for solving classification problem, with two different algorithms SVM and Random Forest. This post will tell you about how to use API for:
1. Loading data
2. Performing normalization and dimension reduction
3. Configuring cross-validation training and grid search for parameters
4. Evaluation models on different sets of data
5. Visualizing prediction result
 Continue reading the article and source code here.
Cloud-based Database Market 2018 Global Analysis and Share: Salesforce, Couchbase, SAP …
MMS • RSS
Posted on mongodb google news. Visit mongodb google news
Teradata, Salesforce, Rackspace Hosting, Amazon Web Services, Tencent, Google, Alibaba, Microsoft, Oracle, Couchbase, IBM, MongoDB, Cassandra and SAP more. Step by Step Analysis of the Main Market Players Included in Global Cloud-based Database Market study report.
The Comprehensive Analysis of Global Cloud-based Database Market. The analysis covers the present scenario (2012-2017) and the increased prospects (2018-2023) of this worldwide Cloud-based Database market. The investigation report incorporates diverse topics such as overall market size, key market drivers, challenges, and Cloud-based Database growth opportunities and technological modifications, key players, etc. To figure out the industry dimensions, the Cloud-based Database report believes the 90-95 percent of this total addressable market (TAM) by the significant players round many segments.
Request sample of this report @ http://globalmarketfacts.us/global-cloud-based-database-market/2507/#request-sample
This record offers the detailed analysis of global industry for Cloud-based Database in 2012-2017, and extensive market predictions (2018-2023) from region/country and sub-sectors. It ensures the volumes, costs, and historic expansion and future perspectives in the global Cloud-based Database market and farther sets and analyzes these factors impacting the supply/demand, and also the opportunities/challenges faced by industry participants.
Segmentation Based on Cloud-based Database Market Types-
SQL Database
NoSQL Database
Segmentation Based on Cloud-based Database Application-
Small and Medium Business
Large Enterprises
The report offers regional comprehensive analyses to its Europe, North America, Asia-Pacific, Middle East and Africa and South America. Within this industry, global competitive landscape and also supply/demand design of global Cloud-based Database industry.
Study Research Provides:
➜ Cloud-based Database Company profiling with true methodologies, financial’s, and current developments;
➜ Industry Trends (Investment Opportunities, Tips, Opportunities, Challenges, Hazards, and Limitations);
➜ The best Cloud-based Database industry players market share information;
➜ Economy Trends (Constraints, global Cloud-based Database Opportunities, Threats, Challenges, Investment Opportunities);
➜ Market predictions for five or more years of most the specified sections, sub-segments along with also the regional businesses;
➜ Vital suggestions in key Cloud-based Database market business segments in line with this market estimation;
➜ The primary prevalent tendencies in aggressive landscaping mapping;
➜ Global Cloud-based Database market-share evaluations for the regional sections;
➜ Methodological tips to new contenders;
➜ Supply series trends mapping the Cloud-based Database current innovative developments;
➜ Essential ideas for Cloud-based Database new entrants;
Can Inquiry and Read Full TOC with Tables and Figures at: http://globalmarketfacts.us/global-cloud-based-database-market/2507/#inquiry
While calling the current Cloud-based Database market sector and deriving the CAGR, the analysts also have taken under consideration the principal market drivers, both macro and microeconomic things, regulatory and policy changes and aftereffect of policies.
The report answers fundamental questions just such as the industry size through 2012-2023 and the various Cloud-based Database market growth rates for forecast years. The Cloud-based Database report also examines the market trends for its essential competitions and their market shares concerning.
Article originally posted on mongodb google news. Visit mongodb google news