Month: July 2018

MMS • RSS
Article originally posted on Data Science Central. Visit Data Science Central
 Nowadays data proves to be a powerful pushing force of the industry. Big companies representing diverse trade spheres seek to make use of the beneficial value of the data.
Thus, data has become of great importance for those willing to take profitable decisions concerning business. Moreover, a thorough analysis of a vast amount of data allows influencing or rather manipulating the customers’ decisions. Numerous flows of information, along with channels of communication, are used for this purpose.
The sphere of the retail develops rapidly. The retailers manage to analyze data and develop a peculiar psychological portrait of a customer to learn his or her sore points. Thereby, a customer tends to be easily influenced by the tricks developed by the retailers.
This article presents top 10 data science use cases in the retail, created for you to be aware of the present trends and tendencies.
Recommendation engines
Recommendation engines proved to be of great use for the retailers as the tools for customers’ behavior prediction. The retailers tend to use recommendation engines as one of the main leverages on the customers’ opinion. Providing recommendations enables the retailers to increase sales and to dictate trends.

Recommendation engines manage to adjust depending on the choices made by the customers. Recommendation engines make a great deal of data filtering to get the insights. Usually, recommendation engines use either collaborative or content-based filtering. In this regard, the customer’s past behavior or the series of the product characteristics are under consideration. Besides, various types of data such as demographic data, usefulness, preferences, needs, previous shopping experience, etc. go via the past data learning algorithm.
Then the collaborative and content filtering association links are built. The recommendation engines compute a similarity index in the customers’ preferences and offer the goods or services accordingly. The up-sell and cross-sell recommendations depend on the detailed analysis of an online customer’s profile.
Market basket analysis
Market basket analysis may be regarded as a traditional tool of data analysis in the retail. The retailers have been making a profit out of it for years.
This process mainly depends on the organization of a considerable amount of data collected via customers’ transactions. Future decisions and choices may be predicted on a large scale by this tool. Knowledge of the present items in the basket along with all likes, dislikes, and previews is beneficial for a retailer in the spheres of layout organization, prices making and content placement. The analysis is usually conducted via rule mining algorithm. Beforehand the data undertakes transformation from data frame format to simple transactions. A specially tailored function accepts the data, splits it according to some differentiating factors and deletes useless. This data is input. On its basis, the association links between the products are built. It becomes possible due to the association rule application.
The insight information largely contributes to the improvement of the development strategies and marketing techniques of the retailers. Also, the efficiency of the selling efforts reaches its peak.
Warranty analytics
Warranty analytics entered the sphere of the retail as a tool of warranty claims monitoring, detection of fraudulent activity, reducing costs and increasing quality. This process involves data and text mining for further identification of claims patterns and problem areas. The data is transformed into actionable real-time plans, insight, and recommendations via segmentation analysis.
The methods of detecting are quite complicated, as far as they deal with vague and intensive data flows. They concentrate on the detecting anomalies in the warranty claims. Powerful internet data platforms speed up the analysis process of a significant amount of warranty claims. This is an excellent chance for the retailers to turn warranty challenges into actionable intelligence.
Price optimization
Having a right price both for the customer and the retailer is a significant advantage brought by the optimization mechanisms. The price formation process depends not only on the costs to produce an item but on the wallet of a typical customer and the competitors’ offers. The tools for data analysis bring this issue to a new level of its approaching.
Price optimization tools include numerous online tricks as well as secret customers approach. The data gained from the multichannel sources define the flexibility of prices, taking into consideration the location, an individual buying attitude of a customer, seasoning and the competitors’ pricing. The computation of the extremes in values along with frequency tables are the appropriate instruments to make the variable evaluation and perfect distributions for the predictors and the profit response.
The algorithm presupposes customers segmentation to define the response to changes in prices. Thus, the costs that meet corporates goals may be determined. Using the model of a real-time optimization the retailers have an opportunity to attract the customers, to retain the attention and to realize personal pricing schemes.
Inventory management
Inventory, as it is, concerns stocking goods for their future use. Inventory management, in its turn, refers to stocking goods in order to use them in time of crisis. The retailers aim to provide a proper product at a right time, in a proper condition, at a proper place. In this regard, the stock and the supply chains are deeply analyzed.
Powerful machine learning algorithms and data analysis platforms detect patterns, correlations among the elements and supply chains. Via constantly adjusting and developing parameters and values the algorithm defines the optimal stock and inventory strategies. The analysts spot the patterns of high demand and develop strategies for emerging sales trends, optimize delivery and manage the stock implementing the data received.
Location of new stores
Data science proves to be extremely efficient about the issue of the new store’s location. Usually, to make such a decision a great deal of data analysis is to be done.
The algorithm is simple, though very efficient. The analysts explore the online customers’ data, paying great attention to the demographic factor. The coincidences in ZIP code and location give a basis for understanding the potential of the market. Also, special settings concerning the location of other shops are taken into account. As well as that, the retailer’s network analysis is performed. The algorithms find the solution by connection all these points. The retailer easily adds this data to its platform to enrich the analysis opportunities for another sphere of its activity.
Customer sentiment analysis
Customer sentiment analysis is not a brand-new tool in this industry. However, since the active implementation of data science, it has become less expensive and time-consuming. Nowadays, the use of focus groups and customers polls is no longer needed. Machine learning algorithms provide the basis for sentiment analysis.

The analysts can perform the brand-customer sentiment analysis by data received from social networks and online services feedbacks. Social media sources are readily available. That is why it is much easier to implement analytics on social platforms. Sentiment analytics uses language processing to track words bearing a positive or negative attitude of a customer. These feedbacks become a background for services improvement.
The analysts perform sentiment analysis on the basis of natural language processing, text analysis to extract defining positive, neutral or negative sentiments. The algorithms go through all the meaningful layers of speech. All the spotted sentiments belong to certain categories or buckets and degrees. The output is the sentiment rating in one of the categories mentioned above and the overall sentiment of the text.
Merchandising
Merchandising has become an essential part of the retail business. This notion covers a vast majority of activities and strategies aimed at increase of sales and promotion of the product.
The implementation of the merchandising tricks helps to influence the customer’s decision-making process via visual channels. Rotating merchandise helps to keep the assortment always fresh and renewed. Attractive packaging and branding retain customers’ attention and enhance visual appeal. A great deal of data science analysis remains behind the scenes in this case.
The merchandising mechanisms go through the data picking up the insights and forming the priority sets for the customers, taking into account seasonality, relevancy and trends.
Lifetime value prediction
In retail, customer lifetime value (CLV) is a total value of the customer’s profit to the company over the entire customer-business relationship. Particular attention is paid to the revenues, as far as they are not so predictable as costs. By the direct purchases two significant customer methodologies of lifetime predictions are made: historical and predictive.
All the forecasts are made on the past data leading up to the most recent transactions. Thus the algorithms of a customer’s lifespan within one brand are defined and analyzed. Usually, the CLV models collect, classify and clean the data concerning customers’ preferences, expenses, recent purchases and behavior to structure them into the input. After processing this data we receive a linear presentation of the possible value of the existing and possible customers. The algorithm also spots the interdependencies between the customer’s characteristics and their choices.
The application of the statistical methodology helps to identify the customer’s buying pattern up until he or she stops making purchases. Data science and machine learning assure the retailer’s understanding of his customer, the improvement in services and definition of priorities.
Fraud detection

The detection of fraud and fraud rings is a challenging activity of a reliable retailer. The main reason for fraud detection is a great financial loss caused. And this is only a tip of an iceberg. The conducted profound National Retail Security Survey goes deeply into details. The customer might suffer from fraud in returns and delivery, the abuse of rights, the credit risk and many other fraud cases that do nothing but ruin the retailer’s reputation. Once being a victim of such situations may destroy a precious trust of the customer forever.
The only efficient way to protect your company’s reputation is to be one step ahead of the fraudsters. Big data platforms provide continuous monitoring of the activity and ensure the detection of the fraudulent activity.
The algorithm developed for fraud detection should not only recognize fraud and flag it to be banned but to predict future fraudulent activities. That is why deep neural networks prove to be so efficient. The platforms apply the common dimensionality reduction techniques to identify hidden patterns, to label activities and to cluster fraudulent transactions.
Using the data analysis mechanisms within fraud detection schemes brings benefits and somewhat improves the retailer’s ability to protect the customer and the company as it is.
Conclusions
Data science seeks its implementation in various sphere of human life. The companies implement different models of data analysis to enhance the customers’ shopping experiences. In this regard, all the transactions, e-mails, and search inquiries, previous purchases, etc. are analyzed and processed to optimize the marketing moves and merchandising processes.
We attempted to highlight the top 10 data science use cases in the retail. These data science use cases prove the statement that data science and analysis have entered the sphere of the retail rapidly and still preserve its leading positions.
MMS • RSS
Article originally posted on Data Science Central. Visit Data Science Central
Insights and Advice from Data Science Leaders and Key Influencers Paperback – July 13, 2018. By Matt Corey.
The Data Scientist’s Book of Quotes includes over 300 insightful and inspiring quotes from the world’s leading Data Science thought leaders and key influencers across the world, including Andrew Ng, Bernard Marr, Vincent Granville, Carla Gentry, Cathy O’Neil and Hilary Mason. The Data Scientist role is one of the most pivotal and disruptive roles in today’s global marketplace, that is, and will be transforming and revolutionizing our business and societal DNA to unrecognizable proportions.

The role requires a unique set of hybrid skills, abilities and tools in the areas of mathematics and statistics, computer programming and coding (including databases and visualization), business and industry knowledge, and being a solid and convincing communicator. In many cases, he/she may be the key driver and flagbearer of creating a data-driven culture of accepting and adapting change to further the organisation’s growth potential.
This book offers Data Scientists and Data Science professionals – through its contributors – valued insights and essential facts and advice on better understanding the Data Scientist role and its significant importance to uncover and drive insights towards greater growth and innovation for the respective organisation and society as a whole. Topics include: · What is a Data Scientist? · Power and Potential of Data and Data Science · Potential Risks of Data · Challenges within Data · Machine Learning · Deep Learning · Artificial Intelligence · Data Ethics and Data Privacy · Future of Data · End of Chapter Exercises · Data Science – Book and Film Recommendations
About the Author
Matt Corey is the leader of Change Force, an exclusive Data Scientist Recruitment Practice. He is committed and passionate to helping organisations reach their growth potential through Data Scientists and their respective contributions to making a positive impact within the marketplace and society. He is available for talks and conferences on the subjects of Data Science, Data-Driven Culture and Organisation and the Attraction, Retention, Recruitment and Employee Integration of Data Scientists. Matt lives in London, United Kingdom and you can visit the company website at www.changeforceinc.com
You can buy the book here.
DSC Resources
- Free Book: Applied Stochastic Processes
- Comprehensive Repository of Data Science and ML Resources
- Advanced Machine Learning with Basic Excel
- Difference between ML, Data Science, AI, Deep Learning, and Statistics
- Selected Business Analytics, Data Science and ML articles
- Hire a Data Scientist | Search DSC | Classifieds | Find a Job
- Post a Blog | Forum Questions
MMS • RSS
Posted on mongodb google news. Visit mongodb google news
MongoDB, Inc. (MDB):
As took short look on profitability, the firm profit margin which was recorded -62.10%, and operating margin was noted at -62.70%. The company maintained a Gross Margin of 72.20%. The Institutional ownership of the firm is 72.20% while Insiders ownership is 1.00%. Company has kept return on investment (ROI) at -50.90% over the previous 12 months and has been able to maintain return on asset (ROA) at -31.90% for the last twelve months. Return on equity (ROE) recorded at -162.20%.
MongoDB, Inc. (MDB) stock price registered the value at $60.56 by scoring a change of 2.98% at the end of Wednesday trading session. The recent trading activity revealed that the stock price is at 145.98% off from its 52-week low and traded with move of 0.75% from high printed in the last 52-week period. The Company kept 23.61M Floating Shares and holds 50.6M shares outstanding.
The company’s earnings per share shows growth of -129.50% for the current year and expected to arrive earnings growth for the next year at 25.90% . The earnings growth rate for the next years is an important measure for investors planning to hold onto a stock for several years. The company’s earnings will usually have a direct relationship to the price of the company’s stock. EPS growth quarter over quarter stands at -44.00% and Sales growth quarter over quarter is at 48.80%.
MongoDB, Inc. (MDB) stock recent traded volume stands with 896458 shares as compared with its average volume of 969.96K shares. The relative volume observed at 0.92.
Volume can help determine the health of an existing trend. A healthy up-trend should have higher volume on the upward legs of the trend, and lower volume on the downward (corrective) legs. A healthy downtrend usually has higher volume on the downward legs of the trend and lower volume on the upward (corrective) legs.
Shares price moved with 0.75% from its 50 Day high and distanced at 49.13% from 50 Day low. Analyses consensus rating score stands at 2.2. For the next one year period, the average of individual price target estimates referred by covering sell-side analysts is $53.18.
The current ratio of 2.3 is mainly used to give an idea of a company’s ability to pay back its liabilities (debt and accounts payable) with its assets (cash, marketable securities, inventory, accounts receivable). As such, current ratio can be used to make a rough estimate of a company’s financial health. The quick ratio of 2.3 is a measure of how well a company can meet its short-term financial liabilities with quick assets (cash and cash equivalents, short-term marketable securities, and accounts receivable). The higher the ratio, the more financially secure a company is in the short term. A common rule of thumb is that companies with a quick ratio of greater than 1.0 are sufficiently able to meet their short-term liabilities.
The long term debt/equity shows a value of 0 with a total debt/equity of 0. It gives the investors the idea on the company’s financial leverage, measured by apportioning total liabilities by its stockholders equity. It also illustrates how much debt the corporation is using to finance its assets in relation to the value represented in shareholders’ equity.
Moving averages help technical traders track the trends of financial assets by smoothing out the day-to-day price fluctuations, or noise. By identifying trends, moving averages allow traders to make those trends work in their favor and increase the number of winning trades. The shorter the period of a moving average, the more rapidly it will change with price action. However, it is more likely to provide less reliable signals compared to those provided by a longer-term moving average. The longer the period of a moving average, the more slowly it will change with price action. However, the signals it provides are more reliable.
MongoDB, Inc. (MDB) stock moved above 12.06% in contrast to its 20 day moving average displaying short-term positive movement of stock. It shifted 17.43% above its 50-day simple moving average. This is showing medium-term optimistic trend based on SMA 50. The stock price went overhead 60.92% from its 200-day simple moving average identifying long-term up trend.

Larry Spivey – Category – Business
Larry Spivey also covers the business news across all market sectors. He also has an enormous knowledge of stock market. He holds an MBA degree from University of Florida. He has more than 10 years of experience in writing financial and market news. Larry previously worked at a number of companies in different role including web developer, software engineer and product manager. He currently covers Business news section.
Article originally posted on mongodb google news. Visit mongodb google news
MMS • RSS
Article originally posted on InfoQ. Visit InfoQ
Key Takeaways
- Before diving into the machine learning of software system behaviour, one has to know the traditional approaches to time series.
- Missing values in your time-series can lead to unexpected results when analyzing them. The “Pandas library” can help you with filling these values in your data in a sensible matter.
- When humans are using your service you should expect seasonality in your data. Take this into account when designing your predictive algorithms.
- Be careful about what threshold you set for anomaly detection. Events that are unlikely for a single server become very likely when scaling your application.
- Understand what you are trying to achieve when analysing time series. Make sure you can not use simple deterministic SQL-like analysis. Know the behaviour of your algorithm on a math scale, and know if you are automating the interpretation of this, or if you are transforming data into predictive residuals and using them.
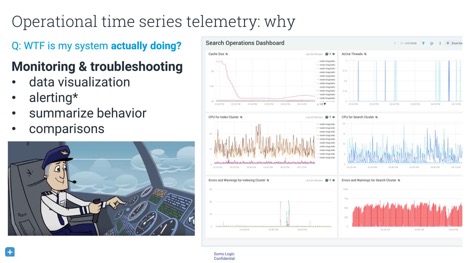
At QCon.ai 2018, David Andrzejewski presented “Understanding Software System Behaviour With ML and Time Series Data”. David is an engineering manager at Sumo Logic, a cloud-based platform for machine-data analysis. Developers who are already running a software system (like an app or cloud cluster) can use Sumo Logic as the back end for their logging. Sumo Logic provides continuous intelligence for this machine data.
A lot of things run on software, and artificial-intelligence techniques are moving into the software world. Before diving deep into machine learning’s impact on software system behaviour, you have to understand the traditional approaches to time series. Knowing the limitations of traditional methods lets you make informed trade-offs in choosing techniques. First, ask yourself if you know what you are trying to accomplish. Once you know, try to ask yourself if you can accomplish this with simple or deterministic analysis. Only look at machine learning when other methods are impossible.
Understanding what your software is doing and why it is failing can be difficult. Companies that deploy services that rely on many microservices on multiple hosts can benefit from a diagram that lists dependencies among those microservices. When drawing this out, you might get an image that people refer to as the microservices death star:

Many applications generate terabytes of logs per day, consist of gigabytes of source code, and output millions of metrics per minute. Analysing this data by hand is impossible, so you need machine intelligence. However, analysing the data to find out only what your system is REALLY doing is a difficult if not impossible task. An interesting paper that goes deeper into the granularity of data and at what level you need it, is “Coulda neuroscientist understand a microprocessor?”. The authors of this paper use a simulator to play the old game of Donkey Kong. Because they own the memory of the simulation, they have access to the complete state of the system. Theoretically, this means it is possible to analyse the data to try to reverse-engineer what is going on at a higher level of understanding, just from looking at the underlying data. Although this tactic can provide small insights, it is unlikely that only looking at the data will allow you to completely understand the higher level of Donkey Kong.
This analogy becomes really important when you are using only raw data to understand complex, dynamic, multiscale systems. Aggregating the raw data into a time-series view makes the problem more approachable. A good resource for this is the book Site Reliability Engineering,which can be read online for free.
Understanding complex, dynamic, multiscale systems is especially important for an engineer who is on call. When a system goes down, he or she has to go in to discover what the system is actually doing. For this, the engineer needs both the raw data and the means to visualise it, as well as higher-level metrics that are able to summarise the data. An engineer in this situation often wants to know how this server is behaving compared to another server, to itself yesterday, or to itself before that one software update.
Upsides and downsides of percentiles
When looking at a long history of log data, you don’t go into continuous millisecond detail. You quantize your data in time. The most basic ways to do this is with functions such as min, max, average, sum, and count. Many people who aggregate data like to use percentiles as well. The advantage of percentiles is that they can express your data in an unambiguous language. An example of a sentence without a percentile is “The maximum time to load a request was 4,300 milliseconds.” This sentence is precise but does not help to determine how far outside the bounds of normal operation it falls. However, saying that “p99 is less than 2,000 milliseconds” indicates that no more than 1% of customer requests take longer than two seconds to load.
The downside of percentiles is that they make it difficult to combine data into something meaningful. Although values around the 50th percentile tend to be stable, higher percentiles will vary a lot and have a long-tailed distribution of possible values. Another problem is that it is easy to aggregate the simple analyses of several datasets. You can calculate the minimum of two datasets by looking only at the minima of both. However, you can’t as simply use the methods with percentiles. It is mathematically impossible to combine the p95 of dataset X and the p95 of dataset Y. This means that it is difficult to say something meaningful about a combination of multiple datasets without further work.
Important time-series concepts
A basic monitoring aspect for time series is time-shifted comparisons. This is particularly important if you want to compare the write latency of one cluster to the write latency of the same host the day before. This can also be combined with windowing data, known as “grouping over time”. More information can be found in Tyler Akidau’s QCon San Francisco 2016 talk, where he discussed this concept in the context of Apache Beam.
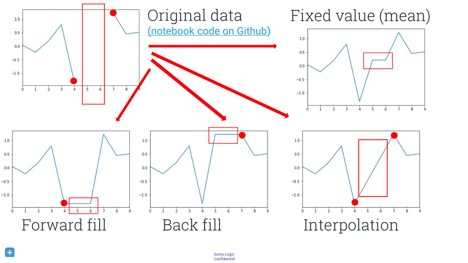
Handling missing data is also important. Before you can apply any machine learning, you have to know how you want to handle missing values. Putting constant values, like zeros or infinities, in place of missing values probably leads to unexpected results. However, not putting anything there will likely yield runtime exceptions later in the loop. This can be prevented by using the pandas Python data-analysis library, a Swiss army knife for data manipulation. You can use the fillna()method, which has some sane and sensible default values. Note that there are a lot of interesting ways to fill gaps in your data, and a lot of research and methods you can use. Some fields call it “predicting” missing data, other fields call it “imputation”, “inference”, or “sampling”. You could forward-fill points, back-fill them, or interpolate them.
Acting on the data
A simple thing to think about when setting up a logging system is fixed-threshold alerting. The goal of alerts is to wake somebody when your website goes down or another unexpected event occurs. Many people start the development of alerts by hiring a domain expert who can set sensible thresholds for various aspects of your system. For example, you could set an alert to fire as soon as 5% of the requests take longer than two seconds, at which point it notifies the engineer who is on call at that moment.
However, human experts don’t scale well. You might want to automatically compare the behaviour of machines to that of other machines, especially when you have many machines outputting many time series. You can’t analyse and compare all these time series yourself, and a large number of machines could prevent you from comparing time series among them. This is the point at which you could try to apply machine learning.
Predictive models and outliers
One approach is outlier detection by using predictive modelling. By predicting what your machines’ normal behaviour is, you can also detect when your machines act outside the predicted output. However, you do need to take a lot into account before you are able to do this. There are four key questions you have to ask:
- Is the behaviour actually regular?
- How can you model the behaviour?
- How do you define a major deviation from your expectation?
- Is it actually valuable to detect surprises and deviations from your expectation?
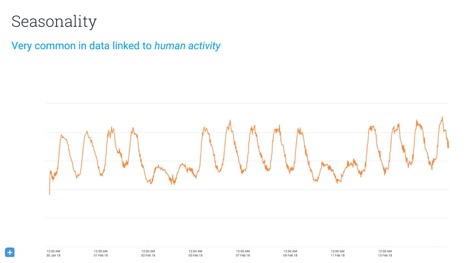
An important thing to consider when doing predictive modelling is seasonality or rhythm of your data. Any service that has humans in the loop has potential for rhythm. For example, most people use Sumo Logic at work, which means that Sumo Logic usage data for any given country will show a lot of activity during normal working hours but not so much outside these hours. However, the usage data for Netflix likely shows the reverse trend. You might be able to model this by manually adjusting your data or by using Fourier transformations. Another option many people use are hidden Markov models.
Distance-based data mining of time series
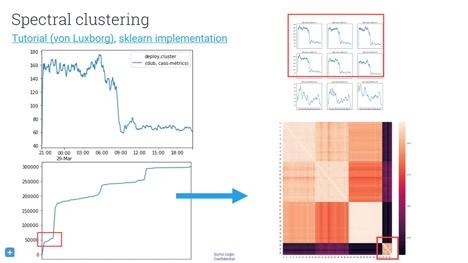
When you have multiple machines, you probably want to compare the behaviour of machines to each other. If you see weird behaviour by one machine, you want to find out if other machines are behaving the same way. Perhaps they are all running different versions of software, perhaps they are in the same data centre, or perhaps something else is happening. To analyse this, you have to compare the distance between time series.
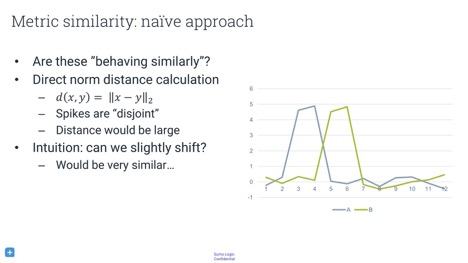
What metric should you use to determine the similarity between two time series? Simply differencing them time-wise by subtracting them from each other is bound to give wrong results. In the image above, although the time series are actually quite similar, this metric will tell you that they are completely different.
There is a whole universe of metrics you can use. One popular technique is dynamic time warping, which basically asks you how you can mutate, warp, or mangle your time series to get them into the best alignment, and what penalty you have to pay for this modification. With this metric, you can either find the N most-similarly behaving hosts, or you can build a graph of host similarity. Using spectral clustering could provide an image that informs you about any structure in your hosts.
Anomaly detection and event classification with log data
There are ways to transform your log data into a time series. When you have a high volume of semi-structured strings, you can either count the messages or extract information from them. These logs are an approximate program-execution trace. As you cannot enter a debugger for your machines once they are in production, you can only infer the behaviour of your software through these log messages. If your program prints a string every time there a request times out, you can count the number of timeouts every hour. This gives you a time series, which you just learned how to analyse!
You might be tempted to set a threshold on the values of a certain time series. However, you don’t want to fool yourself into thinking that you’ve found an interesting event when that event was not actually interesting. Imagine that you have a super-accurate model, and you want to send an alert any time there is only a 0.01% chance for a pattern to occur. When you have a service with a million time series, you can expect about a hundred false positives. Baron Schwartz goes into more detail about what techniques you should use to determine a threshold in his talk “Why nobody cares about your anomaly detection”.
With all the recent advancements in deep learning, you might want to use it to help with predictions and anomaly detection but deep learning is still not able to free you from understanding a problem domain. You still have to find a way to frame your problems. One possible approach is the use of recurrent neural networks to forecast. This is a great idea if you happen to have access to a lot of training data. If not, however, your first priority should be aggregating data before trying to do something with it.
In conclusion, the rabbit hole of inspecting data goes very deep. We have machines that are running our lives. These machines produce data, but analysing the data is complicated so we go to machine learning tools, which are delicate. It is of great importance to prevent noise and false positives, and to do this, you have to make sure you understand what you are trying to do. Know why you are not using deterministic SQL-like analysis, and understand the methods you use on a math scale. Lastly, know if you are either automating the interpretation or transforming data into predictive residuals and using that for anomaly prediction.
About the Author
 Roland Meertens is a computer-vision engineer working in artificial intelligence for the perception side of self-driving vehicles at the Audi subsidiary Autonomous Intelligent Driving. he has worked on interesting things like neural machine translation, obstacle avoidance for small drones, and a social robot for elderly people. Besides putting news about machine learning on InfoQ, he sometimes publishes on his blog PinchofIntelligence and Twitter. In his spare time, he likes to run through the woods and participate in obstacle runs.
MMS • RSS
Article originally posted on InfoQ. Visit InfoQ
The human brain learns in many different ways, a training mode must fit the purpose and desired outcome. Practices from Training From the BACK of the Room! can be used to make training stick. Forcing big changes on people can be perceived as a threat; it’s better to create psychological safety, foster curiosity, and give feedback in ways that continue the dialogue instead of shutting down.
Jenny Tarwater, agile coach, spoke about brain-based training at the Agile Games conference 2018. InfoQ is covering this event with Q&As and articles.
InfoQ spoke with Tarwater about how the human brain learns, applying practices from Training From the BACK of the Room! and what teachers can do to make training stick, and how we can use insights from how the brain works and how people learn to coach people in their daily work.
InfoQ: How does the human brain learn?
Jenny Tarwater: That’s a big question! I’ll leave that one to the neuro-scientists to answer! I can speak to my own experience, both as a learner and a facilitator.
I focus on the desired outcome, as the mode for training should be deliberate. If I want to understand something conceptual, I may listen to an Audible book, podcast, or conference video. If it is something I’m interested in applying, I immerse myself in the learning more, usually through a classroom setting with others learners. If it is something I feel is a skill I will want to really embody, I try to teach it to others either informally via a conversation or formally via a Meetup, conference talk, or classroom.
I use the same thinking when designing a learning experience. I think about what the desired learning outcome is, and then the best way to create the space for that to occur. For example, if the learning outcome is “Recognize the twelve Agile Manifesto principles”, I’ll expose the learner to the concept and have them reword the principles. If the desired outcome is to “Determine if one of the Agile Manifesto principles is being applied”, I would include a more experiential element.
So how does the human brain learn? I think in many different ways. Having a fit for purpose experience is of critical importance.
InfoQ: At the agile games conference you practiced the 4Cs Map from Sharon Bowman’s Training From the BACK of the Room! Can you elaborate how this works?
Jenny Tarwater: The 4Cs Map is one of the two fundamental practices I learned from Sharon Bowman’s Training From the BACK of the Room! (TBR). It is an instructional design and delivery model that is easy to learn, remember and use. The 4Cs Map allows you to effectively arrange your material so that the learner isn’t just exposed to new information, but actually learns it. In my experience, a lot of trainers focus just on C2 – providing a lot of information to the learner. Weaving in the other three “Cs” is more effective. The 4Cs are:
C1 – Connection – What does the learner already know?
C2 – Concept – What does the learner need to know?
C3 – Concrete Practice – How can they demonstrate they know it?
C4 – Conclusion – How will they use it?
C1 ensures that there is something for the concept to connect to in the learner’s brain – existing neural routes that can be alerted for the new learning, and then strengthened. C3 gives the learner the opportunity to apply the concept right away. This may be as easy as a “Teach Back” – where the learners pair up and explain the concept to each other (because the person speaking is doing the most learning!). If possible though, C3 should be an actual demonstration of the new skill.
At Agile Games, for instance, I presented the concepts of 4C Map, Six Trumps, and a Game Design Canvas. I had the room break into groups and design a game that taught either the 4C Map or the Six Trumps. Boom – in just a short time, I knew the attendees had learned the concepts – because they actually demonstrated using them! Win!
Finally, 4C is conclusion – making the learning real. You give the learner the space to consider “How will they use it?” I especially like to focus on one very specific actionable item that I know they can complete and suggest they make an authentic commitment to doing so.
InfoQ: What can teachers do to make training “stick”?
Tarwater: The entire TBR approach, including the Six Trumps (brain-based principles), the 4Cs Map (Instructional Design Canvas), and the hundreds of sample activities are all meant to help make the learning stick. We talked about the 4Cs Map as a way to arrange material; let’s talk about six brain-based principles that should be incorporated into all steps of learning. The principles are:
- Movement over sitting
- Talking over listening
- Images over words
- Writing over reading
- Shorter over longer
- Different over same
My favorite is shorter over longer. You should keep segments to ten minutes or less. Our brains start tuning out very quickly, and so you must introduce change frequently. To avoid our brains habituating, we need to awaken the Reticular Activating System (RAS) via the principle different over same. But you don’t want to “startle” the learners, just change it up a bit. I like to think of these six principles as “spices” that you sprinkle on the 4Cs Map. You want enough that you have a lot of character, but not overwhelming!
I’m very appreciative of Sharon Bowman taking some very complex ideas from multiple neuroscience sources (and her own experience) and making those principles stick for me.
In the article The Neuroscience of Agile Leadership, Jenni Jepsen described how the way our brain works makes it difficult to adopt agile:
Change of any kind, including a change to working Agile, is perceived by the brain as extreme novelty. And we are hard-wired to resist change. The error detection systems in the brain light up when there is something new or unusual in your environment making us extremely resistant to change. And, if this error detection system fires too often, it brings on a constant state of anxiety or fear.
InfoQ: What’s your view on this, are people hardwired to resist change?
Tarwater: Evolutionarily, it was advantageous for us to follow patterns, and make predictions. This is a very good thing, as it helps us to identify and avoid danger and conserve brain energy! Conversely, uncertainty arouses the limbic system. Our freeze, fight or flight response comes from here – we experience an amygdala hijack.
I try to be respectful of this deep response to uncertainty, and try to avoid learners “downshifting” to that part of the brain. I try to honor the learner’s past instead of dismissing it. We go back and examine the assumptions that lead them to those pattern-based conclusions and work from there. Often, this incorporates double loop learning – where learners are not just learning new information, but questioning their own assumptions and beliefs.
InfoQ: How can we use insights from how the brain works and how people learn to coach people in their daily work?
Tarwater: We want to avoid “downshifting” into a state of hyperarousal. When we attempt big changes and force those on people, it can be perceived as a threat. So smaller changes, by invitation, with safe to fail experiments can help to create an environment that avoids an amygdala hijack! Here are some of my favorite techniques:
- Creating psychological safety for the learners. Some ways to do that? Have the learners connect with each other, and with me. I model being wrong – I love doing a “facilitation failure bow” with a group to demonstrate it is ok not to be perfect! I encourage respectful dissent and naming the elephants in the room. And I always spend time creating a “Working Agreement” with the group – having an explicit agreement on how to be together.
- Coming from a place of curiosity rather than judgement. You can never know the path someone else has taken – so knowing how they arrived at a conclusion can be very enlightening to their current thinking, and how a shift in thinking may be better received.
- Providing feedback in a very specific way. I try not to say “oh that’s wrong” or “that’s not the way it works”. I say things like “In my experience, I find….” or “Conventional wisdom might say…” This gives the learner the opportunity to continue the dialogue instead of shutting down.
MMS • RSS
Article originally posted on InfoQ. Visit InfoQ
Instana, provider of AI powered monitoring solutions for dynamic containerised microservice applications, announced at QCon New York the release of Stan’s Robot Shop, a sample microservice application that can be used as a sandbox to test and learn about microservice architecture, containerised application orchestration and automatic monitoring techniques.
Stan’s Robot Shop is a sample microservice application of an e-Commerce storefront and includes a product catalog, user repository, shopping cart and order pipeline. The technologies used to create this sample microservice application are: AngularJS (1.x), Nginx, NodeJS (Express), Java (Spark Java), Python (Flask), Golang, MongoDB, RabbitMQ, Redis and MySQL.
The key design consideration was to be small enough to run on a developer’s laptop but still have enough complexity to be interesting and not just a “Hello World” example. 2GB of memory is required to run ‘Stan’s Robot Ship’ using docker-compose or minikube/minishift. It can also be deployed to a cloud service that supports containers such as Google Compute, AWS ECS/EKS and OpenShift.
The web page is a Single Page Application written using AngularJS (1.x). Its resources are served by Nginx which also acts as a reverse proxy for the backend microservices. Those microservices are written in different languages using various frameworks, providing a wide range of example scenarios. MongoDB is used as the data store for the product catalogue and the registered users. MySQL is used for the look up of the shipping information. Redis is used to hold the active shopping carts. The order pipeline is processed via RabbitMQ.
The components required to build and run the application, along with the Instana monitoring components are available via a GitHub download. The Instana components provide instrumentation for end-to-end tracing and visibility into time series metrics for the included technologies. End user monitoring is included.
Once the ‘Stan’s Robot Shop’ application is installed, in order to see the application discovered and monitored with Instana an agent needs to be installed. The agent is not currently supported on Mac if the application is being run locally via docker-compose.
Load generation for the application is not started automatically but, by navigating around the shop with a browser, load is generated, clicks are captured and become available in the Instana dashboard. There is no load generation facility for the web application but there is a load generation utility for the microservices.
Instana is a supporter of open source and are members and contributors to a number of projects including: Open Tracing, Cloud Native Computing Foundation and Byte Buddy. The language sensors that the Instana agent uses are all open source on GitHub.
MMS • RSS
Article originally posted on InfoQ. Visit InfoQ
Google disclosed its root-cause analysis of an incident affecting a few of its Cloud services that increased error rates between 33% and 87% for about 32 minutes, along with the steps they will take to improve the platform performance and availability.
The incident affected customers of a number of Google services relying on Google HTTP(S) Load Balancer, including Google Kubernetes Engine, Google App Engine, Google Cloud Functions, Stackdriver’s web UI, Dialogflow and the Cloud Support Portal/API. Customers started to randomly receive 502 error codes or connection resets for about 32 minutes, the time it took Google engineers to deploy a fix from the moment Google monitoring system alerted them to the increased failure rates.
Google HTTP(S) Load Balancing aims to balance HTTP and HTTPS traffic across multiple backend instances and multiple regions. One of the benefits it provides is enabling the use of a single global IP address for a Cloud app, which greatly simplifies DNS setup. To achieve maximum performance during connection setup, the service utilize a first layer of Google Front Ends (GFE) as close as possible to clients anywhere in the world which receive requests and relay them to a second tier of GFEs. The second tier constitutes a global network of servers that actually sends the requests to the corresponding backends, regardless of the regions they are located in.
The root cause of the incident turned out to be an undetected bug in a new feature added to improve security and performance of the second GFE tier. The bug was triggered by a configuration change in the production environment enabling that feature and causing GFEs to randomly restart, with the consequent loss of service capacity while the servers where restarting.
Luckily, the feature containing the bug had not yet been put in service, so it was relatively easy for Google engineers to deploy a fix by reverting the configuration change, which led the service to return to its normal behaviour and failure rates after a few minutes of cache warm-up.
On the prevention front, besides improving the GFE test stack and adding more safeguards to prevent disabled features from being mistakenly put in service, Google Cloud team efforts will aim to improve isolation between different shards of GFE pools to reduce the scope of failures, and create a consolidated dashboard of all configuration changes for GFE pools, to make it easier for engineers to identify problematic changes to the system.
Read the full detail in Google’s official statement.
MMS • RSS
Article originally posted on InfoQ. Visit InfoQ
Fin Goulding, international CIO at Aviva, recently spoke at the DevOps Enterprise Summit London about using flow principles to advance agile capabilities throughout an organisation. InfoQ asked Goulding to expand on some of the points that he made during his talk:
InfoQ: You mentioned “ineffective offshoring” in your talk – in your experience, what causes an offshoring strategy to become ineffective and how can a CIO and their organisation right themselves if the partnership is struggling to operate as intended?
Fin Goulding: All too many companies treat their offshore suppliers as cheap staff augmentation and that in my humble opinion is a flawed strategy. I worked in Buenos Aires heading up an offshore division for a number of years and by far the most successful teams had end to end responsibility for delivery – including product ownership and production deployment. But that requires trust, minimum viable governance and a true partnership. However, one does need to find the right partner, give them a chance to prove their end to end capability and then scale appropriately.
InfoQ: You were open about your dislike for Scrum; how would you recommend organisations new to agile approaches embark on an evolution in this area without falling into the traps you believe Scrum lays?
Goulding: It’s not that I dislike Scrum, I just enjoy poking fun at it because I believe that it needs significant improvement and is likely to be fundamentally disrupted. But I must admit that my wife is an excellent scrum master and agile coach and we do have great debates! For me, the scope of Scrum (and DevOps to some extent) is too narrow and technology focused. Flow principles extend agile to the business teams and to customers and hence injects agility into the management of everything. However, to fully appreciate the latest agile techniques such as Flow, one needs to have experienced the Scrum methodology. But I would not recommend sheep dipping everyone in scaled frameworks or pushing your agile aspirations from the top down. Allow teams to self-manage, collaborate and improve to an optimal way of working. And for me, an excellent Agile Coach is worth their weight in gold but I would make sure that you hire someone with a broad range of skills including Scrum, Kanban, Flow and Value Management.
InfoQ: We heard a lot about being a learning organisation from various speakers at DOES, but lots of organisations find it hard to create the habit of embedding learning in their daily work. Do you have any advice on how to change behaviours so they can model your advice to have a learning mindset?
Goulding: Start with yourself. If your teams or colleagues see that you are continually learning via meetups, presenting various topics at conferences or blog writing, you will inspire them to follow. You must also take every issue that a team or individual faces as a learning opportunity and not as an opportunity to blame. Simple techniques such as capturing at a stand-up what the team has learned during the week, is a great sharing exercise. The sailboat retrospective is also a fun way to address even the most gnarly of issues to drive learning opportunities.
InfoQ:”Agile is dead. Long live agile?” – what should readers make of Ron Jeffries’ article?
Goulding: My interpretation of the articles by Ron, Dave Thomas and the other original authors of the Agile Manifesto, is that they believe that we have lost our agile north star. No longer are we being agile but we are buying agile, in terms of tools and frameworks devoid of continuous improvement. Hence when I talk about “Agile is dead” I focus on the bad aspects of today’s methodologies, roles, tools and leadership behaviours and show the advantages of cultural transformation which underpin Flow principles, the minimal framework for business agility. In fact, I have always said that within Flow, you can use any tools, methods or techniques you prefer as long as they result in valuable quality outcomes for your organisation. So, in my opinion, agile will survive because it has no choice but to pivot away from today’s constraints.
InfoQ: You mentioned you have a DevOps team. Some people think that having a DevOps team is an anti-pattern and that DevOps is everyone’s job – what’s your view on this?
Goulding: We have flow teams who use DevOps practices which is how things have evolved for me. You have to remember that DevOps is 10 years old now and its original objective was to resolve the issues between Developers and Operations. Today we are seeing DevOps expanded across a wider selection of business and technical teams which, is why I prefer the term ‘flow teams’ rather than DevOps or DevOps 2.0. And I fundamentally believe that these holistic teams will be at the heart of the most successful enterprises of the future.
InfoQ: A lot of organisations really struggle with getting any or the right metrics – you mentioned you only really care about lead time and cycle time. How did you come to that conclusion and how are these metrics made visible, shared and used?
Goulding: There are metrics which demonstrate where I can directly make improvements and then there are those whereby I cannot (such as conversion rates, NPS or profits) hence my focus on a small set of key measures. But there is also a danger that metrics are used to beat up teams or even worse individuals, due to productivity targets. My focus has always been on ensuring that work items or stories are uniform in size and hence problems in the flow of work can easily be identified for improvement. Maybe a new team member needs help or a story is too complex and needs simplification. Hence cycle and lead time will highlight this. But in my talk at DOES, I also emphasised wait time and this is the true productivity killer, sometimes leading to excessive context switching. I reckon that wait time between development and operations was one of the driving forces behind DevOps in the first place.
InfoQ: What should people do if they feel their leaders don’t understand DevOps and aren’t exhibiting the kind of behaviours (e.g. removal of blockers) we expect from them in the DevOps world?
Goulding: The Puppet Labs State of DevOps report is a very powerful source of information regarding what high performing organisations are doing and I would also recommend sharing with the leadership any Use Cases from similar organisations. Additionally, technical jargon, with no articulation of business value, can really hinder the adoption of DevOps and most of all leaders hate to admit that they don’t understand something, so it’s best to help them on the journey in order to gain support. However, be prepared for them to claim all the glory for a successful implementation! However, if you are in the middle of implementing DevOps, invite the leadership to a weekly stand-up and assign the blockers directly to them.
InfoQ: You mentioned comb-shaped people – how common are these do you think and is everyone capable of being a comb-shaped person?
Goulding: I’ve been pushing what I call the HR 2.0 agenda for a number of years and have spoken to many HR professionals about T-Shaped, Pi-Shaped and Comb-Shaped people. In the technology world, many individuals can design, code, build databases, test and deploy applications, so I wondered why has this evolved into separate job functions? Well, in many Enterprises, it’s become enshrined in the delineation of responsibilities and perhaps how many companies have tried to scale. However, I believe that due to new paradigms such as the gig economy, we will move away from single skill-sets and adopt a life of multiple trades. This, coupled with DevOps 2.0 or Flow Teams (the expansion of DevOps across a wider selection of Business and Technical teams) will make those individuals the most valuable people to hire. And guess what, you can grow comb-shaped professionals yourself if you are prepared to let them work outside of their traditional job descriptions.
In additional to being the international CIO at Aviva, Fin Goulding is also the co-author of ‘Flow – A Handbook for Change Makers, Mavericks, Innovation Activists and Leaders’, ’12 Steps to Flow: The New Framework for Business Agility’ and ‘From DevOps to Flow: Creating Teams That Win the Future’.