Month: September 2019

MMS • Bruno Couriol
Article originally posted on InfoQ. Visit InfoQ
James Stewart recently compared the incoming Vue 3 function-based Composition API to the current Vue 2.x class-based Options API. In a presentation held at the second Vue.js Glasgow meetup event, Stewart analyzed the code from the same application written with both APIs, and concluded that the Vue 3 API leads to better code structuring, and makes the isolation and composition of logic easier than before.
The Vue 3 Composition API departs from the current Vue 2 class-based API (termed as the Options API), and allows developers to encapsulate and reuse logic in functions, in a way similar to React Hooks, or Svelte 3. The initial reaction from the developer community included several criticisms of the new API. Some developers failed entirely to see what was the problem being solved by the API, others complained that the API changes would lead to spaghetti code. Stewart addressed those two criticisms in its presentation by comparing the same application written in Vue 2 and Vue 3.
Addressing the first criticism, Stewart explained that, in his view, hooks are smarter mixins. As a matter of fact, the Composition API and mixins pursue the same goal: encapsulate a set of functionalities for reuse in arbitrary component contexts. The Composition API, unlike mixins, allows not only to encapsulate logic but also to compose those pieces of encapsulated logic in an arbitrary manner. A piece of encapsulated logic can itself be built upon another piece of encapsulated logic, and combined within a Vue 3 component to form the desired behaviour of the component.
With respect to the second presented criticism, Stewart also concluded, based on his code example, that organizing logic away from options (as in the Options API) and into functional blocs (as in the Composition API) may be more readable, by forming cohesive groups of logic. He gives the following illustration, assigning colors to code parts according to the functionalities they participate in:
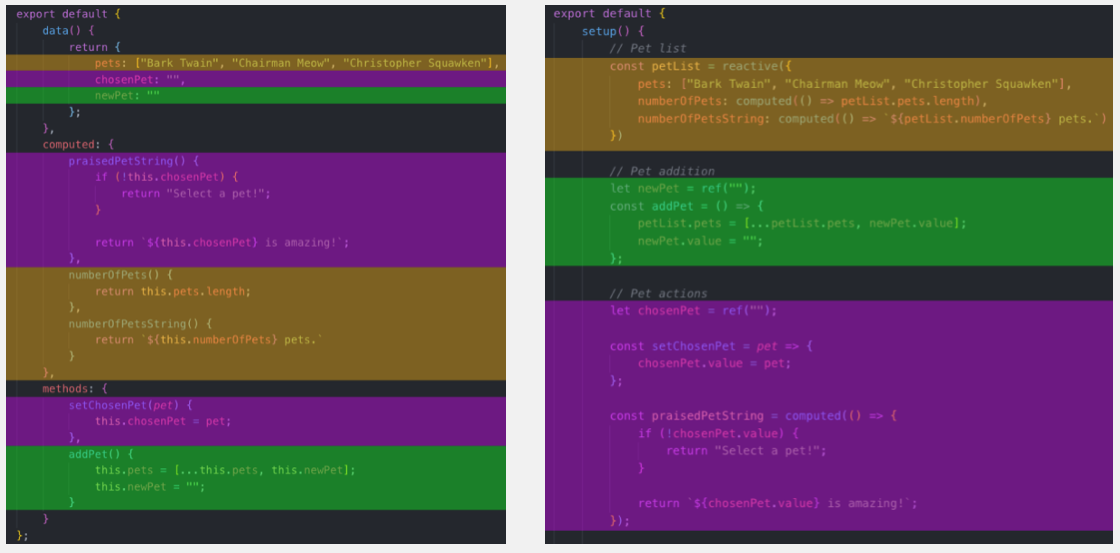
The first colored code sample on the left uses the Options API (featuring data, methods and computed properties on the Vue component instance). The second colored code sample on the right uses the proposed Vue 3’s Composition API and exposes a single setup function which neatly groups: the source of truth for component data and the variables derived from it (Pet list); the Pet addition logic; and the Pet actions logic. The source codes for the example is available in a dedicated GitHub repository.
The official documentation for the Composition API includes a larger example taken from the Vue CLI UI file explorer and reviews in detail how the Composition API affects code organization, with positive and negative implications.
In January of this year, Evan You, Vue’s creator, previewed Vue 3.0, the next major iteration for the Vue.js progressive JavaScript framework. The Vue 3.0 focused heavily on performance improvements (smaller size of the core, tree-shaking, optimized slots generation, hoisting and inlining, and more). The early preview quickly mentioned in passing the experimental Vue Hooks API. which Sarah Drasner detailed in an article later in February this year.
Later, in June, the experimental Vue Hooks was refined into the Vue Function API and then, in August, further refined and renamed to Vue Composition API, after several nomenclature changes. Rather than using the term hooks, the official Composition API documentation favours the term composition function.
The Composition API is purely additive and does not affect / deprecate any existing 2.x APIs. It has been made available as a 2.x plugin via the @vue/composition library. The library’s primary goal is to provide a way to experiment with the API and to collect feedback. The Vue Composition API remains a work in progress and is subject to future changes till the official release of Vue 3.0. The Composition API will be shipped as built-in in Vue 3.0 and will be usable alongside existing 2.x options.
Vue.js is available under the MIT open-source license. Contributions are welcome via the Vue.js GitHub package and should follow the Vue.js contribution guidelines.
MMS • Hrishikesh Barua
Article originally posted on InfoQ. Visit InfoQ
At the recent Strange Loop conference, Robert Fernandes, Engineering Manager at Netflix, who leads the Open Connect Tools team, gave a talk on how they manage operations for Netflix’s in-house OpenConnect content delivery network (CDN).
The talk is a summary of Netflix’s move to their in-house CDN – Open Connect – and the challenges it brought for their operations teams. The Open Connect team is the umbrella term for teams that handle content delivery to subscribers – including technical operations, inventory management and partner management. The need to automate these activities was strongly felt and various monolithic applications were built by different teams. This brought on new challenges for deployment. Fernandes talks about how they plan to mitigate these challenges.
Most Netflix services run on AWS. Netflix started streaming services in 2007 and by 2009 had built an internal control center called Netflix Content Control Plane (NCCP). NCCP’s job was to steer the end user to the right edge (CDN location) whereas the actual content delivery was done by third party providers like Akamai, Level 3 Communications, and Limelight Networks. The team moved to an internal CDN in 2011, calling it Open Connect, and with it came the entire job of managing the infrastructure.
When a Netflix application client (mobile, desktop etc) requests a video, it typically receives 3 domain names from which the client requests the content via HTTPS. OpenConnect serves the content and any static resources used by the application, like Javascript. The CDN is built with customized servers called Open Connect Appliances (OCA) which are cache servers. They run on a custom fork of FreeBSD with nginx. Two kinds of cache servers are configured. A storage appliance stores catalogs in bulk, on HDDs, which are relatively slower. The flash-based or “offload” server has solid state drives and comparatively higher throughput, and is mostly used for serving popular content. Netflix content servers – over 10k appliances – are deployed across 1000s of sites globally. Some sites are handled by ISPs with servers provided by Netflix, whereas in others Netflix directly controls and manages the hardware. This architecture is complemented by Netflix’s backbone network.
The Open Connect teams are split into development, operations, network management and non-technical functions like partner management and shipping. The teams started by solving problems within their own verticals – which led to monolithic applications. The Open Connect Tools team was formed to mitigate this. It takes care of alerting, monitoring, config management, deployment automation, inventory management, logging and metrics, and partner self service. The team working on the control plane focuses more on the content placement, geographical aspects, routing and security of the CDN. The talk does not not delve much into technical details of the applications or of the automation. The future plan is to have a more “layered approach” with microservices, and have common solutions that can be shared across teams.
Article: The Why, How, and What of Three Industry-Oriented IoT Projects: Highlights from WebExpo 2019
MMS • Bruno Couriol Tomas Morava
Article originally posted on InfoQ. Visit InfoQ

Tomáš Morava, CFO and co-founder at Hardwario, recently presented at WebExpo 2019 in Prague three practical, industry-oriented applications of IoT in the automotive and agriculture sectors. Morava illustrated at length in an interview with InfoQ how deploying the Internet of Things in the industry need not be complicated nor expensive.
By Bruno Couriol, Tomáš Morava
MMS • Arthur Casals
Article originally posted on InfoQ. Visit InfoQ
At the 2019 edition of .NET Conf, streamed online earlier this week, Microsoft announced several new features for the .NET ecosystem. .NET Core, ASP.NET, and EF Core 3.0 were released, together with C# 8.0 and F# 4.7. The new releases have a considerable impact on how Windows Desktop, Web, and Mobile applications are developed. New features and tools for Visual Studio (VS) 2019 were also showcased, with emphasis on a new visual modeling tool for machine learning called Model Builder.
The conference started with an overview of the new features being released. During the opening keynote, Scott Hunter, director of program management for the .NET team at Microsoft, talked about the growing adoption rate of .NET Core. He stressed how the .NET Core development is aligned with the community, pointing out the number of pull requests on .NET Core repositories since the platform and related libraries was open-sourced (more than 100 thousand). This introduction set the context for the announcement of the new features and tools, all revolving around how different applications can be built in different scenarios. He then moved to an interactive, cumulative hands-on session covering the main topics discussed in the next sessions.
Each of the topics covered in the keynote was presented by a different speaker, all chaired by Scott Hunter. The hands-on session started with the creation of a weather forecasting microservice, showing some of the new features of C# 8.0 (async streams, nullable reference types, and code patterns), .NET Core 3.0 (the new JSON APIs), and Visual Studio 2019 (new gRPC service references). The following topic was focused solely on the new C# async streams, showing how to work with async loops and endpoints.
Next came the application topics, showing how the microservice created could be consumed in different manners. It started with the creation of a Windows Desktop application using .NET Core Windows Forms. The purpose of this presentation was to show how existing desktop applications could be ported to .NET Core 3.0 and to demonstrate one of the most important functionalities of this release: the ability to deploy desktop applications as self-contained executable files. The Xamarin demo followed the same format, showing how the mobile version of the application could be rapidly tested using the new hot reload/restart functionalities (which allow the developer to change the application code while it is still running).
Still during the opening keynote, the new ASP.NET functionalities were shown with the creation of a Blazor application. The highlight of this topic was the new Blazor WebAssembly template available in the newest version of Visual Studio 2019. A demonstration of how to visually create and embed machine learning models into the application with ML.NET followed, and the hands-on session was finalized with a show-and-tell involving the IoT devices (since the latest release of .NET Core includes support for Linux ARM64).
The three-day the conference was divided in: sessions broadcast from Microsoft studios (first and second days) and community sessions in local time zones around the world (third day), from 9am to 5pm. All sessions were technical, revolving around the main points presented during the hands-on demonstration. In particular, the sessions following the opening keynote (first day) were more complete, detailed versions of the demonstration topics.
There were other sessions, however, showcasing tools and features announced earlier this year on Microsoft’s development blog and that are not related to the Core 3.0 release, such as integrating Apache Spark with .NET and building interactive documentation with Try.NET. Other sessions also cover: .NET Standard, new features in F#, using GraphQL in .NET Core, mobile and game development in .NET, DevOps tools, and performance and security topics.
The key takeaway of the conference was how the .NET development ecosystem is being consolidated around .NET Core. This should come as no surprise since earlier this year Microsoft announced that .NET Core is the future of .NET. If the schedule stays unchanged, .NET 5.0 release is expected in November 2020. Microsoft is announcing .NET 5 as a unifying platform for desktop, Web, cloud, mobile, gaming, IoT, and AI applications, also featuring Java, Objective-C, and Swift interoperability on multiple operating systems.
While the vast majority of the demonstrations was done using VS 2019 for Windows, it is important to notice that they are available on multiple operating systems (depending on the tool, library, or platform). Using VS 2019 for Windows is to be expected considering that support for developing Windows Desktop applications was one of the most important features of .NET Core 3.0. However, .NET Core 3.0 is supported on Windows 7+, Windows Server 2012 R2 SP1+, macOS 10.13+, and different Linux distributions. ML.NET also comes with command-line tools for multiple operating systems, and VS Code supports Blazor development. Recordings of all the conference sessions are available in a curated playlist on YouTube.
MMS • Ben Linders Gary Gruver
Article originally posted on InfoQ. Visit InfoQ
![]()
The book Engineering the Digital Transformation by Gary Gruver provides a systematic approach for doing continuous improvement in organizations. He explores how we can leverage and modify engineering and manufacturing practices to address the unique characteristics and capabilities of software development.
By Ben Linders, Gary Gruver
MMS • Ben Linders
Article originally posted on InfoQ. Visit InfoQ
Micro inequities, small events based on subtle unintentional biases, are pervasive and can lead to discriminatory behaviour, both negative and positive, argued Coral Movasseli in her session at Women in Tech Dublin 2019. The good news is that behaviour containing micro-inequities is malleable through counter-stereotypic training, intergroup contact, and by taking the perspective of others.
Movasseli explained that micro-inequities is a term coined by Mary Rowe in 1973 which describes “apparently small events which are often ephemeral and hard-to-prove, events which are covert, often unintentional, frequently unrecognized by the perpetrator, which occur wherever people are perceived to be different.” They are based on subconscious or implicit biases that then form our thoughts, behaviours, and habits – and no one is immune, as we all hold pervasive biases, she said.
These events can take the form of microaggressions – which are everyday insults and disrespect that people of minority backgrounds typically deal with, said Movasseli. Examples of microinequities include constantly mispronouncing someone’s name, not making eye contact with females in the room, and confusing someone’s ethnicity for another, amongst many others.
For the individual who is on the receiving end, the best thing to do is to recognize micro-inequities, label them, and hold people accountable. The response should not be impulsive and reactionary, but rather slow and controlled, said Movasseli.
If we witness micro-inequities in teams, it’s important to recognize what happened, label it, and console the individual receiving the micro-inequities and check in on them to make sure they are ok. Movasseli mentioned that we should be cognizant that they just experienced a very painful and traumatic event that will stay with them.
InfoQ spoke with Coral Movasseli, managing director at Girls in Tech Dublin, after her talk at Women in Tech Dublin 2019.
InfoQ: What is the impact of micro-inequities on the individual and in companies?
Coral Movasseli: These incidents have serious cumulative negative impact on the person receiving the insults. Because of their subtle nature, they leave the person confused and angry, as well as ultimately in a catch-22 as the perpetrator doesn’t realise they are doing it, nor do they have bad intentions behind it, so if confronted they will simply deny it.
The individual will then feel as if they don’t belong or they are abnormal or untrustworthy. Moreover, if they are from a minority group, they will feel pressure to avoid making any mistakes due to fear of presenting their “group” in a bad light.
The long term impact can include lower self-esteem and confidence, mental health issues, or serious substance abuse.
In the workplace, it can lead to lower work performance and a toxic workplace.
InfoQ: How can we deal with micro-inequities?
Movasseli: We should hold people accountable and react in a controlled way. For example, if someone comments, “Wow your English is so good for a [insert ethnic minority nationality],” recognize this is not an ordinary exchange and label it as a micro-inequity, then respond with a comeback that educates them and also disarms them, such as by responding, “I am from here”.
Formulating the right language in your response is very important, but challenging as usually we are not armed with the right way or words to react to such situations. Another challenge is that it could come from very well-intentioned people who are very unaware of what they are saying. Thereby, many times people will impulsively respond to micro-inequities or micro aggressions with a reactionary response that doesn’t leave them in control of the situation. Onlookers will also not be aware of the subtlety of the aggressions that they view the response as not proportional.
In the workplace and in society, it’s important that leaders build awareness and educate people on what micro-inequities are, how they’re harmful, and what you can do about them. This can even take the form of including workplace unconscious bias training, meditation/mindfulness exercises, and empathy training.
We can all also practise micro-affirmations, which are “small acts, which are often ephemeral and hard-to-see, often unconscious efforts to help others succeed”. This includes, for example, recognizing people’s achievements, rewarding positive behaviours, intentionally including people in workplace networks – and any other acts that help people thrive and feel empowered.
InfoQ: If people want to learn more about micro-inequities, where can they go?
Movasseli: They can continue to educate themselves about it. I can recommend a very good book on the subject by Mahzarin Banaji and Anthony G. Greenwald called Blindspot: Hidden Biases of Good People. People can also take the implicit bias test online.
MMS • Dylan Schiemann
Article originally posted on InfoQ. Visit InfoQ
The recent Storybook 5.2 release delivers a new approach for generating design system documentation. Storybook 5.2 streamlines component documentation to make best practice documentation easier for anyone creating Storybook projects.
Storybook 5.2 introduces three main approaches for improving design system documentation:
As explained by Michael Shilman, a core member of the Storybook team:
The centerpiece of 5.2 is DocsPage, a zero-config template for auto-generating best-practice component documentation from your existing stories.
Storybook strives to enable the development of UI components in isolation. The normal Storybook workflow has developers build stories to capture the key states of a component without focusing on complex dependencies or APIs. DocsPage then leverages these existing stories to generate documentation. These stories are executable, testable, and remain in sync with production code, keeping documentation in sync with the codebase. DocsPage inputs stories, combines the stories with code comments and property tables for the component, generating documentation pages.
MDX extends DocsPage to allow authoring stories and long-form documentation in the same file, typically an ES module. MDX combines markdown syntax with JSX, allowing developers to configure component documentation with arbitrary content and layout. MDX also provides a library of Doc Blocks to save time with common documentation tasks like displaying component properties.
To make MDX stories possible, Storybook revamped their story format. Component Story Format (CSF) provides a portable approach for authoring Storybook stories as ES6 modules. Higher-level formats like MDX or Github-flavored Markdown (GFM) can get compiled into CSF, allowing the Storybook community flexibility in how to author stories while retaining compatibility with the Storybook ecosystem.
Beyond the improved approach to generating documentation, Storybook 5.2 improves its addon APIs with a React hooks-inspired API, improves its TypeScript support with bundled Typescript types for most packages, adds support for React hooks, provides an experimental version of Storybook that leverages Parcel rather than webpack, and adds additional Storybook preset configurations.
Storybook is available under the MIT open-source license. Contributions are welcome via the Storybook GitHub project and should follow Storybook’s contribution guidelines and code of conduct.
MMS • Erik Costlow
Article originally posted on InfoQ. Visit InfoQ
AdoptOpenJDK has publicly released a suite of tests designed to ensure functional correctness, performance, and overall efficacy of each AdoptOpenJDK release.
The AdoptOpenJDK Quality Assurance (AQA) aims to make the release more in line with expectations of enterprise customers, providing a consistent location for organizations looking to remain up to date on Java without cost. While Java is free, the Oracle JRE became a commercial product requiring a commercial license since Java 11. Users seeking to avoid this clearly-communicated and frequently-publicized change have sought alternative JREs, such as AdoptOpenJDK or the public GPL builds — both of which are available at no cost.
While AdoptOpenJDK provides a full and complete build of the OpenJDK source code, this new quality assurance program provides more comprehensive validation beyond the Java Compatibility Kit (JCK). In addition to basic conformance testing, the tests include more details on performance, security, and scalability. For example in April, the Java version provided by Docker was functionally compatible but did not contain a series of security patches that left it functionally compatible with several exploits.
The first iteration of AQA provides over 30,000 tests, most of which are small enough to run on a developer laptop. Some “special” tests are excluded in the event that they need special hardware, such as multi-byte character sets. The compactness of tests is intended to encourage those working on OpenJDK to run tests before commit, rather than requiring those tests to be run by a continuous integration server. The special tests aim to detect issues that require unique configuration or hardware, such as the 2008 character-encoding issue in Turkey that resulted in a murder/suicide.
The AQA also features a series of performance tests that stress systems, to ensure that each release retains good performance. Unlike SpecJBB and Renaissance, which aim to compare performance between different Java implementations, the AQA tests are self-referential and designed to prevent regressions where a release could become slower or consume additional resources. The AQA Jenkins test suite provides status of successful runs, where successful runs of this test take 15 minutes or under. Tests include custom benchmarks as well as incorporating performance tests from popular open source projects like Kafka and Jerry. This expands coverage to prevent issues where the JDK may run its own test faster but inadvertently cause a slowdown in other projects.
While most Java users will not interact directly with the AQA, the impact will be felt more downstream by those that download an AdoptOpenJDK binary.
Presentation: A Look at the Methods to Detect and Try to Remove Bias in Machine Learning Models
MMS • Thierry Silbermann
Article originally posted on InfoQ. Visit InfoQ
Transcript
Silberman: At NewBank we like to be data driven, we collect a lot of data. Annually, we ask our customers to allow us to collect this data. The thing is, we have a lot of personal information, as a credit card company, we have information on how you use the app. If you are allowing the GPS data, we know where you are, when you do a purchase, we have all those informations. Today, if you think about it, there are two important issues that are starting to raise as you collect this massive amount of data. The first one is privacy and the second one is, usually all the companies are going to use your data to make some decision about you. Here, we are not going to talk much about the privacy but more about, how can we, as a company, make sure that we are not discriminating anyone and we are treating fairly all the customers that we have.
Fairness
As a bit of the history, this is a real graph in a sense that those bars represent the real amount of paper that were published up to 2017, I didn’t update it. You can see that at the beginning, everyone was, “Well we don’t have that much data, fairness is not really a concern for us. We may just use the small datasets, we have just a statistic.” Then at some point you are, “Google is amassing this huge amount of data.” There is a lot of value in collecting all these data. Now, there are a lot of people thinking that there is something happening. We need to do a bit more research on fairness because that’s something that is impacting a lot of people. Why is it impacting a lot of people? Today, the way we are doing business, is really changing compared 10, 20 years ago. 20 years ago, you might have just gone to some merchant to be able to get lending. Even in hiring, you just talk to people, the person in front of you don’t really know you, the only thing he knows is maybe your resume. Today, you are asking again this customer to give you a lot of information.
For hiring, some companies are going to go on Facebook and start to look at what kind of picture do you have there. Then you are going to say, “I don’t really want this company to know that last Saturday I went drinking. It has nothing to do with the fact I can be a good customer or not.” Here, what we have is a lot of different area mortgage lending, even prison sentencing. You see a miniature report or trying to predict in advance what people are going to do and to be able to stop a crime before even it happens. The thing is, in those examples and especially if we take the prison sentencing, you are putting the life of people on the line. It’s like you are going to say if this person is going to spend 2 years, 5 years, 10 years in prison and it has a really big impact on the life of someone. I’d like to know the level here, like in the case of NewBank, issues usually are more related to, “Should we approve our customers? Should we increase the credit line of someone?”
This is at another level also impacting the life of someone, because at NewBank, we really want to improve the life of our customers by giving them the best credit line so they can have access to credit and they can be able to pay the bills, they are able to do stuff that they couldn’t do before.
Here are some interesting papers that compile all those kind of different definitions of fairness, so, you will see in this presentation a lot of different metrics, different way you can compute that. This is a good representation, a good summary of everything that you can see. Here, there are like 20 – usually, there are around 20, 21 definitions of fairness. Something that is interesting is, it’s impossible to satisfy all those definitions. In some sense, even if you want to be the good guy and you want to make sure you are biasing your customer, in some way you will always bias some part of your population. It’s going to be pretty hard and what I want to pass as a message is this fact that we can try. It’s going to be hard, we are not maybe going to succeed for all the customer, but the thing is, if you don’t try, it means that you are not going to do a good job. As a data scientist, you have this responsibility to make sure that you are being fair with the customer that you have.
If you look at the second point, you can see that the research is very active. We have all conferences that are being created just on fairness, on ethics, on transparency, for example. Today, there is no clear metric, so that we can say, “This is the metric that everyone should use because depending of who you are and what you are doing is going to be really different.” It depend of what you are going to do.
Example: Prison Sentencing
Let’s take this example of prison sentencing. For those who don’t know what is this square, in machine learning it would look like a confusion metrics. If you look here on this line, what you’ll have is usually people that you are labeling, you are predicting that those people are going to be of low risk. You did something and you are going to get all these data about who is this person, maybe you know his gender, where he is coming from, what was the crime he did, if he did some other crime before or not. Then you are going to label this person as either low risk or high risk. What is going to happen is, you are going to take the decision of, am I going to send him to prison? Am I going to keep him inside society? Usually, after some point is, maybe you’ve said, “Ok, I’m going to look at this person back after one year.” After one year you are going to see, “Did this person did a crime again?” He recidivated or maybe he didn’t do anything. Then, depending of what happen, if he was labelled high risk and he recidivates, then you were right, so it’s a true positive. If he was labeled high risk, saying he didn’t recidivate, it was a false positive – you made the action but in fact, the guy didn’t do anything. We are going to take that, and we are going to see that depending of who you are, the definition of fairness is going to be really different.
Let’s say you are a decision maker and what you really care is, you just want to put the high-risk people into prison because those are the most dangerous people and that’s the only thing you want. What you will care about is only this column of high-risk people. Then, if you are a defendant, what you care is, you don’t want to put an innocent person in jail. What we are going to care is all those people that did not recidivate, and if you already model labeled them as low-risk or high-risk, that’s what you care about.
Then you have society, what we really want is to be fair with everyone. We don’t want to put bad people in jail, but we also we want to make sure that, all the really bad people are going to jail. You have to figure out how to satisfy everyone.
This is taken from Wikipedia. Here, this small square that you see here is the confusion matrix, as you can see, you can create 18 scores. You can look at true positive value, you can look at true negative and then there is everything derived from that. You can look at false positive rates, specificity, prevalence, accuracy. Each of those scores is something that you care about and that can be useful for maybe the decision you are taking.
Terminology
Before we continue, in this field of fairness, as you saw, there’s a terminology that you need to understand a bit to be able to read all those papers. The first one is what we call favorable label – usually there’s a label or a target if you are doing modelling, it’s providing the advantage to someone. In some sense here, what we are trying to do is being hired or not being arrested or even receiving a loan or being accepted at NewBank.
Then you have protected attribute. Usually this attribute is the thing that you want to make sure you are not discriminating people on. Here, we might talk about race, we might talk about gender, religion, there are a lot of different ways. What’s interesting is usually depending of what you are working on. Some of them might not even be discriminatory because you really want to make sure that for maybe some specific position – I cannot think of one right now – you only want a male, for example, or a female. In some sense, protective attribute is not universal and it’s going to be very specific to the application that you are going to use.
The privileged value – when you look at the protective attribute, if you look at race, gender, and religion, if you look at race, privileged value is going to be if you are white, and the unprivileged is going to be if you are black. For gender is, if you are male or if you are female.
Then you have group fairness, and here usually the goal is to make sure that each of the groups that you have in those protective attribute are treated in the same way. You’re not giving an advantage to one group compared to the others.
Individual fairness is usually to make sure that similar individuals are going to get the same kind of output treatment from the model that you just built.
Bias is what we are going to talk today. It’s like the systematic error, we get data but this data was generated by humans before. Usually, what’s happening is, humans are usually fabling, we can make bad decisions or just decision based on, say, this morning I woke and I felt that it wasn’t a good day. I’m going to talk to all those people and I’m going to hire and maybe the whole day I’m going to really hate everyone even if the guys are good, I’m just going to say, “You’re going to be disqualified.” At the end, it wasn’t based on anything from data but just on your feelings. That’s what we want to remove from the system.
We can say if we’re doing a good job or not removing this bias, by looking at some metrics. We are going to talk about fairness metric. Usually it’s just going to be some metrics that are going to quantify how much we are being bias or we are being unfair to some specific group of people.
One of the solutions we are going to talk about is what we call bias mitigation algorithm. The goal is, at some point, you can leave this room and just say, “Ok, there is still hope. Maybe I can do something about all the data that I have.” By the end of this whole process, my prediction is going to be fair with a bunch of people. But wait, there is this issue. It’s like you are telling yourself “I’ve been here before and I know that it is always not good to discriminate between gender, race or even religion.” I am just removing every feature like race and gender, so I’m being fair. The future is not here, you cannot tell me I’m being unfair because I’m not even using it. Usually, that’s not really a good argument, you can see it here. If you don’t know it, it’s a map of the Chicago area. Here in the middle, is going to be the center of Chicago, it’s usually the financial district, so you don’t have much people living here. Then you see all around are the different neighborhoods and every point that you see, it’s going to be a person. Here you can see that most of those neighborhoods are already discriminatory against people. Here you can see that usually, in the north of Chicago is well known that is mostly white population living there. In the south of Chicago is usually the black population. In the West is usually the Hispanic and black population also.
Let’s say you are doing some analysis and you are saying, “I’m removing the race of someone,” but I’m a credit card company. At some point, I need to send a credit card to someone, so I would like to get the address of this person. Then you are maybe a data scientist, you’re thinking, “It’s been a while since my model is stuck in this prediction and it’s not doing that good.” Maybe what I can do is have all those geolocation data about people and use it, and I’m pretty sure I’m going to get some pretty good bump in my model.
What you can see here is, you are not using gender, but there is this huge segregation that you can see. This random forest is going to be pretty good to just separate here and say, “All those people south of here are going to be some population. Some people between here and here are going to be another population.” In fact, your model is going to learn where people are living and at the end of the day, it’s just going to learn what was the race of the people living in this neighborhood, which is pretty bad.
Fairness Metric
Let’s go back to some of that fairness metric. This is confusion matrix, usually, it’s the easiest way to do stuff when you are doing some analysis. You might have all those different metrics, I’m not going to explain to you everything but those are true positive, false positive, true negative, false negative and you have all of that. Then you can have a fancier metric, like difference of mean, disparate impact, statistical parity, odd ratio, consistency, generalized entropy Index. Let’s take some of them.
If we talk about statistical parity difference, you can find in the literature some of those names. Group fairness is equal acceptance rates, or even benchmarking. What you want to do here is, you want to look at the prediction that you have at the end. Let’s say that you are hiring, you are going to filter everything, like every people that you hired and you are going to look at the probability of the people that you hired and from the group that you want to control, let’s say here is the gender. Those probabilities are going to be the same or at least like pretty close to each other because if you a have really huge difference, it means that there is something wrong that you are doing and then you need to kind of unbias this data. At the end of the day, your model that you are training is going to be unbiased and you are going to make better decision for those group of people.
The other one is, what we call the disparate impact. A lot of them are just a byproduct of this confusion matrix. Let’s say you have your predicted values and let’s say here is going to be your true group. It can be either you are male or female and you are going to see what is the difference between those different ratio. Usually, there is this really funny 80% rule, where if you are doing the ratio between one of the group between the other group, what you want to do in some sense, is you want to have this 80% rule where the difference between those two group in some ratio should be always above or equal to 80%. We have that because it’s the rule that happened in the 1970 in the U.S., when people used to hire in some company, make sure that you weren’t discriminating against maybe gender or maybe against some race. You had to make sure that if you computed this ratio on the group that you were hiring, this ratio should always be above 80%.
There is usually some libraries and I am going to talk about them just a bit later. Aequitas is one of them and usually, they have this approach where they just give you this tree, “You want to make a decision, let’s go through this tree where the first story is, do you want to be fair based on disparate representation or based on disparate errors of your system?” Then you choose, “I am caring more about representation,” or “I care about the errors.” Then let’s say I’m caring more about representation.
Then, “Do you need to select an equal number of people from each group or proportional to their percentage in the overall population?” Let’s say here, what we care about is the proportional because, let’s say, we have this problem in DataSense where I am doing hiring and in hiring usually, the number of resumes I get from female candidates is going to be way lower than male candidates. Usually, it’s just because in the population of people doing study in the area of DataSense, machine learning, you have this really imbalance where you have more men than women. Here, what I want is to select the number of resumes I have and usually, I have only 50% of those resume that are from female members. What I want to do is, to be really fair and have 50/50 but it’s going to be really hard for me because in some sense, my proportion inside the population is only 50%. What I would want to do is I would want to care about the proportionally and not have an equal number. Here, at the end of the day what I want is ook at this metric which is proportional parity. What we called this before is the disparate impact. If I look at the ratio, I should have this ratio of 80%.
How About Some Solutions?
How about some solution? So far, I talked about the metric, I talked about how you can know if your dataset is biased but what you care about is, if I know it like, “How can I do? What can I do to change it and to be able to be a bit fairer with people?” You can use some disparate impact remover, do some relabelling, learning fair representation or maybe you can do reject option classification or adversarial debiasing, or maybe you can do reweighing or additive counterfactually fair estimator. You have a lot of them.
Usually at the end of the day I advise you to not just re-implement everything because it’s going to be really hard. Today in DataSense, you have all those really good libraries and this is a list of libraries that are available, I think it’s pretty extensive. It really is the main one with the libraries that are a bit more popular. Here, the one I put in red is usually the one I tested and I feel that they are pretty good in what they are doing. Most of them are important. If you’re using a tool like scikit-learn, there is some kind of compatibility. One of the tools I am going to talk about is AIF360, which is a tool from IBM. What’s interesting with this tool is, it is compatible with scikit-learn. It’s based on the parading of transform, fit and predict. It’s really easier to just incorporate a pipeline that you might have and to just have this whole pipeline running and to be able, at the end of your prediction, to have some fair prediction.
Let’s go back to some solutions. How can we fix this prediction? Something that is really interesting in how we can do that is, there are three ways to do it. As you know, usually when you are building models, there are three steps that you might have. The first step is, you have to boost your dataset, when you are building your datasets, what you can do is you can already have a step where all these datasets, before even you train the model, you are going to do some changes that are going to make this dataset a bit better when you will fit it to your algorithm, so t’s going to be a bit more fair.
Then you have in-processing. In-processing is, you are going to look directly at the model you are going to choose. In this model you are going to make some transformation. The way it learns on your data is going to be, again, fairer than if you didn’t do anything here. Then, after you train your model, you have your predictions and here is one more time where you have the possibility to look at those predictions and to be able to do some transformations on those predictions to be fairer on people.
There is this diagram that is pretty cool, I have taken it also from the AIF360 paper. Like everything, you will start from raw data, then you have your original datasets. If you know the good practices in building model, usually you have to get a training set, a validation set and testing sets. Then from here, you have three different paths that we talked about before. One can be the pre-processing, what you are going to do is, you are going to take these original datasets. You are going to pass it through this function method that you have and then you will have this transform dataset that is usually a bit better to feed inside your classifier. Then at the end what you will end up with is a fair predicted dataset.
Otherwise, we go back, you have raw data, you do your different splits and what you can do is, you can put it inside a fair classifier. This fair classifier is going to do the work and I am going to explain a bit of each of those after that. Same thing, you do the fair in-processing and then you will end up with a fair predicted date set. Or the last point, again, you go back to original datasets, do the splits, you go there, and you put in, select the classifier. You have your predictive datasets. You do some post-processing and then you end up again with a fair predicted dataset.
Pre-Processing, In-Processing and Post-Processing
There are different methods we can use to do that. In pre-processing, the most well known in the field is really reweighing. Usually, you have your training sets and the only thing you do is, you are saying that each of the samples that you have in this training set is going to have different weight. Usually, those weights are going to be chosen relative to what you usually care about. Let’s say you have under-representation of women in some datasets, you are going to just put this weights higher than usual and it’s going to reduce the weight for all the male in the same way.
Then you have optimized pre-processing. Here, what you are going to do is, you are going to learn probabilistic transformation. They are just going to change the feature that you have inside your datasets. Then here you might have something else that we call learning fair representation. Here, something related is if you are doing embedding – you might say that, “I don’t want to be able to look at my data. I’m just going to feed this data inside some embedding and the embedding I’m going to create are going to be just numbers that are going to represent my data, so I can still learn from stuff on top of that, but the way I’m constricting this embedding is going to make sure that I cannot recover the predicted value that I had before, which can be gender, religion, race.
The last one is what we call the disparate impact remover. The second one here, what we want to do is we want to edit the features, just to make sure that we increase the group fairness and preserve some rank-ordering that we might have in some of the group that we have.
The second one is In-Processing, here we have to touch the model. The two main ways you can do that, is usually in adversarial method. If you know about GAN, which is Generative Adversarial Network, what you are going to do is, you are going to two models. The first one is going to learn your data and the second one is going to learn on the prediction of your first model. You can also learn the prediction of the predicted value that you had before. What you want to do is you want to make sure that at some point, the second model is not able to differentiate any more on the predicted value that you had before.
Then you have here a prejudice remover. Here, what’s interesting is, you just take the model that you have and other regularization that you might have when you have overfeeding and you want to do some regularization. You can have a term at the end of the formula that you wanted to optimize and this term is just going to be a term that is making sure that you are not going to discriminate against the predicted value that you had before.
Then you have the post-processing. You went all the way through, you have your prediction again and there is those three methods usually that you have, which is equalized odds post-processing. Here, you want to solve linear program to find some probabilities. If you change the output, you are optimizing some the metric that is equalized odds. Then you have calibrated equalized odds post-processing. Again, you want to calibrate the score that you have at the end, just to make sure that this metric is optimized.
The last one is reject option classification. It gives favorable outcomes to the unprivileged group and unfavorable outcome of the privileged group are in some confidence band that you usually have. I just want to make sure that you are getting the data inside some confidence interval that for you is good enough for what you are doing.
Experiments
Let’s take a look now in some experiments. These are also taken from the AIF360 paper. Usually, in this field of fairness and bias, there are three main datasets that people are using a lot, usually pretty small datasets. The first one is some adult census income, it’s just like a dataset where you have some information like the gender of someone, if the person is married, divorced, where the person is living. Then at the end what we ask those people is how much they are making, and it’s going to be in range. For example, people are making less than $50,000 a year or more than 50,000 or more than 100,000.
The second one here, German Credit is dataset where same thing you have like some customer that asked for some credit. What we get at the end is, “Did this person like receive the credit?” and if he received the credit or if he managed to pay back this credit. Then COMPAS, the last one, is the datasets related to sentencing, so a bit of like the example I showed you before.
Then what we are going like to look at, are those four different metrics, disparate impact, SPD, average odds difference and equal opportunity. Then we are going to train those three different classifiers, Logistic Regression, Random Forest Classifier and some Neural Nets. What’s interesting with taking that is, the Logistic Regression is like a biased line that people will usually choose when they want to train a model and have a benchmark. A Random Forest is a bit more, not complicated but usually performing always like a bit better than the Logistic Regression. Then Neural Nets us like the IP. Then, we have those different processing steps that we talked about before.
Let’s look at the results. Here, you see there are three datasets – we have COMPA, the credit one and the census. For each of those you can see that there are two predicted values that we will look at. For COMPAS, it’s going to be sex and race, sex and age and sex and race again. Here, it’s going to be the metric. In blue is, if you look at the datasets before we do this pre-processing and we just look at the dataset and compute this metric, what you will see is, we’ll get this score, if you look at all those predicted values.
What we really want for SPD is to make sure that we have a fair value. Usually, what we want is we want this metric to be really close to zero. As you can see before the pre-processing, we are kind of far from it and after the pre-processing we are closer from it. We have that here for this technique which is reweighing. If we use optimized pre-processing, we have the same impact all though a bit bigger than what we will have if we will just do the weighing.
Then, we can do the same if we use the metric disparate impact. Here, what we want to do is, for disparate impact, having a fair value means that your value should be pretty close to one. Here’s the same thing, we use those two different pre-processing techniques. You should start with the blue to the orange and you will see that we are closer to one. It means that your dataset was changed in a better way and it’s going to be fairer for people.
Then we can look at the results. Here, those results are taken only from the census. The predicted value that we had was race. Let’s just look at the best model here. Above here, this line, is before the pre-processing, so if we look at statistical parity, you might see that it is not close to zero. You can see that the accuracy of this model here is pretty close to 77-76 accuracy. We have that for this model, and same thing for disparate impact. It should be closer to one to be fair, it’s a bit below. Then we apply this transformation, and what you can see is here for these two methods you have Logistic Regression and Random Forest. Here you can find them again, Logistic Regression. You are a bit of loss of accuracy. You went from 77 to maybe 75, 76, but you go closer to the zero here that we care about. If you took the Logistic Regression, then here for the Logistic Regression, you might actually like to arrive to a re-fair model. Maybe you lost a bit more from maybe 74 to, let’s say, like 73.
The takeaway from here is, at the end, you can see that you are not losing that much by being fairer to people. Your accuracy is not building very much, but as you can see, usually you can get a fairer model related to those metrics that we are seeing. In some sense, if you look at, let’s say, other results, here, we are choosing other metrics. Here we are choosing average odds difference and equal opportunity difference, and here, we are seeing the same kind of conclusion. We went from having the model that is, again, pretty close to 76 to having, another model pretty close to 75, 76, so not losing much accuracy but being like more fair of all.
Questions and Answers
Moderator: You showed here that there is this small trade-off in accuracy when you apply some of these methods. Have you encountered a situation where this trade-off in accuracy is actually quite significant? How do you think usually you should deal with that? Because if the trade-off in accuracy is quite significant, I believe we may find some pressure to not apply some of these methods.
Silberman: There is some time a really huge decrease in accuracy, but if you are trying something that you should not try. Let’s say one day you really want to know, “What if I’m putting gender? What is going to happen?” At NewBank, usually, we try to avoid that from the start. We know the different features that we might use or not. Depending of those features, we are going to take a look and maybe one day you want to say, “I really want to see the real impact of using this feature,” and you go and you see this impact. The issue is, today we don’t really have it but if you think of Europe – and it’s going to come next year in Brazil – you have laws like GDPR, the data collection law, that is going to force companies to reveal the prediction you are taking from which features are they coming from. If at some point, you are saying, “My features are coming from gender,” then you are going to be in some trouble because, in our case for example, the Central Bank can come and say, “What you did is really bad and you need to remove it” and maybe get some penalty or even remove some license if we do something really stupid. We want to be really careful on that. Here, what we want to do when we do all those research is, we want to go the last mile of making sure that even if you remove those feature and that’s what we saw before. Just removing gender doesn’t mean that your model is not able to find gender again in the other feature that you have.
Usually, what we want is to make sure that those features are not present somewhere else. In my experience, because you don’t need the real one from the start, the decreasing feature is not that much, it doesn’t have that big of an impact. At the end of the day, you can be better and have better accuracy but you still want to keep your license. In the case of NewBank, people really love us and we don’t want to break this relationship with our customers. That’s why we want to make sure that we are fair with them.
Moderator: That’s a good point. If you start by not having this data in your dataset in the first place, I think you are not still tempted to start using it.
Participant 1: The example that you showed us is an example based on a structure data. Do you have any experience or know of any work under unstructured data like image or videos, especially for face recognition and stuff like that?
Silberman: There has been a lot of studies on that. Not so long ago, I think someone did a study on face recognition algorithm from Amazon, Google – I’m not sure Google is doing it – IBM, Microsoft. What they saw was, these models were doing pretty good for, let’s say, male people, either they are black or white, or even female people that are white but really bad for female people that are black. The way you are going to do that is you have to create a dataset that is balanced because from the start, some of the few datasets that we had at the beginning to train face recognition, it was mostly extracted from maybe Google and it was just stars, movie stars that you had because it was really easy to get the data. The thing is, usually movie stars, if you think about it, you might have more representation from maybe male, maybe white male or even white women than a black woman, for example. At the end, it was really easy to fix that because the only thing there to do was, we just needed more data from this underrepresented group and then they did that. They retrained, they looked at the data again, and then everything was back to normal and they were able to classify everything.
Participant 2: In your talk we saw lots of things related to the code and that versus and the data treatment in order to lessen the problem regarding sexism, racism. Do you think there are other areas that we could improve in order to lessen the problem?
Silberman: Where it’s usually complicated is, all these solution that I showed you so far, going on the fact that you have those predicted value. In some sense, you have this information of, let’s say, the race of someone or the gender of someone or maybe the location of someone. Let’s say you don’t have this information, how can you say that you are discriminating against this population if you cannot even compare that this population is discriminated?
There is this research of, “I don’t geolocations of people,” but in my data, because of some issues, one feature is inside a proxy for this information, but I don’t know it. The thing is, my model I’m training it, I’m saying this feature is really good and I’m really happy because my model is very good because of that. You are putting into production, but in some way, maybe you are discriminating against someone, but you don’t even know it because you have nothing to compare. That’s where it’s pretty hard and that’s where this is the interesting part of how can we remove this bias that we don’t even know? How can we find it? Usually, you find it because when you are a data scientist, you might like just look at the data. We’ve been in a lot of cases where you start to see a feature really good and you are just wondering, “Why is this feature really good?” It doesn’t make any sense. You just put in every feature that you have and let’s say, something that is not related. If people were going to pay back some money, let’s say, it’s something like this.
We saw that the number of emails we were exchanging with people was very important. You are, “That is pretty good. I would just put email as a feature.” In fact, what we saw is, email is an important feature because even before you classify this person as someone that you need to contact, maybe even before some people were thinking, “I needed to contact this person in advance because I want to make sure that everything is all right, maybe I can help him before.” Then you are right at the situation where your model is just looking ok. Well, you already started to contact this person but, in fact, you contacted him because you already know that this person was in difficulty. It’s a feedback loop that you want to avoid and it’s pretty hard to understand and accept if you would really go deep inside the data and you understand the whole situation and you don’t just stop at, “This feature is good, my job is done, I’m going home. I’m happy.”
See more presentations with transcripts