Month: August 2021
Java News Roundup: IntelliJ IDEA 21.2, Quarkus 2.1, Micronaut 3.0.0-M5, WildFly, Payara Platform

MMS • Michael Redlich
Article originally posted on InfoQ. Visit InfoQ

This week’s Java roundup for July 26th, 2021, features news from JDK 17, JDK 18, the road to Micronaut 3.0.0, Quarkus 2.1.0, Apache Camel Quarkus 2.1.0, WildFly 24.0.1, Josh Long’s latest edition of the Bootiful Podcast, IntelliJ IDEA 2021.2, IntelliJ Scala Plugin 2021.2, RefactorFirst 0.2.0 and Apache Tuweni 2.0.
JDK 17
Build 33 of the JDK 17 early-access builds was made available this past week, featuring updates from Build 32 that include fixes to various issues. More details may be found in the release notes.
This is the last week in which JDK 17 will be in rampdown phase 2. The initial release candidate is scheduled to be made available on August 5, 2021.
JDK 18
Build 8 of the JDK 18 early-access builds was also made available, featuring updates from Build 7 that include fixes to various issues. More details may be found in the release notes.
For both JDK 17 and JDK 18, developers are encouraged to report bugs via the Java Bug Database.
The Road to Micronaut 3.0.0
Object Computing, Inc. has released the fifth and final milestone version of Micronaut 3.0.0. Up next will be the first of the release candidates. New features in this milestone release include: a migration from RxJava2 to Project Reactor; a change in annotation inheritance using the @Inherited annotation; support for the Jakarta Annotations specification by migrating to the jakarta.annotation namespace; and improvements to GraalVM introspection and resource configuration. Further details may be found in the release notes.
Quarkus
Less than a month after the release of Quarkus 2.0 and three maintenance releases, Red Hat has introduced Quarkus 2.1 with new features such as: Dev Services for the OpenID Connect Keycloak provider; a reactive driver extension, quarkus-reactive-mssql-client, for Microsoft SQL Server; and support for Kotlin 1.5.
Apache Camel
Related to Quarkus, Apache has released Camel Quarkus 2.1 that integrates Quarkus 2.1, improved testing and a new extension supporting the OpenTelemetry specification.
Payara
Payara has released their July 2021 edition of the Payara Platform. Community Edition 5.2021.5 features: a security fix for CVE-2021-28170; support to read from multiple KeyStores and TrustStores; a dependency upgrade to MicroProfile JWT Propagation 1.2.1; 13 bug fixes; and 10 improvements. More details may be found in the release notes.
Enterprise Edition 5.29.0 includes the same new features and security fixes as the Community Edition along with eight bug fixes and nine improvements. More details may be found in the release notes.
WildFly
Six weeks after the release of WildFly 24, the first maintenance release, version 24.0.1, was made available featuring bug fixes and an update to WildFly Preview. Further details may be found in their list of issues.
Spring Framework
It was a very quiet week over at Spring as there were no new releases. However, Josh Long, Spring developer advocate at VMware, just published his latest edition of the Bootiful Podcast in which he speaks to Asir V. Selvasingh, PM architect, Java on Azure at Microsoft, about Azure Spring Cloud, Spring Boot, Microsoft Azure and more.
IntelliJ IDEA
JetBrains has released IntelliJ IDEA 2021.2 featuring: a new project-wide analysis tool that tracks errors before compiling; new IDE actions such as reformatting code and optimizing imports; and the new package search utility.
Learn more by watching What’s New for Java Developers in IntelliJ IDEA 2021.2 presented by Trisha Gee, Java developer advocate at JetBrains.
JetBrains has also introduced the IntelliJ Scala Plugin 2021.2 featuring support for Scala 3.0, improvements in the debugger, formatter, REPL, auto-import, enums, and extension methods.
RefactorFirst
Version 0.2.0 of RefactorFirst was released with support for Java 11, improved number formatting and logging, the removal of Apache Velocity to eliminate issues with CVE-2020-13936, and other bug fixes.
Apache Tuweni
Apache has released Apache Tuweni 2.0, a set of libraries and other tools to aid development of blockchain in Java. New features include: a new crypto faucet application with a simple wallet; JSON-RPC client and server; implement the Ethereum Virtual Machine (EVM) as Kotlin code; and the ability for users to keep alive select connections to other peers.
MMS • RSS
Article originally posted on Data Science Central. Visit Data Science Central
Background
Many areas of AI continue to show innovation at an exciting pace.
For example, today, generative methods are on my radar. So, its nice to see innovation in an area which is stable and mature.
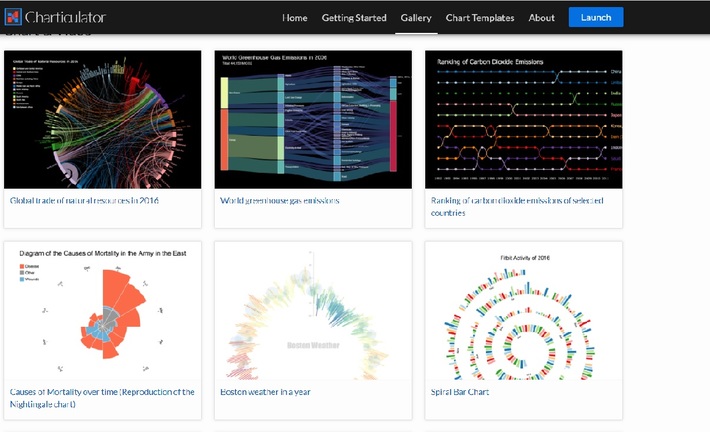
Charticulator from Microsoft research is a free and open source tool for creating bespoke Interactive Chart designs without the need for coding
A gallery of charticulator charts gives you an example of what’s possible
What is the innovation?
While its visually interesting, its important to understand what is the innovation here
Charticulator is an interactive authoring tool that allows you to make custom and reusable chart layouts.
Typically, chart creation interfaces force authors to select from predetermined chart layouts, preventing the creation of new charts.
Charticulator, on the other hand, converts a chart specification into mathematical layout constraints and uses a constraint-solving algorithm to automatically compute a set of layout attributes to actualize the chart.
It enables the articulation of complex marks or glyphs and the structure between these glyphs, without the need for any coding or constraint satisfaction knowledge.
The capacity to build a highly customized visual representation of data, tuned to the specifics of the insights to be given, increases the chances that these insights will be recognized, understood and remembered in the final implementation.
This expressiveness also provides a competitive advantage to the creator of this visual representation in a landscape saturated with traditional charts and graphs.
The charticulator approach lies at the intersection of three ideas:
- People make charts by hand drawing or programming, in addition to using interactive charting tools. Because they cannot tie many aspects of data to graphical elements, illustration tools are insufficient for building custom charts.
- On the other hand, most interactive charting tools based on templates require chart authors to first select from a set of basic chart types or templates, such as bar, line, or pie charts and offer limited customization possibilities beyond that.
- Meanwhile, creating a powerful custom chart with a library like D3.js or a declarative language like Vega gives you a lot of control over how data is encoded to graphical markings and how they are laid out. However, this method is only available to a restricted set of people with advanced programming skills.
So, you could perhaps think that the innovation of charticulator lies in democratizing the custom chart approach and making it easier with no code / low code – and therein lies the innovation IMHO
From a research standpoint, the following are the work’s significant research contributions:
- Charticulator’s design framework, which may be used to create a variety of reusable chart layouts.
- The implementation of Charticulator, a design framework that achieves the design framework by transforming the chart specification into layout constraints and incorporates a constraint-based layout algorithm and a user interface that allows interactive chart layout definition.
- The results of three types of testing: a gallery of charts to demonstrate Charticulator’s expressiveness, a chart reproduction study, and a click-count comparison versus three current tools
I think this is an exciting innovation – and also great that it is free and open source
MMS • Sergio De Simone
Article originally posted on InfoQ. Visit InfoQ
GitLab has released a new open-source tool, Package Hunter, aimed to detect malicious code by running your project dependencies inside a sandbox. Package Hunter leverages Falco to detect unexpected application behaviour at runtime.
Package Hunter is a tool to analyze a program’s dependencies for malicious code and other unexpected behavior by installing the dependencies in a sandbox environment and monitoring system calls executed during the installation. Any suspicious system calls are reported to the user for further examination.
For example, running Package Hunter you could find out that a package attempted to open a network connection on install. This gives you a chance to verify the IP address the package is trying to connect to is legitimate. If that check did not give any hints, you could attempt to replace the version you are using with a different version of the package, e.g. by downloading it from a different source. This would protect, for example, in case a given legitimate version was compromised. As a last step, you could engage in analyzing the reported behaviour by inspecting the code and, possibly, reporting the malicious package.
GitLab has been testing Package Hunter internally since November 2020 and made it straightforward to integrate in their continuous integration pipeline thanks to a specific template. The tool can be used though in any environment supporting Falco 0.23.0, Docker v20.10+, and Node v12.21+. A Vagrantfile is also available to make it easier to install and try it out on your machine.
Package Hunter provide a service running by default on port 3000 that you can control using the Package Hunter CLI. To analyze a project, you create a tar archive of your project and send it to the server. If you are using Docker, you can run the following command to accomplish that:
docker run --rm
  -v "${PWD}:/usr/src/app"
  --env "DEBUG=pkgs*"
  --env "HTR_user=someuser" --env "HTR_pass=somepass"
  registry.gitlab.com/gitlab-com/gl-security/security-research/package-hunter-cli analyze my_project.tgz
GitLab Package Hunter is not the only tool that developers can use to try and protect against malicious code in their dependencies. Both GitLab and GitHub provides indeed support for dependency analysis and code scanning. Package Hunter, though, moves in a slightly different direction by trying to detect malicious behaviour at runtime.
MMS • RSS
Article originally posted on Data Science Central. Visit Data Science Central

Image source: Data Science Blog
Can data especially big data be considered as the new gold? Considering the pace at which data is evolving all across the globe, there is little question. Big data contains huge information and we can extract them by performing big data analysis. Consider the following:
- Netflix saves $1 billion per year on customer retention only by utilizing big data.
- Being the highest shareholder of the search engines market, Google faces 1.2 trillion searches every year, with more than 40,000 search queries every second!
- Additionally, among all the google searches. 15% of those are new and are never typed before, leading to the fact that a new set of data is generated by Google continuously regularly. The main agenda is to convert data into information and then convert that information into insights.
Why need a Proper Big Data Analysis Strategy?
Organizations were storing tons of their data into their databases without knowing what to do with that data until big data analysis became a completely developed idea. Poor data quality can cost businesses from $9.7 billion to 14.2 millions every year. Moreover, poor data quality can surely lead to wrong business strategies or poor decision-making. This also results in low productivity and sabotages the relationship between customers and the organization, causing the organization to lose its reputation in the market.
To deter this problem, here is a list of five things an enterprise must acquire in order to turn their big data into a big success:
Strong Leadership Driving Big Data Analysis Initiatives
The most important factor for nurturing data-driven decision-making culture is proper leadership. Organizations must have well-defined leadership roles for big data analytics to boost the successful implementation of big data initiatives. Necessary stewardship is crucial for organizations for making big data analytics an integral part of regular business operations.
Leadership-driven big data initiatives assist organizations in making their big data commercially viable. Unfortunately, only 34% of the organizations have appointed a chief data officer to handle the implementation of big data initiatives. A pioneer in the utilization of big data in the United States’s banking industry, Bank of America, specified a Chief Data Officer (CDO) who is responsible for all the data management standards and policies, simplification of It tools and infrastructures that are required for the implementation, and setting up the big data platform of the bank.
Invest in Appropriate Skills Before Technology
Having the right skills are crucial even before the technology has been implemented:
- Utilize disparate open-source software for the integration and analysis of both structured and unstructured data.
- Framing and asking appropriate business questions with a crystal-clean line of sight such as how the insights will be utilized, and
- Bringing the appropriate statistical tools to bear on data for performing predictive analytics and generating forward-looking insights.
All of the above-mentioned skills can be proactively developed for both hiring and training. It is essential to search for those senior leaders within the organization who not only believe in the power of big data but are also willing to take risks and perform experimentation. Such leaders play a vital role in driving swift acquisitions and the success of data applications.
Perform Experimentation With Big Data Pilots
Start with the identification of the most critical problems of the business and how big data serves as the solution to that problem. After the identification of the problem, bring numerous aspects of big data into the laboratory where these pilots can be run before making any major investment in the technology. Such pilot programs provide an enormous collection of big data tools and expertise that prove value effectively for the organization without making any hefty investments in IT costs or talent. By working with such pilots, implementation of these efforts at a grassroots level can be done with minimal investments in the technology.
Search For a Needle in an Unstructured Hay
The thing that always remains on the top of the mind of businesses is unstructured and semistructured data – the information contained in documents, spreadsheets, and similar non-traditional data sources. According to Gartner, data of organizations will evolve by 800% in the upcoming five years and 80% of that data will be unstructured. There are three crucial principles associated with unstructured data.
- Having the appropriate technology is essential for storing and analyzing unstructured data.
- Prioritizing such unstructured data that is rich in information value and sentiments.
- Extracting relevant signals must be done from the insights and must be combined with structured data for boosting business predictions and insights.
Incorporate Operational Analytics Engines
One potential advantage that can be attained by using big data is the capability of tailoring experiences to customers based on their most up-to-the-minute behavior. Businesses can no longer extract the data of last month, analyze that data offline for two months, and act upon the analysis three months later for making big data a competitive benefit.
Take, as an example, loyal customers who enter promotional codes at the time of checkout but discover that their discount is not applied to result in a poor customer experience.
Businesses need to shift their mindset of traditional offline analytics to tech-powered analytic engines that empower businesses with real-time and near-time decision-making, acquiring a measured test and learn approach. This can be achieved by making 20% of the organization’s decisions with tech-powered analytical engines and then gradually increasing the percentage of decisions processed in this way over time as comfort grows about the process.
Final Thoughts
In this tech-oriented world and digitally powered economy, big data analytics plays a vital role in the proper navigation of the market and to come up with appropriate predictions as well as decisions. Organizations must never ignore understanding patterns and deterring flows. especially as enterprises deal with different types of data each day, in different sizes, shapes, and forms. The market of big data analytics is growing dramatically and will reach up to $62.10 billion by the year 2025. Considering that progression, 97.2% of the organizations are already investing in artificial intelligence as well as big data. Hence organizations must acquire appropriate measures and keep in mind all the crucial above-mentioned tips for turning their big data into big success to stay competitive in this ever-changing world.
Need Help Tracking Cloud Emissions? Microsoft Previews Microsoft Cloud for Sustainability
MMS • Renato Losio
Article originally posted on InfoQ. Visit InfoQ

At the recent Inspire 2021 conference, Microsoft announced the preview of Microsoft Cloud for Sustainability, a new service to help companies measure and manage their carbon emissions, set sustainability goals and take measurable action.
Microsoft Cloud for Sustainability allows businesses to connect to real-time data, verify if the sustainability goals are met and collect reports and perform carbon accounting using SaaS offerings. Judson Althoff, executive vice president and chief commercial officer at Microsoft, explains why measuring the overall environmental impact of an organization is important but challenging:
Organizations need to be able to record their environmental footprint, report to stakeholders, reduce their resource usage, remove their footprint through carbon offsets or recycling and replace high-footprint resources with low-footprint ones. But doing this effectively means moving away from manually inputting data into spreadsheets, and toward a more seamless data flow via data connectors that provide automated, accurate, real-time data — and ultimately, turn those data-driven insights into action.
The new service adds visibility into the total environmental impact of a deployment and centralizes data sets to create reduction strategies and facilitate reporting. Among the recommended use cases for Microsoft Cloud for Sustainability, Althoff highlights CIOs reporting on IT carbon emissions from the cloud, devices and applications as part of their department’s environmental footprint. Companies can offer sustainability scorecards to track progress against their carbon emission reduction goal and customers can highlight specific emission areas, tracking their emission reduction goals.
Lucas Joppa, chief environmental officer at Microsoft, and Noelle Walsh, corporate vice president at Microsoft, confirm the net-zero by 2030 commitment from Microsoft and explain how that will involve customers and partners:
The grid is not the only infrastructure that Microsoft can help decarbonize. Through new digital tools we can also assist our customers in decarbonizing their own operations and infrastructure. This was the motivation behind our announcement of a new Microsoft solution – the Microsoft Cloud for Sustainability.
In a separate report, the cloud provider discusses a new digital and sustainability framework for the public sector. Microsoft is not the first software company to introduce emissions-tracking tools: Salesforce’s Sustainability Cloud allows customers to evaluate carbon emissions measuring and managing action plans and Accenture recently launched Green Cloud Advisors to enable enterprises to operate more sustainable and efficient cloud environments.
Microsoft Cloud for Sustainability is currently in preview and carbon emissions is not the only target area, with Microsoft planning to provide similar tools for waste and water consumption.
MMS • RSS
Article originally posted on Data Science Central. Visit Data Science Central
Overview of different types of keys used in E-R diagrams.
- How to establish a primary key from a set of alternatives.
- Composite, superkey, candidate, primary and alternate keys explained.
- Other keys you may come across include foreign and partial keys.
If you’re unfamiliar with entities and attributes, you may want to read Intro to the E-R Diagram first.
The ER diagram is a way to model a database in an organized and efficient way. A key is a way to categorize attributes in an E-R diagram. When you first start making E-R diagrams, the number of different choices for keys can be overwhelming. However, the goal of the E-R diagram is to create a simplified “bird’s eye” view of your data. A judicious choice of keys helps to achieve that goal. Although there are many different types of keys to choose from in a set of data, relatively few will actually make it to your finished diagram.
Composite Keys
In general, keys can be single-attribute (unary) or multi-attribute (n-ary). A composite key requires more than one attribute. If a key is composite, like {state,driver license#}, a composite attribute can be made from the separate parts. In the early stages of database design, like E-R diagram creation, entity attributes are often composite or multi-valued. However, these may create problems down the road and need to be handled in specific ways when you translate into an actual database [1].
Superkey, Candidate, Primary and Alternate Key
A superkey of an entity set is an attribute, or set of attributes, with values that uniquely identify each entity in the set. For example, a DMV database might contain the following information:
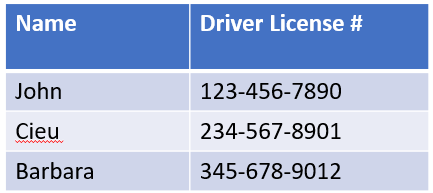
In this example, {License #} is a superkey as it is a unique identifier. {Make,Model,Owner,State,License#,VIN#} and {State,License#,VIN#} are also superkeys. On the other hand, {Owner} or {Make,Model,Owner} are not superkeys as these could refer to more than one person [2].
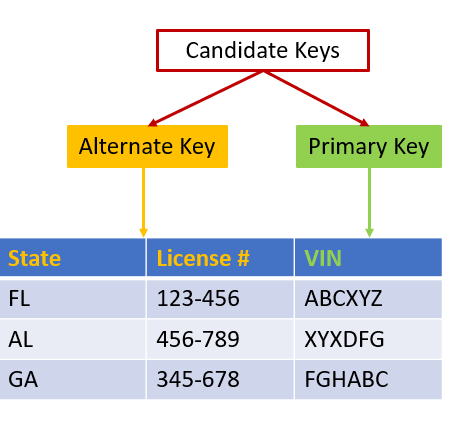
A candidate key is a minimal super key that uniquely identifies an entity. Minimal superkeys have no unnecessary attributes; In other words, superkeys that don’t have subsets that are also superkeys. For example, {State,License#} or {VIN} in the above set are possible choices for candidate keys.
One you have identified all the candidate keys, choose a primary key. Each strong entity in an E-R diagram has a primary key. You may have several candidate keys to choose from. In general, choose a simple key over a composite one. In addition, make sure that the primary key has the following properties [3]:
- A non-null value for each instance of the entity.
- A unique value for each instance of an entity.
- A non-changing value for the life of each entity instance.
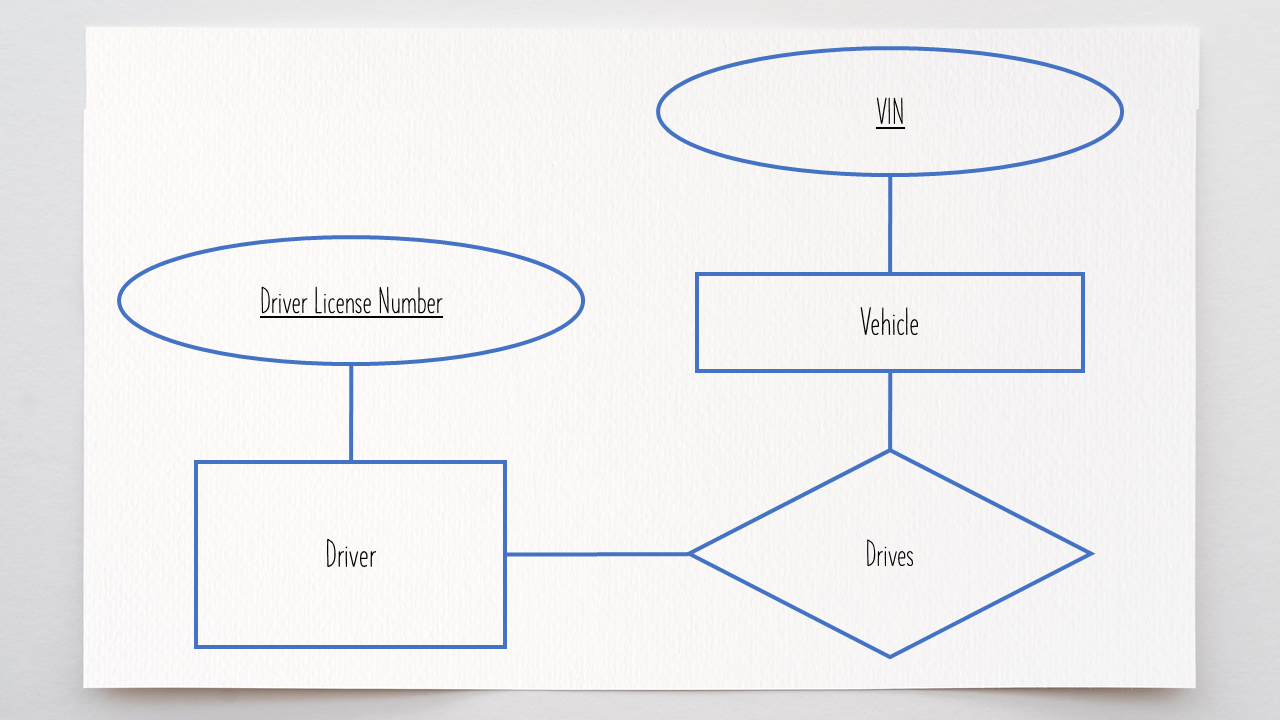
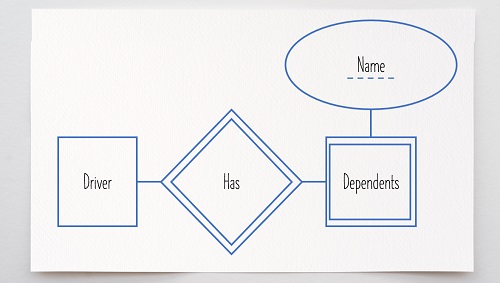
In this example, the best choice to identify a particular car is {VIN}, as it would never change for the lifetime of the vehicle. The first digit of a driver license number will change when a name change occurs, so this does meet the requirements of property 3 above. In addition, {VIN} is the logical choice because it is directly associated with the car. If an ownership change would occur, the VIN would stay the same. An alternate key is any candidate key not chosen as the primary key. For this example, {State,License#} is an alternate key. A partial key identifies a weak entity. Weak entities–those that rely on other entities–do not have primary keys [4]. Instead, they have a partial key–one or more attributes that uniquely identify it via an owner entity.
When the word “key” is used in an E-R diagram, it usually refers to the primary key for an entity [5]. Show the primary key by underlining the attribute.
Dashed underlines indicate partial keys.
Other Keys You May Come Across
Foreign keys are not used in E-R models, but they are used in relational databases to indicate an attribute that is the primary key of another table. Foreign keys are used to establish a relationship when both tables have the same attribute [5].
A secondary key is used strictly for retrieval purposes and accessing records [5]. These keys do not have to be unique and are typically not included in an E-R diagram. The term secondary key is also occasionally used as a synonym for alternate key [6].
References
[1] Entity-Relationship modeling
[2] Relational Model and the Entity-Relationship (ER) Model
[4] Entity-Relationship Diagram Symbols and Notation