Month: August 2018

MMS • RSS
Article originally posted on Data Science Central. Visit Data Science Central
I was at crossroad to choose my next leap. Cloud, AWS, Agile, Blockchain and many other were the words I heard from the experts and how its boom in the industry. I was confused on what subject and technology should I consider for comprehensive study for my professional growth. I have been working on Business Intelligence tools for quite some time and had inclination towards data and facts that could be supported by data, understanding what data means and uncovering the insights from the data. So, I learnt of Data Science and intended to explore this field.
What is Data Science to me?
Data Science to me is, collecting data from diverse sources to my business interest, investigating it to find the crux by applying some scientific and statistical methodology and visually presenting results to the world. Data science is an art to paint a picture from the different available colors and brushes. Colors are relevant to different form of data and brushes are the Data Science tools used for investigation.
According to Wikipedia, Data Science is a “concept to unify statistics, data analysis, machine learning and their related methods” in order to “understand and analyze actual phenomena” with data. Data science is an interdisciplinary field that uses scientific methods, processes, algorithms and systems to extract knowledge and insights from data in various forms, both structured and unstructured.
With conceptually understanding Data Science, I had few questions –
Why we need it, how does this impact our life and what it means to my future?
With the use of internet, mobile apps and expansion of “Internet of Things” the data generated at each stage of process is increasing day by day. Such a huge data can be source of business to an organization be it sales, marketing, hiring or at the process level, if the data is analyzed to extract meaningful insight. In today’s competitive world, it’s a need for business to understand the generated data to make quicker and better decisions, in providing better service and communicating to business consumers and customers efficiently.
For example, Bank maintaining the account and purchase history of the customer, providing the graphical representation of the spending, identifying and predicting the patterns and suggesting additional services based on the analysis. Resulting in building healthy relationship with customers.
Application of Data Science does not limit to any specific domain or industry. If you have sufficient data generated and have questions about your business, Data Analytics can bring answers to these questions. Having said, the benefits of Data Science vary to each organization depending on the business need and problems.
Data Science can add value to business by the insights obtained from statistical analysis.
Organizations have started understanding the power of utilizing data science to uncover the hidden meaning of their data, and so the demand for the trained data scientist is will grow in coming years. Data science is an emerging field and trained professional are the need of an hour.
All above is fine, but What will I gain from learning Data Science?
Existence of Data Science has been since ages, however Organization are now exploring and utilizing its benefits. Meaning, the opportunity will arise for Data Scientist. It seems like a dream job with attractive pay, but along with it comes the huge responsibility and expectations from Data Scientist to do some miracle. You would get to master Data skills, gain domain knowledge, be a team player and more importantly understand the business.
With Data Science you open your path to Machine Learning and Artificial Intelligence.
Who can be Data Scientist?
“A data scientist is someone who is better at statistics than any software engineer and better at software engineering than any statistician.”
Anyone who can:
- Think analytically on the business problem. Understand and ask right questions on the business problem.
- Be curious about the given data.
- Have interest and enjoy statistics and programming.
- Is willing to be constantly in learning mode, learning about the latest technologies in the area of Data wrangling and management.
- Willing to dirty hands with messy and huge data (structured and unstructured) and apply analytic powers to identify the solutions on business problems.
What should be my first step?
You have already taken your first step towards Data Science by reading this blog. 🙂
You should start learning on the business values gained with the help of Data Science. Once this interest you, you will start relating this learning with your business data. You will then wonder how to get it working. And this is your first step towards Data Science. Your learning starts here.
Exploring the skills required to be Data Scientist, various tools required for doing the job would be the next step.
As a Data Scientist some of the base essential skills you should start with: Python, Fundamental of Statistics, Database Management System, Query Language, ETL, BI Visualization and more important Communication Skills.
Being from Infrastructure Management, I had to spend some time understanding basics of Python. I tried to interpret how Python is used in Data Science and could conclude that it is not expected to be Python programmer writing thousand lines of code. As Data Scientist, main task is to process and analyze data and identify the patterns. Python provides various libraries to ease our job. Start getting acquainted with these libraries, as these would be used regularly in Data Science job. R and SAS are other popular languages for data analysis. R language is more likely preferred when performing advance data analysis task. Python and R are open source programming language, while SAS is enterprise tool offering huge statistical functions and good GUI for quick learning.
One should have good hands-on experience on Visualization tools. Some for reference are Cognos BI, Tableau, QlikView and Watson Analytics.
Love for Statistics
If you never loved Statistics in high school, start loving it now. I was never fond of Statistics during my high School but when I decided my journey towards Data Science, I had to start Statistics all over again. Get the concepts and fundamental of Statistics thorough. I started with a book Fundamental of Statistics. At first, I found it difficult to understand until I find good mentor. I would suggest find someone who can explain statistics in simpler way and then go back to books. If you could not find any mentor or coach, refer some online material and content. YouTube videos can be your savior. It is important learning step on the path to be Data Scientist.
Tools for Data Scientists
Each job posting and project for Data Science would have lengthy list of technical skills expecting to be proficient in all mentioned skills. Skills on data technologies, scripting languages and statistical programming languages.
Few frequent tools mentioned below that Data Scientist are expected to know (at least one from each space). The list can expand depending on the business domains.
- R/Python/SPSS/SAS
- Hadoop tools – Spark, Hive, Impala
- Knowledge of Big Data
- Excel
- DBMS, Oracle, Hadoop, Mongo DB
- Business Intelligence reporting tools – OBIEE, Business Objects, Cognos, Tableau, MicroStrategy etc
The learning path for Data Science just doesn’t stop, it is continual process. Start with open source tools to do practice exercise while learning. Some of the Learning sites I continue to refer: Data Science Central , Cognitiveclass.ai and coursera.
Take an initiative to start your Data Science journey. Data Science is fun when data talks to you! Never Stop Learning!
MMS • RSS
Article originally posted on InfoQ. Visit InfoQ
Sue Johnston gave a talk at the recent Agile2018 Conference in San Diego titled “Heroes Are Expensive – Extinguishing The Firefighting Culture”. She identified how to spot a hero, what leads team members and leaders to heroics, what the impact is, what we can do about it, and how we can redefine what a Hero is.
Many of us can resonate with being a Hero at work, and we can all call out one we work with as well. Heroes are at the center of every crisis! How do you pick out a hero? Or, maybe you recognize heroics yourself? Heroes work late, and are always busy, busy, busy. They want to be at every meeting to be in the know on everything happening. Some heroes are unconscious of their heroic behaviors and others are very conscious of it.
What is the impact of heroics? At first glance, we may think heroics are needed to get things done. But, a dark side lurks causing big impacts. Heroics creates silos in organizations and with this creates a single point of failure. Often heroics demoralize others and team morale overall. It causes burn out and is not sustainable. There isn’t visibility into the real problems and therefore bandaids are used, but things really never get fixed. This is expensive for organizations! It also prevents real innovation and progress.
Many common place behaviors in leaders and others lead to heroics in teams and organizations. The biggest one is that leaders reward it. They reward it with incentives, setting the hero example, and comments made to the individual and the team. A lack of planning, unclear priorities, limited resources, poor communications and delayed decisions also contribute.
Now you are thinking, “Wow, this is my team!”
What can you do about it?
It starts with taking a look at our own behaviors and how we are part of the issue.
- Are you rewarding heroics? or, Do you love being rewarded for heroics?
- Focus on outcomes rather than outputs. Software is an output, an outcome is focused on what the user is trying to accomplish with the software
- Pair up team members to share skills and knowledge
- Move rewards from “me” to “we”, rewarding teams rather then individuals
Sue challenged the audience to redefine “hero” to mean something more healthy for individuals, teams, and the organization. The qualities of a redefined hero include:
- Taking care of one self and then for others
- Asking for help
- Promoting innovation
- Sharing and learning together with others
- Helping build a vision with the team
- Encourage fixing the real issues not patching problems
- Doing things well rather than fast
- Accepting failure as good and as learning
She ended by asking the audience is they are ready to redefine what a Hero is in yourself, your team, or your organization?
MMS • RSS
Article originally posted on Data Science Central. Visit Data Science Central
In 1992, I entered the job market and landed a job as an advertising copywriter for McDonald’s. I was tasked with ideating radio, TV and print advertisements to curb burger, fries and soft drink sales. The internet did not exist in the public domain back then, and my first laptop was actually a mechanical type writer. Around 2000, I became a freelance marketing manager, working for small and mid sized businesses. At that time, my English was not good enough to work for companies outside of my home country Germany (it’s still far from perfect).
Fast forward 10 years, I was still working as a marketing guy, yet after years of self-study, my English became profoundly workable. I managed to acquire some of the largest US based IT and software companies as my clients, and in 2013, I started teaching myself to code. Back then, I was increasingly worried that as a technology illiterate, I might be flushed out of the job market in a forseeable future.
At the moment of writing this post, I am bootstrapping a data literacy consultancy, catering to large enterprises around the globe. I teach business users how to work with Excel in ways they haven’t seen before. Plus, I teach them how to code and work with data in a utility scale environment. My learning journey was tough, but it can be smooth for any business leveraging on my experience.
My biggest fear of becoming jobless turned into the business opportunity of my lifetime.

T-Systems employees protesting against their employer’s decision to release 10,000 workers who don’t possess any coding skills. Source: Verdi | Markus Fring
10 observations I made during my own transition, which might propel yours
You might be tempted to say: “Nah, that’s not me. An ad guy turned consultant!” And you know what? You’re right! I‘m not you. Just take my observations and use them to craft your own, unique career transition story. Use my learnings to avoid unpleasant surprises and expensive mistakes. In 5 to 10 years, so I hope, we will have thousands of stories, and distinct career transition patterns will emerge.
The observations below are not sorted in order of importance, I rather arranged them for the sake of an easily digestible narrative. Let’s get started.
1st observation: just learning to code will get you nowhere
My liason with coding was rather erratic, with many ups and downs, and it wasn’t until 2016 that my learning journey took a promising direction. All I knew back in 2013, when I wrote my first “hello world” line of code, was that programming will be the skill of the future for virtually any type of occupation. I had no idea though how that applied to me.
First, I tried to wrap my head around .NET which went terribly wrong. I then gave it a shot and learned the basics of Ruby on Rails, Python Django and HTML5/CSS. Ultimately, I was able to build sleek, beautiful websites using the Bootstrap framework, but instead of being proud, I felt frustrated: “What’s the point of being able to build simple websites if anyone with zero programming skills can create his own page via a website builder for just a couple bucks?” I felt that I put a lot of effort into acquiring ubiquitous and automatable skills. Even if I invested further energy into my web developer skills, I would eventually end up competing against highly skilled professionals from all over the world, many of which would be capable of delivering better results at significantly lower rates.
Eventually, I developed in interest in crunching data. Initially, I just wanted to better manage my personal finances. That was it back then, but it was the beginning of an exciting journey.
2nd observation: Excel is dead, long live Excel
Yes, Excel is the ultimate entry level drug for working with data. After using Google Sheets for a while, I realized that Excel is playing in a league of its own. It’s highly addictive, and after learning the basics, I discovered the cool stuff built into Excel – and beyond:
- Power Query for processing and mashing up data
- Power Pivot for advanced calculations with Pivot Tables
- Power BI for interactive data visualizations
You can find an excellent post on the technologies listed above here.
3rd observation: the more you share, the more you learn
It initially felt very uncomfortable sharing my learnings as I go. “What if I don’t know enough about my subject and people criticize me for that reason?” I thought. It turned out that my worries were pointless.
Technology is evolving faster than ever, and businesses are being shaken up at an unforeseen magnitude. We just can’t wait decades for an expert culture to evolve, because by then, it’s going to be too late for us to learn from them. Peer learning, peer consulting and peer working is becoming the predominant way for individuals and businesses to keep pace with change, one iteration at a time.
I shared my learnings on Power Query and the built in M-Language in a series of blog posts. It was very well received within the global Excel, Power BI community and this series landed me some first assignments at large multinationals. I started delivering workshops, trainings, and surprisingly, the vast majority of my participants was not aware of latest technologies built into Excel. This came as a surprise to me: “Here I am, an Excel rookie, teaching veterans with +25 years of experience how to use Excel.” Each of my workshops I delivered so far was overbooked. To date, not a single participant had any objections against my peer learning approach, quite the contrary.
4th observation: citizen data scientists are coming, yet their scope is limited
Citizen data scientists is a new category of knowledge workers without a formal data science related educational background. They consume data science “as a service” from various vendors to perform data analysis, and that’s about it.
For example, you can connect to Microsoft Azure Cognitive Services via API from within Power BI, in order to run a sentiment analysis on your customer feedback data. I am guessing that you can use cognitive services provided by Amazon or Google, I admittedly haven’t tested their offerings yet. Likewise, you might use Tableau or Qlick as your business intelligence tool, which I am both not familiar with yet.
My point is that, regardless of the underlying technology, you don’t need to be a fully fledged data scientists in order to utilize machine learning capabilities. However, as a citizen data scientist, you can only consume services without any insight into the machine learning models at use. These are all black boxes and you need to put some faith into your vendor’s capabilities.
Apart from those limitations, I grew increasingly allergic against vendor marketing which claims that anyone can be a citizen data scientist, and all it takes is just joyfully clicking through a colorful UI. That’s just utterly wrong. It takes a significant learning effort to master business applications tailored for citizen data scientists.
5th observation: it takes a significant time investment, ideally a learning sabbatical to transition
From my own experience, it took me roughly 3 months of full time study to become a versatile citizen data scientist. So much about Microsoft Power BI marketing claim: “5 minutes to wow!” If you aim to make a significant career transition, you will most likely need to take a break from your work. Burning midnight oil and working through weekends might just get you dangerously close to a collapse.
You might consider a one month break, 3 months, 6 or even an entire year as I did. I will share details on planning a learning sabbatical in upcoming blog posts. If you are contemplating to take a full year learning sabbatical, consider this:
- Opportunity costs: I turned down a whole year’s project worth north of 200,000 USD
- Costs of living: I cut my personal expenses from 60,000 USD to 20,000 USD annually
- Social costs: My environment did neither comprehend nor support my decision, such as my back-then-financée. Luckily, I kept the dog
Getting back to business from my learning sabbatical, I can speak from personal experience what it means to undergo a digital transformation. I can empathize with people who’s jobs are at risk due to their insufficient skills for a technology centric future. Digital transformation is not about opening loft office spaces with colorful bean bags, and playing table football games between casual work engagements – leaving anyone who is not cool enough outside. It’s about making tough choices in the first place and putting in a lot of work over an extended period of time. A committed organization though can move mountains.
6th observation: blend your current expertise with new data analytics & science related skills
During my learning sabbatical, I focused primarily on mastering:
- Excel & Power BI advanced features
- Python in conjunction with Pandas
- Anaconda Jupyter Notebooks
In addition to that, I learned the fundamentals of:
- Math, Probability & Statistics
- Statistical Machine Learning
I am now in the process of mastering:
- Querying SQL server
- Using Linux Command Line Interface
- Apache Hadoop, primarily Pig, Hive and Impala
I have sufficient skills under my belt to apply for an entry level Data Analyst opening. “But what’s the point of taking a job with 40k in annual salary or less?” so I thought. Instead, I realized, it’s by far more lucrative to blend those skills I have acquired over 25 years with those I have been adding over the recent few years.
As I copywriter, I learned to write with clarity. “Why not start teaching business users how to become data literate, thus monetize on my learning experience?” was an obvious choice for me.
As a data literacy consultant, my daily rates are 100% higher compared to those in my previous freelance marketing manager role. More importantly, due to my strict personal expense regiment, I feel not pressured to quickly return to my previous annual income. It’s not about money alone anymore. For now, I feel comfortable living frugally, way below my means, enjoy the freedom it brings and focus on the long term goal of building a sustainable business (I am talking 10, 20 years here).
Instead of maximizing on billable workdays as I did in the past, I focus on productizing my service. Tens of thousands of people are losing their jobs, because they lack sufficient technology and data skills. I am on a mission to transform the way business users work, just as I transformed the way I work and do business. If I am capable of making a highly unlike transition, so can anyone else.
You just learned about my transition. I am curious to hear about yours. Maybe you have questions I didn’t answer in my write-up? Please leave a comment or reach out to me via email rafael@knuthconcepts.com or via LinkedIn.
MMS • RSS
Article originally posted on Data Science Central. Visit Data Science Central
For any business, the worst scenario is getting out of product inventory when customers are ready to buy your product. Keeping a stock of every item in the store is another burden to carry for every business. This trade off has been even more problematic in current times, when manufacturing firms are flooding with SKUs (Stock Keeping Unit) ranging from product sizes, flavours, styles etc. To cater personalised demand companies are customising products by adding various features to it & this is making life even more complex for all parts of businesses involved in the whole supply chain.
To understand this problem, lets take an example of a toothpaste. There are more than 6–7 popular brands such as Colgate, Pepsodent, Close up, Dabur, Himalaya, Meswak etc with each having 4–5 toothpaste different sizes ranging from 50gm to 300 gm & 4–5 different variants such as Sensitive, Germi-check, Gumcare, Whitening etc.

Keeping an inventory for all SKUs is a troublesome experience for any corner shop. But if a customer goes away without buying just because shop does not have specific type/size of toothpaste, it is even more painful for the business owner. In this particular scenario, customer may be ready to buy some other toothpaste, but the luxury of choosing another option is not available for all products.
Backorder Definition
When product is not readily available and customer may not have patience to wait, this leads to lost sales and low customer satisfaction. When a customer places order for future inventory & wait for it is called backorder. Backordering is good as well as bad for business. Demand will bring backorders but not best planning can cause problems. Machine learning is the path to get the maximum out of this trade off. Lets get going on the path to profit maximisation and better customer satisfaction.
Predictive Analytics can help to distinguish the items which may have backorders tendency to help organisation by providing the required actionable insights. Production schedule can be tweaked to reduce the product delivery delay which, in return, increases customer satisfaction.
Inventory Management Challenges
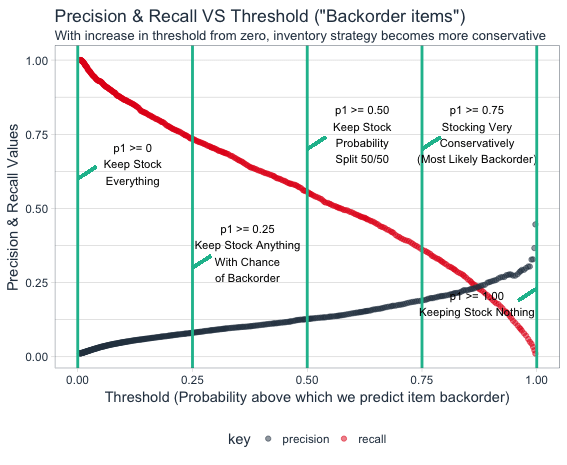
By making use of any good classification machine learning technique such as XgBoost, one can easily predict the probability of product being on backorder list. We will cover classification machine learning technique along with code in separate blog. After getting items backorder probabilities, optimisation is another tricky part. For this classification problem, selection of threshold value for probability will be key to inventory optimisation. In business context, this threshold selection will provide balance between cost of inventorying incorrect product (low precision) v/s cost of lost revenue (low recall)
Precision: When model predicts item will have backorders & how many times actually it has backorders. if we adopt business strategy with high precision (low recall), then we had to let the model misclassify actual backorder cases to decrease the number of incorrectly predicted backorder items.
Recall: When actually items have backorders and how often the model predict it to be having backorders. If we adopt business strategy with high recall (low precision), then we had to let the model predict actually non backorder items as backorder items.
By playing around with probability threshold limit, we can actually tweak the business strategy. Business strategy shifts to conservative zone in which very less items predicted as backorder items if we increases probability threshold.
By using machine learning we can easily get the values of true positive, false positive, true negative & false negative rates very easily for a large set of different threshold values. From here onwards, the first business principal of cost benefit analysis will help us in profit maximisation.
Cost-Benefit Analysis
Benefits
- True positive: Benefit by predicting correctly the backorder SKUs. Profit generated from such items is benefit.
- True negative: Benefit by predicting SKUs not in backorder list correctly. Though benefit from this is zero as customer has not bought item, storage cost saved in addition to opportunity cost for not manufacturing such items is also benefit.
Cost
- False positive: This cost is due to the fact that we predicted few items as backorder items but they were not actually in backorder item list. The warehousing cost for such items is the cost associated with false positive.
- False negative: The cost associated with incorrectly missing items when actual demand was there for item.
The Above cost benefit calculations has to be done for all products at specific threshold to see the deviation of net cost-benefit at every threshold value.
SKU Optimisation
If we take one SKU, say we have predicted it to be not in backorder list. If hypothetically the benefit of correctly predicting backorder is $1000/unit and cost for false positive is $50/unit (accidentally inventorying).
The expected value equation can be generalised to
Expected_Value= ∑pi*vi where i ranges from 1 to N observations for each SKU.
p is the probability of backorder for any SKU
v is the value associated with the SKU
From the above general form of equation, overall expected profit equation can be generated by combining the two matrices i.e cost benefit matrix and expected probability matrix.
Expected_Profit=p(p)∗[p(Y|p)∗b(Y,p)+p(N|p)∗c(N,p)]+p(n)∗[p(N|n)∗b(N,n)+p(Y|n)∗c(Y,n)]
- p(p) is the positive class prior (probability of actual backorder / total) from confusion matrix
- p(n) is the negative class prior (probability of actual no / total = 1 — positive class prior)
- p(Y|p) is the True Positive Rate (TPR)
- p(N|p) is the False Negative Rate (FNR)
- p(N|n) is the True Negative Rate (TNR)
- p(Y|n) is the False Positive Rate (FPR)
- b(Y,p) is the benefit from true positive (TP_CB)
- c(N,p) is the cost from false negative (FN_CB)
- b(N,n) is the benefit from true negative (TN_CB)
- c(Y,n) is the cost from false positive (FP_CB)
For the taken hypothetical example, this equation simplifies further as TN_CB and FN_CB are both zero.
Expected_Profit=p(p)∗[p(Y|p)∗b(Y,p)]+p(n)∗[p(Y|n)∗c(Y,n)]
Business Implications
Lets check the above equation while taking hypothetical prediction for an item that does not have backorder. Lets assume model predicted 0.01 probability of being backorder for an item. The earlier hypothetical example where $1000/unit profit and $50/unit inventory cost assumed. from the visualisation , we can calculate that optimal threshold is 0.48. Keeping all items in inventory strategy with threshold as zero will make company to lose money on low probability of backorder item and no inventory strategy would lead to no benefit but no loss.
On the other hand if we check high backorder probability item, it is beneficial to have loose strategy than conservatory strategy. The profit will be reduced to zero if we have conservative strategy to keep inventory of such item.
In the nutshell, items with low backorder probability will try to increase the threshold limit and the high backorder probability items are trying to decrease the threshold limit. We need to adjust and play with this tradeoff to maximise overall profit. Every item with different threshold can be further aggregated to get the overall threshold value while making maximum profit from the inventory and backorder management. By making use of discussed machine learning techniques, businesses can better optimise inventory management while not sacrificing the utmost important profit maximisation objective.
This post originally published on DataToBiz‘s official blog page. DataToBiz connects businesses to data and excels in cutting-edge ML technologies in order to solve most of the simple and trivial problems of business owners with the help of data. Feel free to Contact for more info.
MMS • RSS
Article originally posted on InfoQ. Visit InfoQ
The 13th annual State of Agile survey has been announced by CollabNet VersionOne. This yearly survey explores the worldwide adoption of agile:
The report gives software professionals deep insight into agile trends, best practices and lessons learned to help them succeed with their agile transformations.
The State of Agile is the longest-running report on agile software development, exploring the adoption and scaling of agile methodologies and usage of agile practices. The report also investigates the challenges that are faced by organizations and the benefits that agile has brought them.
The survey was announced at the Agile 2018 conference and in a press release, where Flint Brenton, CEO at CollabNet VersionOne, reached out to invite people to join the yearly survey:
Technology professionals world round look to the State of Agile Report each year for insights and perspective on software development, methodologies and practices surrounding agile as well as understanding of the challenges faced by organizations.
We invite individuals to share their experiences and by doing so, help contribute to the software development community.
Earlier InfoQ interviewed Lee Cunningham about the State of Agile 2018 report and asked him about the major changes in the 2018 State of Agile report, compared to previous reports:
Lee Cunningham: Most of the trends we track in the survey change only incrementally from year-to-year, and many of them reinforce that the same fundamentals still need to be addressed. Organizational culture is one example of that.
One significant change did emerge this year, though, and that is the importance of customer/user satisfaction as a measure of success, both for agile initiatives (transformation effort itself) and for agile projects. In the past we’ve seen things like “on-time delivery”, “quality” and “business value” ranking ahead of customer satisfaction.
Several other yearly agile surveys exist, examples are the State of Testing and the State of DevOps.
The book Accelerate: Building and Scaling High Performance Technology Organizations explores the factors that impact software delivery performance and describes capabilities and practices that help to achieve higher levels of throughput, stability, and quality. The research in this book has been done based on results from the State of DevOps Reports.
The 13th State of Agile survey will remain open until Dec. 1, 2018. Participants will get a complimentary copy of the report ahead of the official launch.
MMS • RSS
Article originally posted on InfoQ. Visit InfoQ
Key Takeaways
- Java serialization introduces security flaws across many libraries.
- Discussions are open to modularize serialization.
- If serialization becomes a module, developers would be able to remove from the attack surface.
- Removing other modules removes their risk.
- Instrumentation offers a way to weave security controls in, offering a present-day defense.
Java’s Serialization feature has garnered several years worth of security exploits and zero day attacks, earning it the nickname, “the gift that keeps on giving” and “the fourth unforgivable curse“.
As a response, the OpenJDK contributor team has discussed ways to limit access to serialization, such as extracting it into a jigsaw module that can be removed – the idea being that hackers cannot attack what isn’t there.
This follows up on recommendations from popular articles, such as “Serialization Must Die” and would help prevent exploits in popular software like VCenter 6.5.
What is serialization?
Serialization has existed in the Java platform since the release JDK 1.1 in 1997.
It was intended as a lightweight mechanism to share object representation between sockets or store an object and its state for future retrieval (a.k.a. deserialization).
Within JDK 10 and below, serialization is included in all systems as a part of java.base and the java.io.Serializable methods.
GeeksForGeeks maintains a description of how serialization works at its base.
For more code examples of how Serialization is used, Baeldung has an Introduction to Java Serialization.
Challenges & limitations of serialization
Serialization is limited in two primary ways:
- Newer strategies for object transfer have emerged, such as JSON, XML, Apache Avro, Protocol Buffers, and others.
- The serialization strategy from 1997 could not foresee the way that modern internet services would be built and attacked.
The basic premise of serialization attacks is looking for classes that execute or perform a privileged action on data that gets deserialized, then passing them the representation of that class with a malicious payload. To understand the complete walkthrough, the presentation “Exploiting Deserialization Vulnerabilities in Java” by Matthias Kaiser in 2015 provides a sample starting on slide 14.
Much of the security research surrounding serialization is based on work by Chris Frohoff, Gabriel Lawrence, and Alvaro Munoz.
Where is serialization and how do I know if my application uses it?
The change to remove serialization stems from the java.io package, which is part of the java.base module. The most common uses are:
Developers using these methods should consider switching to alternative methods of storing and reading back their data. Eishay Smith has posted performance metrics of several different serialization libraries. When evaluating performance, an awareness of security needs to be incorporated into the baseline metric. In cases where the default Java serialization is “faster”, the exploits operate at the same speed.
How can we limit serialization flaws today?
Isolation of the serialization APIs is discussed in project Amber. The idea is that is serialization moves from java.base to its own module, applications can remove it altogether. The discussion of this proposal did not bear fruit in the time for the JDK 11 feature set but may be worked on for a future Java version.
Limit serialization exposure now through runtime protection
Many organizations will benefit from a system which can monitor for risks, automating repeatable security expertise. Java applications can embed security monitoring through tools that take advantage of the JVMTI, using instrumentation to place sensors inside an application. One free product in this space is Contrast Security, a previous Duke’s Choice award winner from JavaOne. Similar to other software projects such as MySQL or GraalVM, Contrast Security’s community edition is free to developers.
The benefit of using runtime instrumentation for Java security is that it does not require code changes and can integrate directly into the JRE.
It operates similarly to Aspect Oriented Programming, weaving nonintrusive bytecode into the application at sources (where remote data enters the application), sinks (where data can be used in an unsafe way), and passthroughs (where security tracking needs to move from one Object to another).
By integrating at each “sink”, such as serialization’s ObjectInputStream, runtime protection can add its functionality. This functionality was critical for serialization back before deserialization filters were backported from JDK 9 and remains crucial for other attack types such as SQL Injection.
Integrating this runtime protection simply involves changing the startup flag to add a javaagent. In Tomcat, for example, this flag is entered into bin/setenv.sh as follows:
CATALINA_OPTS=-javaagent:/Users/ecostlow/Downloads/Contrast/contrast.jar
Once startup, Tomcat will then initiate and weave detection and prevention into the application as it loads. The separation of concerns leaves applications free to focus on their business logic while the security analyzer handles the right security at the right place.
Other helpful security technology
For ongoing maintenance, instead of wondering or making a manual list, consider running a system like OWASP Dependency-Check, which will identify dependencies with known security flaws and indicate were to upgrade. Or rather than waiting, consider automatically keeping up to date with libraries through a system like DependABot.
Although well intentioned, the default Oracle Serialization Filter suffers from from the same design flaw as the SecurityManager and associated sandbox exploits. By conflating personas and requiring advance knowledge of the un-knowable, this feature will likely see limited adoption: system administrators do not know code to list class files, developers do not know the environment, and even DevOps teams typically do not know requirements of other system parts such as the application server.
Removing security risks of unused modules
One aspect of the modular JDK of Java 9 is the ability to create custom runtime images that remove unnecessary modules, cutting them out with a tool called jlink. The security benefit of this approach is that hackers cannot attack what isn’t there.
Although the proposal to modularize serialization may take time for applications to adopt and use the new feature of using alternate serialization, fixing security issues follows the proverb of planting a tree: “the best time to plant a tree was twenty years ago, the second best time is now.”
Switching away from Java’s native serialization should also offer better interoperability for most applications and microservices. By using a standards-based format, such as JSON or XML, developers can more easily communicate between services written in different languages – a python microservice typically has better integrations for reading JSON document than a binary blob from Java 7 update X. While the JSON format simplifies object sharing, the Friday the 13th JSON attacks against Java and .NET parsers demonstrate that there is no silver bullet (whitepaper).
Until that switch is made, serialization will remain in java.base. It is possible, however, to decrease the risk associated with other modules, and this same technique will apply if and when serialization is modularized.
Example of modularizing JDK 10 for Apache Tomcat 8.5.31
In this example, we will modularize a JRE to run Apache Tomcat and prune out any JDK modules that are not needed. The result will be a custom JRE, slimmed down with a decreased attack surface, that is still able to run the application.
Identify which modules are needed
The first step for many applications is to examine which modules are actually used by the application. The OpenJDK tools jdeps can perform a bytecode scan of JAR files and list these modules. Like most users, I do not know which dependencies or modules are needed by code that I did not write. As a result, I will use scanners to detect and report this information to me.
The command to list modules required by a single JAR file is:
jdeps -s JarFile.jar
This will give basic output listing the modules:
tomcat-coyote.jar -> java.base
tomcat-coyote.jar -> java.management
tomcat-coyote.jar -> not found
Ultimately each of these modules (listed on the right) should go into a module file which creates the base module of your application. This file is called module-info.java with a hyphen, indicating special treatment that does not follow standard Java conventions.
Rather than manually copy each JAR file included with Tomcat, the following chain of commands will enumerate all modules into a usable file. Run this command from the root Tomcat directory:
find . -name *.jar ! -path "./webapps/*" ! -path "./temp/*" -exec jdeps -s {} ; | sed -En "s/.* -> (.*)/ requires 1;/p" | sort | uniq | grep -v "not found" | xargs -0 printf "module com.infoq.jdk.TomcatModuleExample{n%s}n"
The output of that command will go into lib/module-info.java and look like this:
module com.infoq.jdk.TomcatModuleExample{
  requires java.base;
  requires java.compiler;
  requires java.desktop;
  requires java.instrument;
  requires java.logging;
  requires java.management;
  requires java.naming;
  requires java.security.jgss;
  requires java.sql;
  requires java.xml.ws.annotation;
  requires java.xml.ws;
  requires java.xml;
}
Looking at that module listing, it is much shorter than the entire list of Java modules.
The next step is to place this module-info into its own JAR:
javac lib/module-info.java
jar -cf lib/Tomcat.jar lib/module-info.class
Finally, create a JRE specifically for this application:
jlink --module-path lib:$JAVA_HOME/jmods --add-modules ThanksInfoQ_Costlow --output dist
The output of that command is a runtime with just enough modules needed to run the application, without any performance overhead or security risks from unused modules.
To see the list, run the command on the standard JRE and the one you just created inside the dist directory. Compared to the base JDK 10, only 19 of the core 98 modules remain.
java --list-modules

com.infoq.jdk.TomcatModuleExample
java.activation@10.0.1
java.base@10.0.1
java.compiler@10.0.1
java.datatransfer@10.0.1
java.desktop@10.0.1
java.instrument@10.0.1
java.logging@10.0.1
java.management@10.0.1
java.naming@10.0.1
java.prefs@10.0.1
java.security.jgss@10.0.1
java.security.sasl@10.0.1
java.sql@10.0.1
java.xml@10.0.1
java.xml.bind@10.0.1
java.xml.ws@10.0.1
java.xml.ws.annotation@10.0.1
jdk.httpserver@10.0.1
jdk.unsupported@10.0.1
After running this command, the application can now be run using the runtime inside the dist folder.
Looking at this list: the deployment plugin (applets) is gone, JDBC (SQL) is gone, JavaFX is gone, and so are many other modules. From a performance perspective, these modules can no longer have an impact. From a security perspective, hackers cannot attack what isn’t there. Accuracy is more important than pruning. It is important to keep modules that your application needs because if they are missing, the application will not work either.
About the Author
 Erik Costlow was Oracle’s principal product manager for Java 8 and 9, focused on security and performance. His security expertise involves threat modeling, code analysis, and instrumentation of security sensors. He working to is broaden this approach to security with Contrast Security. Before becoming involved in technology, Erik was a circus performer who juggled fire on a three-wheel vertical unicycle.
MMS • RSS
Article originally posted on InfoQ. Visit InfoQ
MvRx (pronounced “mavericks”) help Android developers implement common features and integrating their apps properly with the OS. MvRx is written in Kotlin and powers all Android development at Airbnb, writes Airbnb engineer Gabriel Peal.
MvRx provides a reactive app development framework that aims to reduce the code developers needs to write, up to 50–75% Peal says. It is based on four basic concepts:
- Immutable state, which is used to render the UI. State properties are instances of
Observable<T>and can therefore be used to trigger certain operations whenever they change. - Views, which are rendered each time a property of their associated state changes. Views can be considered ephemeral objects that are created each time their
invalidatemethod is called. Views can be associated to Fragments and responds to the Android lifecycle. A View is associated to one or more ViewModels. - ViewModels, which own the state and are used to handle the business logic of the app. ViewModels are the only objects that can modify state using
setState, which returns a new state from the current one using Kotlin’scopymechanism. ViewModels can access their state usingwithStateblocks, which are guaranteed to be executed only after all pendingsetStateoperations have completed. As mentioned, you can subscribe to state changes in a ViewModel. - Async operations, which can be associated to State property so each time a state property changes, the associated operation is carried through. Async is a sealed class with four subclasses:
Uninitialized,Loading,Success, andFail.
The following is a minimalist example of a cluster of MvRx classes that fire a network request, handles loading state, display the results, handle rotation and configuration changes:
data class MyState(val listing: Async<Listing> = Uninitialized) :
MvRxState

class MyViewModel(override val initialState: MyState) : MvRxViewModel<MyState>() {
    init {
        fetchListing()
    }

    private fun fetchListing() {
        ListingRequest.forId(1234).execute { copy(listing = it) }
    }
}

class MyFragment : MvRxFragment() {
    private val viewModel by fragmentViewModel(MyViewModel::class)

    override fun epoxyController() = simpleController(viewModel) { state ->
        if (listing() == null) {
            loaderRow()
            return
        }

        header {
            title(listing.title)
        }
        // Put the rest of your epoxy models here...
    }
}
The example above uses Epoxy, another framework from Airbnb useful to building complex screens in a RecyclerView.
There are many more aspects to consider to use MvRx at its full potential, including threading, persistence, debug facilities, so do not miss the official documentation wiki.
MMS • RSS
Article originally posted on Data Science Central. Visit Data Science Central
Several years ago, my company faced a significant challenge: A large swath of small new entrants relying heavily on data and artificial intelligence provided services faster, cheaper, and more flexibly than we could. They were not slowed down by legacy information systems, archaic business processes, and an outdated workforce. To add insult to injury, the new entrants would use our customer-facing transparency opportunistically to pick up the low hanging fruit, and gradually started to compete with us on our core practices. At the same time, other incumbent market participants had started to innovate.
In this article I would like to share our lessons learned, and discuss how data assets can both be used and should be protected, as to build a defensible competitive data advantage. This is a perspective based on my experience on capital markets and other industries that places innovative technology at the active business foreground as a critical success factor, rather than in a passive support role.
Based on my experience, I believe the questions an organization should be asking are:
- How can we leverage our data with AI?
- How do we build a data moat and protect the flanks?
As noted, a radical shift to data driven business processes was urgently needed in my organization. We had to pioneer new AI-based business processes with and for my teams quickly. We decided to set up a new production centre apart from our existing business and competitors. I decide to hire and manage a dozen persons that specifically had never studied or worked in our industry, to start with fresh and open minds. This team included a high school maths teacher, a statistician, a lawyer, an economist, a farmer, and an accountant. What they had in common was grit and competitiveness.

The above illustration shows some of my team’s lessons learned, and symbolizes how data and AI go hand in hand, wholly depend on each other to add business value, yet should strategically be directed differently. Our business goal is or should be to build on our data assets to drive organizational effectiveness. We aim to accomplish this goal whilst shaping our external data exposure in a manner that enhances product and service offerings yet greatly burdens competitors who try to copy our data, freeload on our platform, or use our public data to pick us off opportunistically.
Looking at how we build on data with AI for internal purposes, three clusters of business value can be identified. I believe leveraging data with AI amounts to making it easy to work with data, automating task execution, and using the data to leverage human talent:
AI Usability
By enhancing ease of access and the interfacing experience with (legacy) information systems, users can spend their time more effectively. Some of these usability systems are colloquially referred to as chatbots. Due to the human-natural language interaction, the user base scope is broadened, as users no longer have to express themselves in a scripted manner as pseudo-programmers. In addition, these systems can help process and present complex information. A practical example of this is how at Watergroep (a water utility) we demonstrated the value of this concept with resource management (cars and meeting rooms) through a native Dutch-speaking chatbot system.
AI automation
Now that a lot of work can be represented through data points, the domain for automation now extends to repetitive knowledge work. At the desktop level this involves automating user interface interactions through so-called robotic process automation tools. Automation is not limited to the digital realm however – for example in logistics robots are replacing human workers. In that setting drones collect visual data, which feeds supply chains and the robots that operate them. On capital markets, the equation was simple: Whereas one human can only manage roughly five repetitive and similar tasks at the same time, one algorithm could manage a virtually infinite amount at the same time – whilst never performing less than average due to a fight with the spouse, working 24/7 without hesitation, nor demanding a hefty bonus. This is why at Goldman Sachs a force of 600 traders could be scaled back to 2, a business process then supported by 200 data engineers.
AI Performance
While a lot of focus in AI has originated from its ability to cut costs, it has also demonstrated its propensity in increasing job effectiveness. This is not just the result of some tasks being automated and the resulting freed up time: The performance-enhancing potential of AI lies in its ability to reduce complexity in data sets for ad-hoc analysis, thereby preventing paralysis by analysis in the big data world. Furthermore, automatic pattern recognition coupled with notification systems can free up cognitive attention so that it can be put to overall better use. An interesting practical (and organic) implementation of such performance-enhancing AI can be found at Codorniu, where the development of the wine grapes needs to carefully controlled for temperature and rainfall influences. There, specific flowers have been selected to grow alongside the ranks that signal through their colours when conditions require intervention or attention through their blooming process. Because of this, the fields do not need to be checked in person as often.
The above three clusters of potential added value through effective use of data helps the organization in making the right decisions quicker whilst expending less resources, thereby enhancing competitive advantage. The question then remains: How do we protect our organization’s external data assets, by providing data transparency in a manner that enhances product and service offerings yet greatly burdens competitors who try to copy our data, freeload on our platform, or use our public data to pick us off opportunistically?
Dynamic Data
While we wish to be transparent to our customers and suppliers, this very same transparency can be abused by competitors that focus on price. By continuously shifting prices regardless of any internal need, we increase the amount of effort that competitors need to expend to keep their prices up to date. While these price-changes can be largely inconsequential to the average customer, being unpredictable markedly increases the amount of resources that competitors need to expend to stay up-to-date. Airlines have largely perfected this dynamic approach to keep each other guessing, although their methods are also geared towards maximizing customer revenue.
Layered Data
In the same way that reality can be layered and multi-faceted, so can your offerings be: On capital markets prices and quantities on offer are rarely firm, as they will change in a fraction of second based on individual orders coming in. An example closer to home for most readers could be a grocer’s discounted offering. Comparing products and prices becomes computationally complex when numerous variables need to be taken into account, such as tailored customer discounts, x-for-y pricing, discount conditions and variable inventory across geography. Algorithms work best when dealing with uniform data with minimal dimensions, so the point to layering is to make comparisons as difficult as possible.
Dense Data
The advent of “big data” tooling was a response to ever-increasing sizes in datasets, so that they became too large and complex to handle with traditional analytical tools and database storage mechanisms. While various solutions have been developed to manage such data and speed up queries, all this big data still needs to be ingested, stored and processed. This still involves a cost. By increasing the amount of data that the organization creates, the “barrier to entry” in required resources to participate on a playing field increases for competitors. There are only so many parties that are able and willing to drink from the data firehose.
In essence, I propose to make it as difficult, expensive, and cumbersome for competitors to collect, process, and store data on your activities, as to hinder their AI. In a world where transparency has become the norm, the new barrier to entry will not be access to data, but having the resources and competence to deal with an ever-increasing data flood.
Conclusion
I feel that the very same digital transformation that I helped pioneer on capital markets is now occuring in a variety of other industries, from agriculture to waste management. While technological progress is inherent to human development, the data and AI wave appears to be different. As a result of ever-increasing data generation, interconnectedness, transparency, in combination with the cost-effective methods to crunch, process, and work with this data, we’ve reached a point where the human cognitive task performance domain is being intruded on by AI.
Looking back at what I did with my AI “skunkworks” teams, I would have put more emphasis sooner on finding the correct incentive systems (gamification of compensation) and would also have focused earlier on aiming for quality in task performance rather than just cost reduction. With my teams I did find a new succesful way of working (and co-existing synergetically) with AI and data, which we referred to as greybox, an aspect of which is highlighted in this article. Regrets and successes aside, I am grateful that this decade of centre-stage exposure to AI has prepared me for driving digital transformations, now that I moved back to the Netherlands after 11 years abroad in various countries, and am helping out customers in a variety of industries.
AI is far from commoditized, so there is ample space and time for having it as your organization’s centre stage to build your competitive data advantage. Incumbents that intervene in time can rely on a healthy financial cushion, an established customer base, execution power through its human resources, and… data. Not just historical data, but also fresh data as generated through daily operations by employees, customers, suppliers, and interactions with competitors. This means that if you act on time you will be in a position to drive change, rather than have it imposed upon you. How will you drive your digital transformation?
About the author
Dr Roger van Daalen is an energetic, entrepreneurial, and highly driven strategic executive with extensive international management experience. He is an expert on industry digital transformations through over a decade of experience with data and artificial intelligence on capital markets and is currently working on transitions to cloud data architectures and applications of machine learning and artificial intelligence more broadly, to pioneer innovative products and services in finance and other industries as to aggressively capture market share and drive revenue growth. Feel free to reach out to him for executive opportunities in the Benelux.
This article was originally posted on LinkedIn
MMS • RSS
Article originally posted on InfoQ. Visit InfoQ
The Eclipse Foundation recently released versions 1.4 and 2.0 of MicroProfile featuring updates to the APIs and the addition of comprehensive Test Compatibility Kits (TCKs), Maven coordinates, Javadocs, and Git tags for each API. These versions are fully aligned with Java EE 7 and Java EE 8, respectively.
MicroProfile 1.4
Version 1.4, an upgrade from version 1.3, will be the last in the series of 1.x releases that include security and other enhancements to the following APIs:
- Open Tracing (add component tag to server).
- Rest Client (add asynchronous methods and better integration with other MicroProfile APIs).
- Fault Tolerance (updates to its SPI and interaction with the Metrics API).
- JWT Propagation (add support for configuring the public key).
- Config (improvements to implicit converters and security updates).
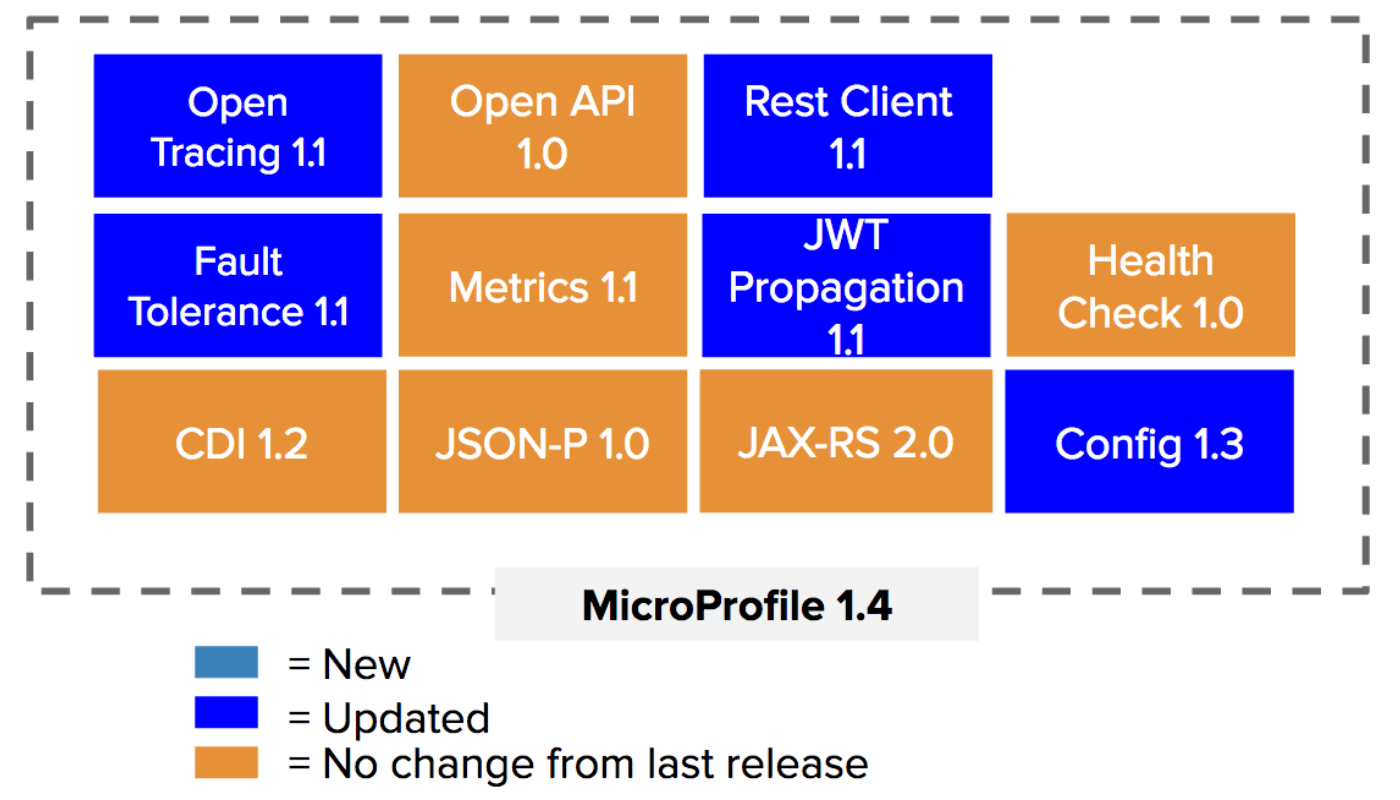
MicroProfile 1.4 is fully aligned with Java EE 7 and code examples can found on GitHub.
MicroProfile 2.0
Two years after it’s inception, MicroProfile 2.0, an upgrade from version 1.4, is the latest release that includes updates to the CDI, JSON-P, and JAX-RS APIs. Also, a new API, JSON-B, has been added for version 2.0.
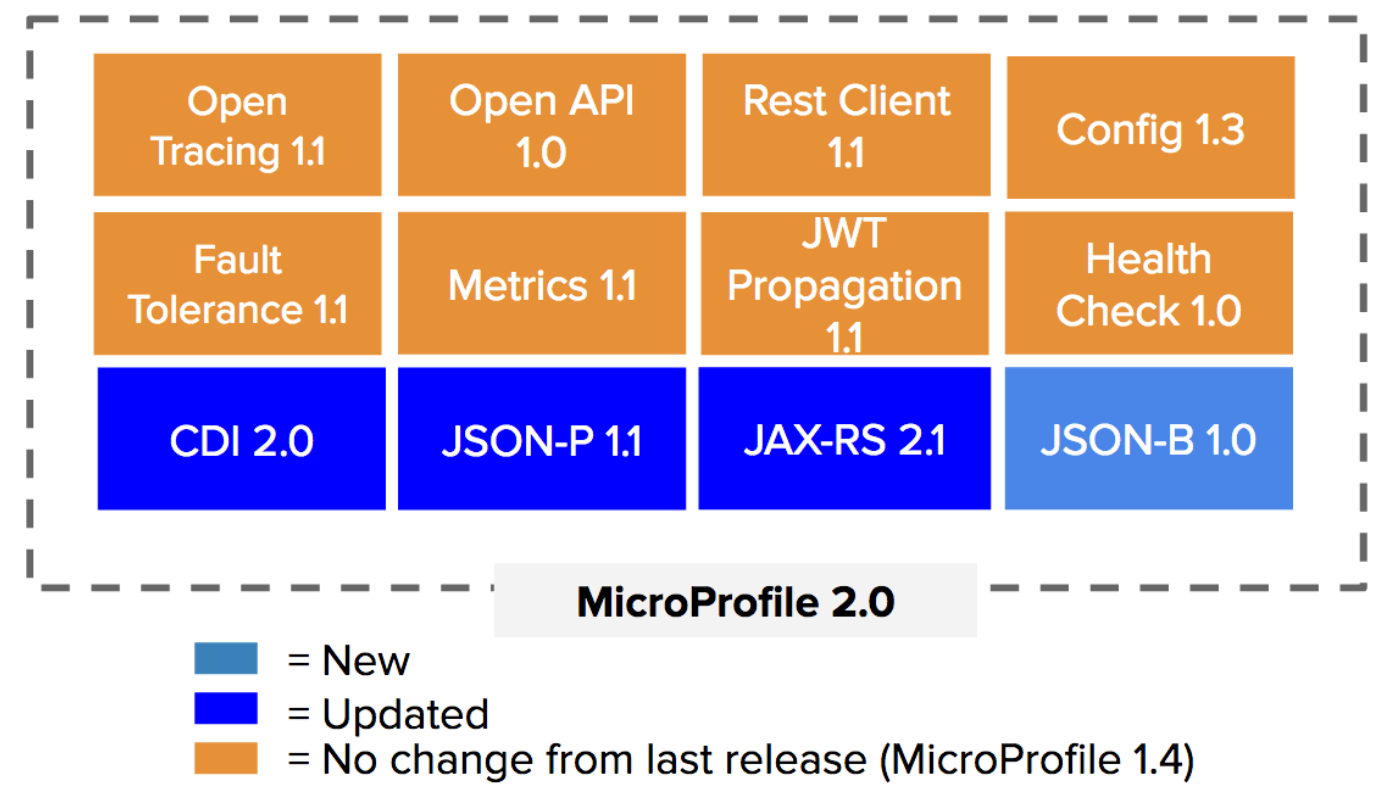
MicroProfile 2.0 is fully aligned with Java EE 8. New features include:
- New capabilities from Java EE 8 APIs.
- Improved ease of use.
- CDI-based and programmatic easy-to-use interfaces.
- More integration points among the APIs.
MicroProfile 2.0 will serve as the base for future upgrades. As stated in the release:
Eclipse MicroProfile continues to deliver additional value with each release and to successfully evolve with the dynamic help of all its community members. Future releases will update existing APIs and add new ones. As an example, the community has already started discussing the following topics:
- Long Running Actions
- Reactive Streams
- Reactive Events
- Data Access
- Event Data
MicroProfile and Jakarta EE
The synergies between MicroProfile and Jakarta EE has sparked some speculation that the two platforms could merge.
Kevin Sutter, MicroProfile architect at IBM, stated in a recent blog post:
This is one of the most common questions I get on forums, conferences—even internally at IBM. Eclipse MicroProfile is fairly well-established with several key features and releases under its belt and the future of Java EE is now being established with Eclipse Jakarta EE. When will these two forces combine? This is a difficult question.
Both of these Eclipse projects have merit and are making progress in their respective domains, with MicroProfile technologies building upon those being contributed to Jakarta EE. But are the projects themselves ready to be merged? IMHO, no. MicroProfile has grown tremendously from its humble beginnings. We have several new component features and versions that extend the Enterprise Java programming model for microservices development. And we have done this in a relatively short amount of time: Six major MicroProfile releases with sixteen component releases in less than two years.
Due to the enormity and complexities of this move, Jakarta EE is not yet ready to match this rate of progress. And, as Jakarta EE has not yet completed the definition of its specification process, it is not yet ready to accept the fast-paced release cycle required by MicroProfile. The big difference here is that MicroProfile has never tried to be a standards body. MicroProfile produces industry-accepted specifications, not standards. Jakarta EE is trying to replace the JCP Standards body with a more modern, open, and lightweight implementation-first process.
The reactive programming model effort will eventually target Jakarta EE. The team from Lightbend was looking for the best way to incorporate some of their reactive programming ideas into the Enterprise Java space. They determined that the quickest way to make some immediate progress was to develop a MicroProfile component.
Lightbend, a relatively new participating member of Jakarta EE, recently named James Roper, senior developer and co-creator of the Lagom microservices framework at Lightbend, as the first contributor to represent Lightbend on the MicroProfile team. When asked in a recent InfoQ interview on how he plans to contribute to MicroProfile, Roper stated:
My contribution (and the broader contributions of Lightbend) will primarily be around new Reactive specifications. The first thing we’ve done is help outline an approach for writing Reactive APIs and adopting Reactive features in MicroProfile. As a product of penning this approach, we identified that MicroProfile needs a Reactive Streams manipulation API, to allow MicroProfile developers to interact with Reactive Streams.
A specification for this API is well on its way to being finished. This leads into the next specification, called MicroProfile Reactive Messaging, which allows Reactive Streams based consuming, publishing and processing of messaging streams between services. This is where most of our focus is on at the moment.
Going forward, once these specs are complete, we will continue to look for ways that MicroProfile can benefit from Reactive approaches, and look to contribute in those areas. Just today the topic of MicroProfile persistence has come up, and at Lightbend we have a lot of experience solving the difficulties in persistence that don’t occur in monoliths due to using a single database with ACID transactions, so I’ve joined those discussions and will seek to bring our experience to that.
Sebastian Daschner, IT consultant, software developer and architect, stated in a recent blog post:
Since its creation, MicroProfile has gained a lot of traction and produced a variety of specifications. Originally, it was created to advance enterprise Java for a microservice world, with faster progress, driven by multiple vendors. Now, with Java EE being transformed to Jakarta EE under the Eclipse Foundation, how does MicroProfile reasonably fit into the picture within the Enterprise Java universe?
In general, it’s crucial that the Java Enterprise community shares a common, clear image what MicroProfile’s place will be in the future. Next steps in pursuing the idea of MicroProfile serving as an incubator for Jakarta EE would be to define and agree on:
- Shared technical design principles for both Jakarta EE and MicroProfile.
- Naming, branding, and namespaces for incubating MicroProfile.
- A common process for future MicroProfile projects and incubation into Jakarta EE.
Resources
MMS • RSS
Article originally posted on MongoDB. Visit MongoDB
NEW YORK, Aug. 29, 2018 /PRNewswire/ — MongoDB, Inc. (NASDAQ: MDB), the leading modern, general purpose database platform, today announced that its President and Chief Executive Officer, Dev Ittycheria, and Chief Financial Officer, Michael Gordon, will present at Citi’s Global Technology Conference in New York.
![]()
The MongoDB presentation is scheduled for Thursday, September 6, 2018, at 2:55 p.m. Eastern Time. A live webcast of the presentation will be available on the Events page of the MongoDB investor relations website at https://investors.mongodb.com/events-and-presentations/events. A replay of the webcast will also be available for a limited time.
About MongoDB
MongoDB is the leading modern, general purpose database platform, designed to unleash the power of software and data for developers and the applications they build. Headquartered in New York, MongoDB has more than 6,600 customers in more than 100 countries. The MongoDB database platform has been downloaded over 40 million times and there have been more than one million MongoDB University registrations.
Investor Relations
Brian Denyeau
ICR
646-277-1251
ir@mongodb.com
Media Relations
Mark Wheeler
MongoDB
866-237-8815 x7186
communications@mongodb.com
![]() View original content with multimedia:http://www.prnewswire.com/news-releases/mongodb-inc-to-present-at-citis-global-technology-conference-300704071.html
View original content with multimedia:http://www.prnewswire.com/news-releases/mongodb-inc-to-present-at-citis-global-technology-conference-300704071.html
SOURCE MongoDB, Inc.