Mobile Monitoring Solutions

Search
Close this search box.

IBM to Acquire Red Hat for $34 Billion

MMS Founder
MMS RSS

Article originally posted on InfoQ. Visit InfoQ

IBM announced this afternoon that it will acquire open-source software company Red Hat for $34 billion, the largest deal IBM has ever done, according to Reuters. The deal will help IBM expand its reach as an enterprise cloud computing provider.

In a joint press statement Jim Whitehurst, President and CEO of Red Hat, stated

Joining forces with IBM will provide us with a greater level of scale, resources and capabilities to accelerate the impact of open source as the basis for digital transformation and bring Red Hat to an even wider audience – all while preserving our unique culture and unwavering commitment to open-source innovation.

Ginni Rometty, IBM Chairman, President and CEO, stated “IBM will become the world’s #1 hybrid cloud provider, offering companies the only open cloud solution that will unlock the full value of the cloud for their businesses.”

In an accompanying Q&A Arvind Krishna, Senior Vice President, IBM Hybrid Cloud, states

We are committed to retaining Red Hat’s culture, leadership and practices. It’s important to remember that IBM has long been a champion of the open source community, starting with our $1 billion investment in Linux 20 years ago. With every crank of the technology cycle over the last two decades, the open source community has played a crucial development role, and that has never been more apparent than today, as companies work to shift their business applications to the cloud. Within that open source community, IBM and Red Hat have had a long and successful relationship. Between us, IBM and Red Hat have contributed more to the open source community than any other organization. And we share many common beliefs – starting with the fact that the IT world is, and will continue to be, hybrid.

Red Hat describes itself as a leading provider of open-source software and services for enterprise customers, focusing on cloud computing and Linux servers. In 2012, it became the first open-source software vendor to surpass $1 billion in revenue.

Red Hat’s last reported full-year revenue, the 12 months to February 2018, was $2.9 billion, up 21 per cent on a year ago, with profit of $259 million, pretty much flat on the year before.

IBM reported worse than expected revenue in its most recent earnings update. The company has been working to catch up to Amazon, Microsoft and Google in the cloud infrastructure business.

The deal between IBM and Red Hat is expected to close in the second half of 2019. At this point Red Hat will join IBM’s Hybrid Cloud team as a distinct unit, with Red Hat’s Whitehurst joining IBM’s senior management team, reporting to Rometty.

2018 has been a busy year for mergers, but IBM’s deal with Red Hat is by far and away the largest tech deal to be announced. It follows Microsoft’s $7.5 billion purchase of GitHub and SalesForce’s $6.5 billion acquisition of MuleSoft. Earlier this month, big-data rivals Cloudera and Hortonworks agreed to merge in a $5.2 billion deal.

Subscribe for MMS Newsletter

By signing up, you will receive updates about our latest information.

  • This field is for validation purposes and should be left unchanged.


Weekly Digest, October 29

MMS Founder
MMS RSS

Article originally posted on Data Science Central. Visit Data Science Central

Monday newsletter published by Data Science Central. Previous editions can be found here. The contribution flagged with a + is our selection for the picture of the week.

Featured Resources and Technical Contributions 

Featured Articles

Picture of the Week

Source for picture: contribution marked with a + 

To make sure you keep getting these emails, please add  mail@newsletter.datasciencecentral.com to your address book or whitelist us.  

  Hire a Data Scientist | Search DSC | Find a Job | Post a Blog | Ask a Question

Subscribe for MMS Newsletter

By signing up, you will receive updates about our latest information.

  • This field is for validation purposes and should be left unchanged.


The Future of Java is Today: CodeOne (née JavaOne) Keynote Highlights

MMS Founder
MMS RSS

Article originally posted on InfoQ. Visit InfoQ

Following from previous JavaOne events, the inaugural Oracle CodeOne 2018 was recently held in San Francisco, USA. Headline announcements in the Monday night keynote, titled “The Future of Java Is Today”, included: the new six-monthly Java/JDK release cadence is proceeding as planned; Oracle (and many other organisations) are continuing to support and contribute to Java; and there are several new OpenJDK projects exploring productivity-enhancing language features like raw String literals, fibers and continuations, and foreign-function and data interfaces.

After a brief welcome from Georges Saab, Vice President of Software Development for the Java Platform Group, the first presenter to the stage was Matthew McCullough, VP of Field Services at GitHub. He empathised the importance of OpenJDK, the open source reference implementation of the Java platform, and discussed “Project Skara“, a prototype GitHub-based mirror of the official OpenJDK upstream Mercurial repositories.

The goal of Project Skara is to investigate alternative source code management and code review options for the JDK source code. McCullough also discussed that most “software of consequence” is developed through global collaboration, and encouraged the audience to get involved with open source projects. A brief demonstration of the several new GitHub features that facilitate this goal were demonstrated.

It is worth noting that the work in Project Skara is early-stage and currently separate but loosely aligned with the community-driven AdoptOpenJDK project, which is also mirroring upstream OpenJDK repositories and offering builds of all recent and future JDK versions along with the goal to offer four years of builds and best-effort community support for Long Term Support (LTS) versions of Java (which includes the recently released Java 11). Commercial backing for the AdoptOpenJDK project includes IBM, Azul Systems, the LJC, Microsoft, Ocado Technology, and Packet.

Saab returned to the stage and discussed about “preserving Java’s virtues”. Java continues to be free and open, and the community is committed to delivering ongoing platform completeness and investing in developer productivity and compatibility. There is also continuing investment in quality and security, and preserving open and transparent development.

Moving on to Oracle’s contributions, Saab presented the recent open source release of several previously commercial Java platform features: in Java 10 this included Application Class Data Sharing (ACDS); and in Java 11 this included: Project ZGC (low latency GC for multi-terabyte heaps), Flight Recorder and Mission Control (for diagnostics and monitoring).

The new six-month release schedule has also been successfully delivered, which provides incremental improvements to the Java platform, and allows developers access to new features sooner, with “no more disruptive major releases” (if a scheduled feature misses the release deadlines, it simply gets moved to the next release). Saab briefly touched on the new LTS release and Oracle support model, of which there has been much confusion within the community (and InfoQ have recently covered a related “Java is Still Free” Java Champion statement on this topic).

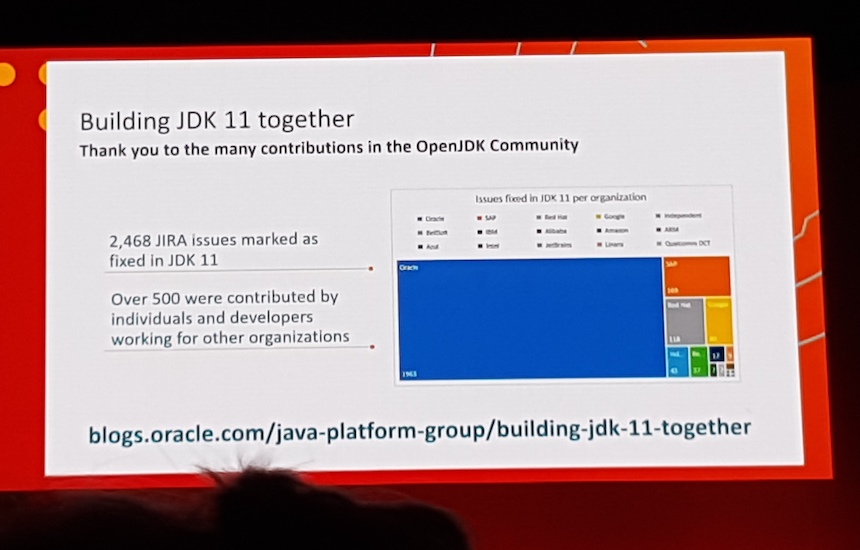
This section of the keynote was concluded with a thank you to the many contributors within the OpenJDK community, and a mention of several Oracle-funded Java community support programs, including the Java Magazine, Java User Groups, Java Champions, jDuchess Program, Oracle Academy Student Outreach, and the Java Community Process (JCP).

Building Java together

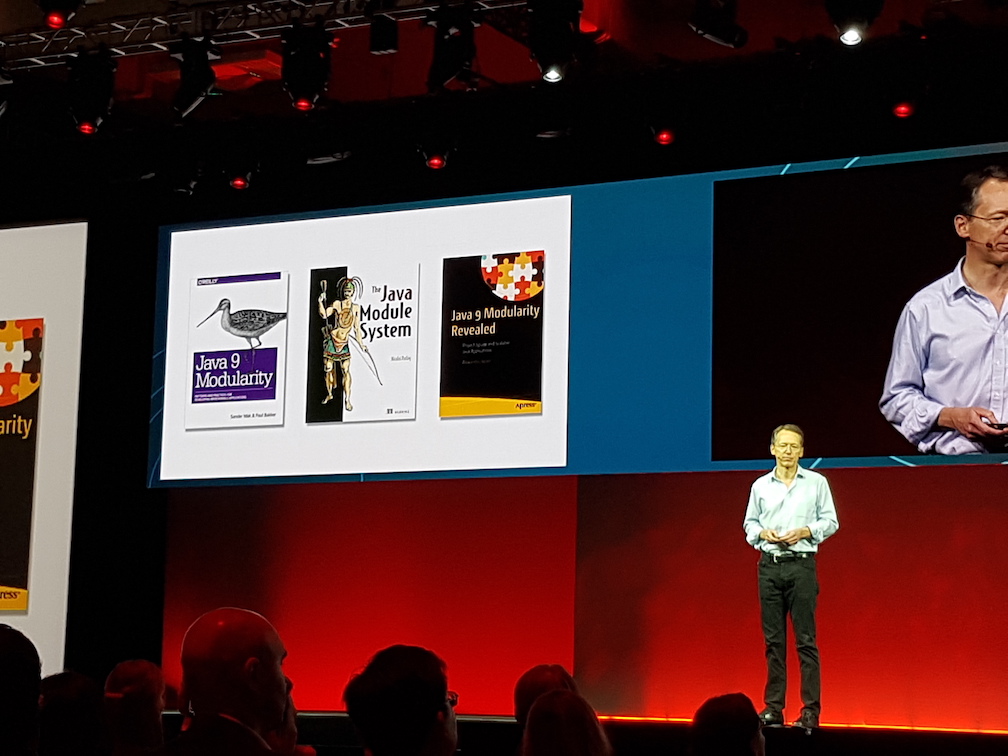
Next to the stage was Mark Reinhold, Chief Architect of the Java Platform Group at Oracle, who began by reminding the audience how much of a challenge it has been to move to the new Java module system (JEP 261), as this required much re-writing of internal components. However, since the release of this functionality within Java 9, the uptake has been good, and benefits are starting to be realised. Reinhold encouraged every Java developer to take a look at the new functionality, and recommended several books to get started.

Java 9 Module books

The new modular architecture has allowed the platform release cadence to improve, and echoing the earlier comments made by Saab, Reinhold discussed the successful on-time delivery of both Java 10 and Java 11, and also the impact the LTS releases will have (which primarily relates to the offering of commercial support from Oracle, although other vendors and AdoptOpenJDK plan to offer alternative builds and community-driven and commercial support models).

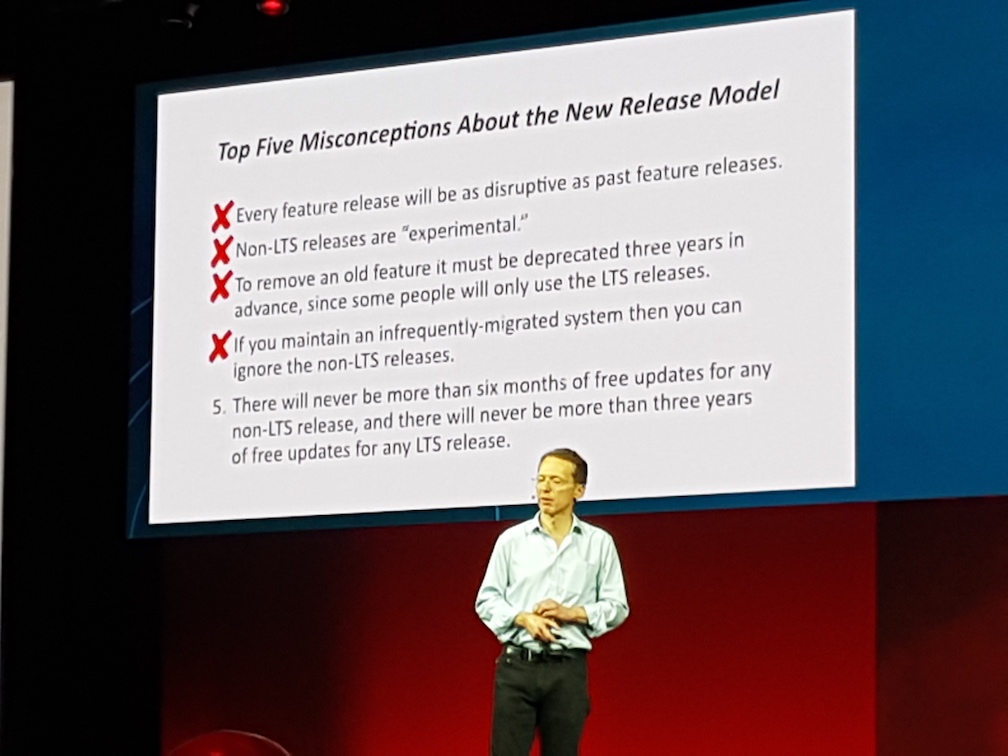
A core message from this section of the keynote was that “Java is still free” and that Oracle JDK is very similar to the OpenJDK builds (especially for the first six months of an LTS release, although builds may start to diverge after this date depending of what security and bug fix patches get released into the upstream OpenJDK repositories). Reinhold presented his “top five misconceptions about the new release model”, which included the incorrect belief that non-LTS releases are experimental, and if you maintain an infrequently-migrated system that you can ignore the non-LTS releases.

He also discussed the community efforts of testing open source projects with the latest Java releases, and mentioned the Twitter hashtags #WorksFineOnJDK9 and #WorksLikeHeavenOnJDK11. All developers using Java 9 or later were strongly encouraged to upgrade to the latest versions of all of their tools and dependencies.

Top five misconceptions Java LTS

Next, Reinhold changed gears and began looking towards the future. Java 12 / JDK 12 currently has four JEPs (so far) associated with it, including a (command line flag enabled) preview of new switch expressions and raw string literals, and “One AArch64 Port, Not Two” and default CDS archives. Empathise for several future features is being placed on developer productivity and program performance “in the face of constantly-evolving programming paradigm, application areas, deployment styles and hardware”.

The final section of the keynote focused on four new projects within the OpenJDK:

  • Amber: “Right-sizing language ceremony”, including local variable type inference, raw string literals that do not require escape sequencing
  • Loom: “Continuations and fibers”, including the removal of old “meaningless” or broken Thread-related API methods, and the addition of fibers as “lightweight, efficient threads managed by the Java Virtual Machine, that let developers use the same simple abstraction but with better performance and lower footprint”
  • Panama: Non-Java foreign-function and data interfaces, including native function calling from JVM (C, C++), and native data access from JVM or inside JVM heap
  • Valhalla: Value types and specialised generics

Reinhold presented a series of live-coding demonstrations with the latest (unreleased) Java 12 build, examples of which can be found on the respective project websites linked above.

Community reaction to the Java keynote was generally positive, with Paul Bakker stating “Excellent keynote at #CodeOne! And for good reason, [the] #java ecosystem looks better than ever.” and Chris Hegerty commenting “Excellent #Java Keynote at #CodeOne, especially the technical section by [Mark Reinhold]”.

The full video recording of “The Future of Java is Today” keynote can be found on the Oracle Developers YouTube channel. 

Subscribe for MMS Newsletter

By signing up, you will receive updates about our latest information.

  • This field is for validation purposes and should be left unchanged.


Challenge of Confirming Program Efficacy

MMS Founder
MMS RSS

Article originally posted on Data Science Central. Visit Data Science Central

Something that has always troubled me with statistics is the pretense of certainty.  The conclusions – being closely associated with calculations – tend to be reached rapidly.  I might only be starting to give a problem some thought – although a statistician has already drawn conclusions.  Over time, this can make a person feel insecure about his intellectual capacity – and perhaps cause him to write a blog on the subject.  Consider the simulated data below:  a special program was implemented by a fictitious organization near the middle of the data collection period.  The question is whether this event or change contributed to an increase or decrease in sales.  The scale for sales in units is on the y-axis.  I will advise readers in advance – since this is a controlled simulation – that in fact the change contributed to an increase in sales.  However, there is clearly a downtrend in sales.  How can my assertion be correct?

I offer below the section of code that gave rise to the aggregate data.  In real life, sales can be affected by many factors.  Some factors might include the following: 1) the persuasiveness of the agent; 2) their handling speed and proficiency; 3) usual willingness of the market to be persuaded; 4) usual seasonal changes in the size of the market; and 5) the effectiveness of marketing campaigns.  Given the pinpoint suddenness of the implementation, it is reasonable to regard this scenario as a marketing campaign to increase sales.  (The impact of marketing on sales could be tested by determining how many clients were exposed to the marketing; how many of them subsequently entered into a sales contract; and the extent to which the rate of success differs from the ambient.  However, I don’t plan to get into this depth of analysis.)

In this simulation, based on the code above, there are five variables giving rise to the sales data.  The marketing campaign occurs in the middle of the data.  The marketing campaign is successful: note how b5 is increased by 0.05 per cycle from the 150th day of operation onward – thereby making increases in v5 more likely.  Consequently, if a statistician after examining the superficial metrics at the beginning simply said that the campaign is unsuccessful, this individual would be incorrect.  Yet I admit that it is challenging to determine how improvements to v5 can be determined from the sum of v1, v2, v3, v4, and v5.  The point I want to make in this blog is that although this is a business problem – it is not actually a mathematical problem.  The main challenge is deconstruction:  ascertaining which aspects of operations to recognize as relevant or significant in relation to the metrics in question.

The good news is that the real work – where a human should get paid to do the job – is extremely difficult for a computer to do.  The work done by a machine can and likely will be done by a machine.  People probably won’t get paid to do that kind of work much longer.  I recognize that there might be a great deal of conflation, confusing the non-creative process of calculation with the high levels of creativity needed to solve the business problem.  Before I begin to stray from the point at hand, let us consider the how the different contributing metrics appear together on a chart.  Since this is a busy chart for sure, I would focus on the trendlines.

I isolated v5 on the chart below.  I also applied a polynomial trendline to show that simulation is working as intended.  The implementation of the program therefore is indeed beneficial to v5.  The best course of action, assuming the costs do not exceed the benefits, is to continue the program.  Halting the program would likely reduce the number of units sold by the company – thereby adding to its already declining sales.  While the program does not stop the decline, it reduces the overall pace of that decline.

For me, one of the most straightforward ways to determine the effectiveness of a program on a particular component of sales is simply by comparing averages (refer to the bar chart below).  I haven’t found a perfect approach.  In real life, it is unlikely that the program or a single aspect of it exclusively brought about the change in sales.  For example, maybe the focal point should be the marketing period (dates of advertising); the location of the target audience; the specific manner of advertising; the particular incentives being advertised; or the type of audience.  We therefore don’t leave it at, “Yes, the campaign was effective.”  It would be better to say, “We need to determine what specific aspects of the campaign were effective.”

It is possible for an advertising campaign to stop working.  There is a constant need to obtain fresh data, to do new analysis, and to speculate on the best courses of action.  Doing some kind of super-computer calculation – as if the outcome is definitive, absolute, and unchanging – seems far from prudent.  So with all due respect to super-computer enthusiasts, there are limits to how far these powerful tools can be applied.  The multi-dimensionality of business problems creates a need for creativity – maybe making use of different levels of thinking.  The calculations might be important to the problem as it is posed.  But the problem as it is posed might be unrelated to the solution.  The posing of the problem – its recognition, attribution, construction, and articulation – might in itself add distance to the solution, making it inaccessible no matter how many calculations are performed.

Subscribe for MMS Newsletter

By signing up, you will receive updates about our latest information.

  • This field is for validation purposes and should be left unchanged.


Article: Service Delivery Review: The Missing DevOps Feedback Loop?

MMS Founder
MMS RSS

Article originally posted on InfoQ. Visit InfoQ

Key Takeaways

  • Tech organizations need not only the ability to change (agility) but to change in the right direction (fitness for purpose).
  • Organizations need a mechanism to be able to continuously measure how well they are fulfilling the customer’s reason for choosing them.
  • Several reliable feedback loops exist for understanding product fitness, but not many exist for service-delivery fitness.
  • In service-driven age, service-delivery fitness is an increasingly important selection criterion for customers.
  • The service-delivery review is a feedback loop that facilitates a quantitatively-oriented discussion between a customer and delivery team about the fitness for purpose of its service delivery.

In today’s digital-service economy, IT organizations need not only the ability to change but to change in the right direction. That is, they need to be able to sense and respond to feedback in order to continuously recognize and measure gaps in their understanding of the customer’s view of their fitness for purpose.

Certainly, the standard agile feedback loops — product demo, team retrospective and automated tests — provide valuable awareness of product health and fitness. Yet many teams and stakeholders struggle to find a reliable way to understand an important area of feedback: the fitness of their service delivery. 

This article introduces the service-delivery review as the forum for this feedback.

Digital organizations need the ability to sense and respond to customers

As Jeff Sussna writes in his book Designing Delivery, service providers must make promises about listening and responding as much as making and delivering. The marketplace changes so rapidly that what worked five years or even five months ago may be obviated without notice. Before you know it, your team or organization is no longer fit for the purpose it once served (see Blockbuster, Kodak, etc.). Above all — beyond well-intentioned mission and purpose statements — Sussna notes that organizations exist in order to continue to exist. That is, we’re in business to stay in business. Therefore, organizations must continuously seek to understand why their customers are choosing them. But don’t simply assume our customers — which can be internal as well as external — choose us for the quality of our products. How can we assess the less tangible aspects of our work?

What are Services? Seeing your organization with the “Kanban” lens

Part of the difficulty stems from seeing our organizations only in terms of product. But organizations usually have a service component as well. Even something as ordinary as a coffee shop is more than a product: in audience polls during my conference talks, an overwhelming amount of people consider Starbucks not a product or service business but both. 

The same is true of technology organizations. This becomes easier to understand if we apply what Rodrigo Yoshima and Andy Carmichael call the “kanban lens. The kanban lens is a way to “see” your work, specifically:

  • Work as flow
  • Knowledge work as a service
  • Organizations as networks of services

When you “put on” the kanban lens, as if you were wearing a special set of superpowered goggles, you move from seeing the traditional org chart to seeing services everywhere in your organization. You move from seeing people ops to customer-facing delivery work!

Services are everywhere, if we only have the lens to see them. Regrettably, we often notice them only when they are dissatisfying. Not long ago, I “discovered” an internal service in my organization: my team created a presentation to give to leadership, so we wanted it to look polished. Unfortunately, none of us had visual-design chops, so we requested someone from our design team to help. The reply was “Is there a due date?”. We didn’t have a deadline (yet), but we also had no idea when our understandably busy colleagues would be able to turn it around. This is clearly a (design) service for internal customers who have an idea of what makes it fit for their purpose. In this case, it was a reliable turnaround time.

We all make requests of individuals and teams all the time. But without a mutual exchange of information — for example, expected delivery speed — we’re going to pad our requests with extra time or fake deadlines. In the absence of any quantitative feedback about the performance of our service delivery, arbitrary due dates and artificial boundaries are always going to persist. In the story of my organization’s design service, our exchange would have been much easier — and questions of expectations would have been more productive — if we had transparent and quantitative delivery data. This in turn, would have fostered trust.

Thinking about service delivery in terms of fitness for purpose

What does fitness for purpose of service delivery mean?

First, does the team and stakeholders know what their customer values about their service?

Second, do they know how to measure it?

Third, is there a regular feedback loop to assess service fitness in the eyes of the customer? 

Asking the fitness question once — why have you chosen us, and what do you value about the service we provide? — is good but that answer may change over time. More often than not, teams do not have an ongoing way to measure if, and how well, their service aligns to that selection criteria over time. 

Dimensions of Delivery 

I’ve often used the restaurant metaphor to describe the difference between product and service delivery: when you dine out, you care not only about the food and drinks (product) but also about how the meal is delivered to you (service delivery). That “customer” standpoint is one dimension of the quality of these components — we might call it an external view. The other is the internal view — that of the restaurant staff. They, too, care about the product and service delivery, but from a different perspective: is the food fresh, kept in proper containers, cooked at the right temperatures? And do the staff work well together, complement each other’s skills, treat each other respectfully? 

So we have essentially two pairs of dimensions: component (product and service delivery) and viewpoint (external customer and internal team).

In software delivery, we have feedback loops to answer three of these four questions. We also have more colloquial terminology for that internal-external dimension (“build the thing right” and “build the right thing”). Can you guess which one is missing?

Feedback loops like retrospectives and standup meetings provide valuable feedback on the internal workings of our teams. But these often occur without reference to customer’s concerns. I’ve worked with countless teams who got on well with each other and enjoyed working together, but otherwise were clueless as to how the customer expected them to deliver. Retrospectives can tend to turn inward and focus on “not-enough-muffins” problems that concern only the team. Enough muffins is important, to be sure (!), but the customer couldn’t care less. 

The problem is that we typically don’t have a dedicated feedback loop for properly understanding how fit for purpose our service-delivery is. And that’s often equally the most vital concern for our customers — sometimes even more important than the fitness of the product. We may touch on things like the team’s velocity in the course of a demo, but we lack a lightweight structure for having a constructive conversation about this customer’s concerns with the service.

The Service Delivery Review as the missing feedback loop

I first came across the idea of the service delivery review from the Kanban method, which includes it as one of its seven feedback loops to drive evolutionary change. I’ve been incorporating this to help answer teams’ inability to have the conversation around their service-delivery fitness, and it appears to be providing what they need in some contexts.

I define the service delivery review much in the same way as David Anderson did in 2014, with minor tweaks:

A regular (for example, fortnightly) quantitatively-oriented discussion between a customer and delivery team about the fitness for purpose of its service delivery.

During the review, teams and customers might discuss any and all of the following:

  • Delivery speed: How fastare we delivering work items? Scatterplot charts can show the delivery times (aka cycle times, time in process) of recent work. And how predictableare we? Delivery-time distribution can quantify our predictability.

Figure: scatterplot chart example

Figure: delivery-time distribution example

  • Delivery throughput: How muchwork are we delivering? For example, is our typical range of between three and five user stories per week acceptable?
  • Mix of work: Is everyone satisfied with the allocation we’re giving to various work types? For instance, is a 10% allocation of effort to removing technical debt acceptable?
  • Policy changes: What kind of treatment do we give to various types of requests? Do different stakeholders expect differing treatment? What policies are we following that we haven’t made explicit? Are our various classes of service supporting the expected speed and predictability thresholds? 
  • Due-date performance: For those items that are truly deadline-oriented, how well have we done meeting those dates (fixed-date misses)? What is an acceptable success rate, what do we need to do to achieve that and what is the cost of that level of performance?
  • Front-line data: Input from fitness surveys (for example., F4P box score), front-line staff reports, and social media.
  • Obstacles: What things stand in the way of our service-delivery expectations? One way to quantify this is through the practice of blocker clustering, a technique popularized by Klaus Leopold and Troy Magennis that leverages a kanban system to identify and quantify the things that block work from flowing; review the results and remediations.

These are not performance areas that teams typically discuss in existing feedback loops, like retrospectives and demos.  Yet they’re quite powerful and important to achieve a common understanding of what customers value the most. 

In my experience, they will uncover some of the most (unnecessarily) painful misunderstandings. For instance, are we producing the amount of work expected? If it’s too much, we might consider moving some capacity elsewhere. If it’s not enough, why might that be, and is this an opportunity to segment our delivery differently? For example, we might intentionally decide to accept lesser service thresholds as a tradeoff for other business investments, such as capability building, while doing the opposite for high-demand services.

Moreover, because they are simultaneously quantitative and fitness-oriented, service-delivery reviews help teams and customers build trust together and proactively manage toward greater fitness.

Getting Started with Service Delivery Reviews

Service-delivery reviews are relatively easy to do, and in my experience provide a high return on the time invested. The prerequisites are:

  • Know your services
  • Discover or establish service-delivery expectations

Janice Linden-Reed very helpfully outlined in her Kanban cadences presentation the practical aspects of the meeting, including participants, questions to ask and inputs and outputs, which is a fine place to start with the practice.

I’ve also developed a customizable canvas that provides a template for inputs and outputs of the meeting. The specific implementation is less important than being clear about the purpose of the meeting, required audience and facilitator, inputs, outputs and outcomes. In my experience, the canvas can also include probabilistic forecasts of completion times, risks and blockers. 

If you’re starting at a more fundamental level — discovering those fitness criteria, for instance — you might even try a “Yelp review,” a fun activity that I’ve conducted with customers to enable them to think in both product and service terms by asking them to write a Yelp-style review from the future based on their experience with the team. For instance, one stakeholder discovered and shared his own unspoken interest in being contacted and brought in when work took longer than expected. In the same way that a futurespective helps teams by visualizing possible scenarios, by writing his “review” in advance, he gave the team an understanding of his unvoiced expectations of their fitness, which they then managed in service delivery reviews.

The benefits of service-delivery reviews

I’ve worked with many high-performing teams who deliver amazing digital products and yet are surprised when their customer is dissatisfied. It’s often because they had either a) no sense of what made their service delivery fit in the eyes of their customer or b) no feedback loop to regularly and quantifiably measure that fitness. One executive that I worked with even noted that he would rather attend a service delivery review than a product demo, because the service delivery was something that he and the team could more directly improve through team composition and other organizational changes.

Specifically, the service delivery review benefits organizations because it:

  • Forces you to focus on customersand become fit for the purpose for which they chose you. Story points aren’t representative of customer’s fitness, or selection criterion. No one hired your team because of their amazing velocity
  • Sets clear standards and achievements
  • Generates feedback with (meaningful) data
  • Helps you understand why you fail and then align improvement efforts
  • Builds customer trust and loyalty

Additionally, many organizations are undergoing some kind of so-called “agile transformation”, sometimes simply adhering to ceremonies. Andy Carmichael encourages organizations to measure agility by fitness for purpose rather than practices adoption. The service delivery review is a feedback loop that explicitly looks at this. Multiple service delivery reviews then feed upward into a regular operations review, which takes service delivery input and gives managers a higher-order decision-making viewpoint: Based on our organizational (or departmental) goals, do some services need more capacity, and if so which need less and can provide supply? What system-level patterns are we seeing that we can resolve for multiple services? Some organizations have answered the scaling question through installing frameworks like SAFe; the combination of service-delivery reviews, operations reviews and fitness-for-purpose thinking is an alternative that allows organizations to continually improve each service toward greater fitness while creating the mechanism for ongoing sensing of the customer’s fitness expectations.

Ultimately, organizations and teams need some way to sense and respond to their customers, both external and internal. In their book Fit for Purpose, David Anderson and Alexei Zheglov assert that:

“The tighter you make your feedback loops, the greater agility you can exhibit as a business, the faster you can sense and respond.”

About the Author

As a capability cultivator, organizational fitness coach and workplace activist, Matt helps organizations and teams continuously become fit for their purpose. He is especially passionate about building learning organizations and creating humanizing and engaging work environments. You can follow him at @mattphilip.

Subscribe for MMS Newsletter

By signing up, you will receive updates about our latest information.

  • This field is for validation purposes and should be left unchanged.


Top 25 Mistakes Corporates Make in their Advanced Analytics Program

MMS Founder
MMS RSS

Article originally posted on Data Science Central. Visit Data Science Central

Raise your hand if your company is making more than 15!

Strategy:

1. Day-dreaming that analytics is a plug & play magic wand that will bring very short term ROI. Well executed basic excel models might have brought quick wins in the 2000s but advanced analytics requires some time. Analytics is never plug & play because plugging data into models is extremely lengthy, because learnings are not transferable across companies or markets and because they require a high OPEX in people and high CAPEX in systems.

2. Solving problems that are not really worth solving, which results in a waste of time and resources. Analytics is not about solutions looking for problems but problems looking for solutions. Questions such as “What can we do with blockchain?” do not make sense. “How can I solve my marketing problem” is a question that makes sense. The worst mistake of the Chief Data Analytics Officer is not having an extremely clear view of what key challenges and opportunities each functional area is confronted with.

3. Relying solely on vendors or consultants for analytics, especially on model creation. The post-mortem of how corporates fail developing capabilities with consultants is as follows: the client hires a consultant to deliver a project and at the same time develop internal capabilities. The client has far too unrealistic expectations about the impact of the project and consultants never say “No” and oversell the project. The impact does not materialize and one day the client tells the consultant “If you do not get some impact in the next month, I will stop your contract”. That day capability development officially dies, if it had ever existed. RIP. A few million dollars in the trash bin. Anyway, analytics is the brain of the company. How could corporates even think they could outsource it? working with vendors and consultant can work but the governance needs to be thought through.

4. Not developing a fully comprehensive list of priorities. Since you can only count with five fingers in one hand, therefore Management should pick at most five metrics rather than making everything seems important.

5. Saying yes to random requests, like pet projects or glamorous visualizations and reporting which often result into analysis-paralysis syndrome.

6. Assuming that abstinence from external data monetization or from cloud is the solution to data privacy and security. While there are some regulatory restrictions in some industries and countries, and sometimes even ethical limits, external monetization and cloud done properly do not necessarily involve security risks.

People:

7. Organizing analytics under functions which do not drive the business on a daily basis such as IT or strategy. Analytics is only powerful if it is coupled organizationally with daily operations.

8. Letting multiple analytics teams flourish with organizational siloes among them. Analytics needs to keep an integrated view of the business.

9. Attracting talent only through base compensation. Instead it is necessary to build a sense of purpose, to create a powerful employer brand and to develop internal talent.

10. Hiring a bunch of PhDs who strive to develop highly nuanced modelsinstead of directionally correct rough-and-ready solutions, hence they fail to prove actionable insights. So, hire highly coachable fast learners (even if they hold a PhD) .

11. Hiring a technical Chief Data Analytics Officer or hiring a non-technical Chief Data Analytics Officer. Instead he needs to be both: technical enough to coach his team and business-driven enough to understand business problems.

12. Not bringing domain experts and internal business consultants to the analytics teams to bridge the gap between business leaders and analytics teams to ensure an end-to-end journey from idea to impact.

13. Neglecting the creation of a data-driven culture through active coaching across the whole organization from sales agents to the CEO, especially sales agents and the CEO.

14. Not being objective enough and remaining biased to the status quo or leadership thinking. Analytics teams deeply embedded in business functions or BUs are more likely to have these troubles than centralized ones. This is why some organizations create quality control teams.

Execution:

15. Not embedding analytics in the operating models and day-to-day workflows. This will result in a failure to integrate technology with people.Using analytics as part of their daily activities helps users to make data-focused judgement, to make better-informed decisions, to build consumer feedback into solutions and to rapidly iterate new products, instead many are still relying on gut feelings and Hippos on decisions (Highest Paid Person Opinions)

16. Not collocating data scientists with the business teams they support. Otherwise they will not talk to each other.

17. Managing analytics projects in waterfall. Parameters of a model cannot be known upfront. They are determined through an iterative process which looks more like an art than a science. Therefore analytical projects need to be iterative by following, for example, the Agile Framework.

18. Not being able to scale analytics pilots up. Analytics often starts piloting use cases Companies often end up killing pilots as soon as they need to reallocate funding for other shorter-term initiatives.

19. Neglecting data governance as a fundamental enabler. Data governance refers to the organization, processes, and systems that an organisation needs to manage its data properly and consistently as an asset, ranging from managing data quality to handling access control or defining the architecture of the data in a standardized way.

Technology:

20. Trying to create data science models without refining your data engineering infrastructure: cleaned repositories, efficient engines and streamlined extract-load-transfer processes. Data engineering without real use cases to model is also wrong. Both modelling and engineering must go in parallel or in an iterative way.

21. Not using any of the following basic technologies: Hadoop, Spark, R, Python, an advanced visualization tool of your choice, and a granular self-service reporting system open for the whole organization.

22. Having technological siloes among data repositories which makes it difficult to integrate different kinds of data into a model. The power of analytics increases exponentially with the diversity of data.

23. Not automating analytics through A.I., which can be an extremely smart assistant to data scientists. A.I. automations help data scientists to cleanse data, to check for correctness, to deploy models, to detect relevant prediction features and obsolescence of models, or even to generate hundreds or thousands of variations of models. All in all, the analytics strategy of the business has to be a subset of the whole A.I. strategy since the datasets needs to feed the A.I systems.

Finance:

24. Not allocating enough budget for analytics platforms, but yet still keeping Shangri-La dream expectations. And the opposite is also an error, allocating more than enough money which have no direct correlation to business outcomes.

25. Not measuring the ROI of analytics initiatives. We know ROI is mid-term but that does not mean you do not measure it.

Disclaimer: Opinions in the article do not represent the ones endorsed by the author’s employer.

About the author:

Pedro URIA RECIO is thought-leader in artificial intelligence, data analytics and digital marketing. His career has encompassed building, leading and mentoring diverse high-performing teams, the development of marketing and analytics strategy, commercial leadership with P&L ownership, leadership of transformational programs and management consulting.

Subscribe for MMS Newsletter

By signing up, you will receive updates about our latest information.

  • This field is for validation purposes and should be left unchanged.


Mongodb (NASDAQ:MDB) Now Covered by DA Davidson

MMS Founder
MMS RSS

Posted on mongodb google news. Visit mongodb google news

Article originally posted on mongodb google news. Visit mongodb google news

Subscribe for MMS Newsletter

By signing up, you will receive updates about our latest information.

  • This field is for validation purposes and should be left unchanged.


One Trillion Random Digits

MMS Founder
MMS RSS

Article originally posted on Data Science Central. Visit Data Science Central

You will find here a few tables of random digits, used for simulation purposes and/or testing or integration in statistical, mathematical, and machine learning algorithms. These tables are particularly useful if you want to share your algorithms or simulations, and make them replicable. We also provide techniques to use in applications where secrecy is critical, such as cryptography, bitcoin or lotteries: in this case, you don’t want to share your table of random numbers; to the contrary you want it to be secret and impossible to reverse-engineer. 

Let’s start with the largest table: one trillion digits, which takes 50 hours to download. You need to make sure you have enough disk space to store it. It consists of the first trillion digits of Pi, and it has passed all existing tests of randomness. To this date, no pattern has ever been found in that sequence. The table can be found here. Details about how these digits were computed can be found here and here.

An excellent book focusing on this problem is Mathematics by Experiment, written by Jonathan Borwein and David Bailey. Another book with a different, original perspective, is my book entitled Applied Stochastic Processes, Chaos Modeling, and Probabilistic Properties of Numeration Systems, available here

Another approach for random number generation is to use the Mersenne twister. Its period is 2^19937 – 1. Or you may check out this website. Note that the digits of Pi do not have a period; in short, the period is infinite. Random digits based on physical phenomena have biases due to measurement errors, though these biases are so small that they do not matter.

More accessible tables of random digits

The following can easily be downloaded using the links below.

  • 10 million digits of SQRT(2) in base 10. These are just as random of the digits of Pi. No formal proof of this fact exists; the most recent material on this topic is published here and here. You can download these digits here
  • 1 million digits of SQRT(2) in base 2. You can download these digits here.

I have performed some statistical analyses on these digits, see here. Simple formulas to compute these digits exist, see for instance here (read the last sentence in that article.) Testing whether digits are random or not, is further investigated in my free book, particularly in chapter 13. More can be found here

Internet tools such as WolframAlpha can be used if you only need a small table. In particular, my 1 million digits table was produced interactively using SageMath.org. Instructions on how to do it are provided here.  For more interactive calculators (for statisticians), check out this website

Random digits for strong encryption

This topic is discussed at length in my free book published in June 2018. I still continue to work on this, and recently came up with some original concept, described below. You may use a numeration base that is not an integer to increase security, as described in my book, but even with a standard integer base such as binary or decimal digits, the following can be very useful.

Instead of considering the digits a(n) of a real number as being indexed by integers, consider extending the concept to values of n that are real numbers themselves. Then you use digits of Pi in positions that are not integers, say digits of Pi in positions SQRT(2), SQRT(3), and so on, rather than digits of Pi in positions number 1, 2, and so on. This is done as follows: 

Here x is the number we are interested in (say x = Pi), b is the base, and a(n) is the n-th digit of x in base b. It corresponds to standard digits if n is an integer (assuming b is an integer), and non-standard digits if n is a real number, not an integer. The above formula, easy to prove, comes from Chapter 10 in my book

Another context in which random digits (that can not be guessed), are required, is with lotteries. It is illustrated in this article.  

For related articles from the same author, click here or visit www.VincentGranville.com. Follow me on on LinkedIn, or visit my old web page here.

DSC Resources

Subscribe for MMS Newsletter

By signing up, you will receive updates about our latest information.

  • This field is for validation purposes and should be left unchanged.


Scaling Global Traffic at Dropbox With Edge Locations and GSLB

MMS Founder
MMS RSS

Article originally posted on InfoQ. Visit InfoQ

The Dropbox engineering team shared their experience of architecting and scaling their global network of edge locations. Located around the globe, these run a custom stack of nginx and IPVS and connect to the Dropbox backend servers over their backbone network. A combination of GeoDNS and BGP Anycast ensures availability and low latency for end users.

Dropbox manages exabytes of data and petabytes of metadata from half a billion users. They have 20 Points of presence (POPs) across the world to facilitate low latency download and upload for end users. POPs, also known as edge servers – are used by Content Delivery Networks (CDNs) to serve content to end users from a location that is geographically closest to them. Dropbox initially stored users’ files on Amazon S3, while their webservers and metadata servers ran on their self-managed datacenters. They moved to their own storage infrastructure to fine tune performance and customize the hardware and software being used for block storage.

Dropbox’s global network spans seven countries, supports IPv6 and has exchange points with ISPs and peering partners. In general, internet traffic from one network to another can flow either via transit agreements with ISPs, which is a paid service, or via peering agreements, which is usually free. The edge proxy architecture at Dropbox is part of this network, where Dropbox deployed their servers on the end user facing POPs. Building their own POPs entailed that they had to configure their own routing architecture. Routing uses two kinds of protocols. Interior gateway protocols like OSPF and IS-IS help to route inside an autonomous system (AS). Routing between ASs over the internet uses exterior gateway protocols like BGP. Dropbox started with BGP and OSPF and had moved to IS-IS for internal routing by 2015. They also increased peering relationships with other networks while keeping their transit agreements, which gave them more control over traffic engineering.
 
A Dropbox edge location has several components that help it function. Global server load balancing (GSLB), Anycast and hybrid routing for BGP, and real user metrics (RUM) collection to assess actual performance are the key ones. Factors like backbone network capacity, peering connectivity, and undersea cables affect the process of setting up new POPs. Population density as well as the potential number of new users also plays a role.

Image courtesy: https://blogs.dropbox.com/tech/2017/06/evolution-of-dropboxs-edge-network/

GSLB is the entry point for edge locations as it decides to which POP it should route a user request. Dropbox uses multiple GSLB techniques – but the preferred one is a hybrid approach. BGP Anycast is the easiest to configure. In Anycast, multiple computers (or edge locations in this case) have the same IP address, and routing ensures that packets are sent to the location nearest to the user. Dropbox uses it mostly as a fallback mechanism as it has performance, control and debugging issues. Another technique – GeoDNS – relies on DNS to resolve the correct IP address for a POP based on the end user’s location. However, if the DNS mapping changes to a different POP, it can take a long time for clients to resolve to the new IP in spite of DNS TTLs being set to low values since many ISPs ignore the setting. The key difference between these two routing mechanisms is that Anycast resolves a name to the same IP address and relies on BGP routing after that, whereas GeoDNS resolves to an IP address that is closest to the user. In the hybrid approach, GeoDNS maps multiple POP addresses to the same name, and BGP announces their subnets and their supernet (a combination of two or more subnets). Routing ensures that users are sent to an available POP when one goes down without the need to change the DNS mapping.

Dropbox uses several tools to measure the performance of its global network and its desktop clients. The clients have a measurement framework built into them that captures latency data and sends it back for analysis after anonymizing it. Users can use “debug” sites like dropbox-debug to capture network characteristics and send it back to Dropbox.

Dropbox POPs are built with nginx and IPVS and handle user facing connections. SSL is terminated at the POP which connects to Dropbox backend servers. IPVS load balancers send the TCP traffic to multiple nginx servers, which act as an L7 (HTTP in this case) proxy. These proxies maintain encrypted, persistent connections to the Dropbox backend servers over their internal backbone network to serve content.

Subscribe for MMS Newsletter

By signing up, you will receive updates about our latest information.

  • This field is for validation purposes and should be left unchanged.


Presentation: Upgrading to Spring Boot 2.0

MMS Founder
MMS RSS

Article originally posted on InfoQ. Visit InfoQ

Is your profile up-to-date? Please take a moment to review and update.

You will be sent an email to validate the new email address. This pop-up will close itself in a few moments.

Subscribe for MMS Newsletter

By signing up, you will receive updates about our latest information.

  • This field is for validation purposes and should be left unchanged.