Month: November 2018

MMS • RSS
Article originally posted on Data Science Central. Visit Data Science Central
This article was written by Luis Verde Arregoitia on his personal research page.

For various kinds of analyses, we often end up plotting point data in two dimensions for two or groups. This includes Principal Component Analyses, bioclimatic profiles, or any other combination of values on two axes. In some of my recent projects I’ve encountered three alternatives for drawing polygons around groups of points and I want to share code and examples for all three in this post.
These methods are for ggplot, but I assume there are ways to do the same things using base or other plotting engines. I wanted to use real data, so the following examples use data from thispaper on the physiology of the Japanese quail. After loading (or installing if necessary) the required packages and downloading the data directly from Dryad, we can wrangle the data so we can plot length and mass data from several individual birds at 30 vs 40 days of age.

To read more, click here.
DSC Resources
- Book and Resources for DSC Members
- Comprehensive Repository of Data Science and ML Resources
- Advanced Machine Learning with Basic Excel
- Difference between ML, Data Science, AI, Deep Learning, and Statistics
- Selected Business Analytics, Data Science and ML articles
- Hire a Data Scientist | Search DSC | Find a Job
- Post a Blog | Forum Questions
Follow us on Twitter: @DataScienceCtrl | @AnalyticBridge
MMS • RSS
Article originally posted on Data Science Central. Visit Data Science Central
“If you own one Python machine learning book, this should be it! Five stars.”
Hello Scientists,
Unlock deeper insights into Machine Leaning with this vital guide to cutting-edge predictive analytics. Sebastian Raschka’s Python Machine Learning demonstrates why Python is one of the world’s leading data science languages. If you want to ask better questions of data, or need to improve and extend the capabilities of your machine learning systems, this practical data science book is invaluable.
- Leverage Python’s open-source libraries for deep learning and data wrangling
- Learn effective strategies to improve and optimize machine learning systems
- Ask – and answer – tough questions of your data with robust statistical models
The free e-book can be downloaded from here
Download Python Machine Learning E-book
This book is worth £28.99 from Packt Publishing. Here for some serious fun.
All the best with your Python ML!
Yours Sincerely,
Ahsan Nabi Khan
MMS • RSS
Article originally posted on InfoQ. Visit InfoQ
Researchers from Sony announced that they trained a ResNet 50 architecture on ImageNet in only 224 seconds.
The resulting network has a top-1 accuracy of 75% on the validation set of ImageNet. They achieved this record by using 2.100 Tesla V100 Tensor Core GPUs from NVIDIA. Besides this record, they also got a 90% GPU scaling efficiency using 1.088 Tesla V100 Tensor Core GPUs.
There are two major challenges in scaling training neural networks to multiple machines: the batch size to train with, and synchronization of the gradients.
The first few epochs training a neural network one wants to use a small mini-batch size to quickly push the network weights in the right direction. However: small mini-batches make a neural network prone to find a local minimum. They solved this problem using batch size control. The mini-batch size increased gradually increased to make the loss landscape avoid local minima. They treated the first 5 epochs as warm-up epochs, with a low batch size, while later epochs used a larger batch size. Sony also used mixed-precision training, where the forward/backward computations are conducted in FP16.
The second problem is that synchronizing the gradients among machines can be slow. For communication among the different GPUs, a lot of bandwidth is required. Sony’s researchers went for a 2D-Torus all reduce algorithm to reduce the communication overhead. In this communication algorithm, GPU’s are placed in a virtual grid. First, the gradients pass horizontally, then communicate vertically to all columns, and then horizontally again in a final pass. This means that, if X is the number of GPUs in the horizontal direction, 2(X-1) GPU-to-GPU operations are necessary.
The Sony researchers used the tool Neural Network Libraries (NLL) and its CUDA extension as a DNN training framework. For communication between GPUs they used the NVIDIA Collective Communications Library (NCCL) version 2.
Last year multiple parties attempted to train a ResNet 50 architecture in the least amount of time possible. In September 2017 InfoQ reported that IBM trained the same neural network architecture in 50 minutes. Back then IBM achieved a higher scaling efficiency, but with only 256 GPUs. In the Q&A Hillery Hunter stated that the batch size was one of the most challenging things, but that they expected that their approach could scale to many more GPUs. In this paper, they looked at the GPU Scaling Efficiency for multiple amounts of GPUs, and when using 3264 GPUs for training the efficiency is 52.47%.
Sony’s researchers published their findings in the paper ‘ImageNet/ResNet-50 Training in 224 Seconds’, which can be found on arXiv.
MMS • RSS
Article originally posted on Data Science Central. Visit Data Science Central
A couple of quintillion of bytes are generated every day. Data is all around you. And every day we perceive new data and our brain processes it constantly. But we cannot constantly work with huge data volumes efficiently, that is where special algorithms for processing Big Data come in. Bis Data contributes to many fields of activity, and today it is rapidly being integrated into the real estate sector.
Why is Big Data changing real estate sector?
Nowadays IT technologies drastically change the structure of the commercial real estate market. Innovative technologies change almost everything in the real estate sector, starting from the business model building, human resources management or optimization of expenditures.
Big Data is one of the technologies that gained its popularity in the real estate markets of many countries. The goal of Big Data technology is to automate the analysis of huge amounts of data from multiple information sources. And human capabilities will not be enough to process all this data. Therefore, companies will be able to optimize financial costs, time, and achieve a more accurate result that won’t be affected by a human factor.
Big Data works with machine learning to solve main business tasks. Huge data massive is analyzed according to set algorithm, and artificial intelligence provides people with the solution of a specific task. The most widespread example – credit appraisal of a borrower in banking or microfinance sector. Many banks already make their decisions on loan issuance on the basis of the verdict from an automated system.
The future of Big Data in real estate
Big Data potential usage on real estate market is multipurpose. If it comes to an end consumer, then real estate Big Data can help consumers appraise objectively various real estate objects by multiple parameters. Modern real estate databases offer rather limited information volume about different objects interesting for you.
- For example, real estate predictive analytics with Big Data technology helps to estimate the time you need to spend to go to the specified object in rush hour, how many schools and kindergartens are located in this area, and other related issues;
- Thus, Big Data makes it possible for an individual to make a quick decision whether he/she needs to waste their time on this object or it is better to choose something else.
As for business, Big Data potential can also be titanic. Technology can be highly efficient for marketing fields starting from personalized offers to end consumer to the determination of real estate object type with all tiny properties that can be built in that or another location.
Advantages of Big Data in real estate
So what are Big Data benefits that make it possible both for real estate agents and consumers improve their interaction with this field? It is time to find out.
Risks reduction
First, we should clarify that commercial real estate companies start using Big Data since it helps them reduce financial risks. How is it implemented? Using predictive analytics in real estate, companies can analyze the total condition of the building, its age, how solid it is, all reconstructions that were made before, and the information about the current owner. Based on all the above, real estate companies can make a correct estimation of the real property and provide customers with detailed recommendations and information. Moreover, real estate agents can quickly find appropriate variants for customers that meet their demands and preferences.
Improved customers’ engagement.
Data-driven analysis can come to the rescue. Real estate agents often come across ambiguous and unclear customers’ behavior which cannot explain why they don’t like this house or why they don’t want to buy it. That is where analysis using Big Data can help solve this issue once and for all. Predictive analytics for real estate is very important. Special tools developed by software development companies like Cleveroad can analyze the needs of consumers and improve their engagement.
Perhaps, undetermined requirements of customers may even come to naught eventually and agents/companies will offer customers what those want to get.
Detailed and precise appraisals
When people sell or buy a house/apartment, they want to know its real price. And the process of the correct estimation is rather difficult and long since it requires full information about the building condition, location, area and so on. So prices can be changed drastically depending on many factors. Big Data is an option, as always. Using special analytical tools, real estate agents are able to perform accurate appraisal and set a real value for the indicated building. Big Data will provide users with actual information on the basis of the neighborhood, area, total conditions of buildings and so on. Thus, agents and consumers can get the most realistic price, and both parties benefit. Using Big Data, the real estate sector can be completely modified.
MMS • RSS
Article originally posted on Data Science Central. Visit Data Science Central
This resource is part of a series on specific topics related to data science: regression, clustering, neural networks, deep learning, decision trees, ensembles, correlation, Python, R, Tensorflow, SVM, data reduction, feature selection, experimental design, cross-validation, model fitting, and many more. To keep receiving these articles, sign up on DSC.
21 Statistical Concepts Explained in Simple English
- Content Validity (Logical or Rational Validity)
- Contingency Coefficient: Definition
- Continuous Probability Distribution
- Continuous Variable Definition (Continuous Data)
- Contour Plots: Definition, Examples
- Control Group: Definition, Examples and Types
- Control Variable: Simple Definition
- Convenience Sampling (Accidental Sampling): Definition, Examples
- Convergent Validity and Discriminant Validity: Definition, Examples
- Cook’s Distance / Cook’s D: Definition, Interpretation
- Correlation Matrix: Definition
- Counterbalancing in Research
- Covariance in Statistics: What is it? Example
- Covariate Definition in Statistics
- Cramer-Rao Lower Bound
- Criterion Validity: Definition, Types of Validity
- Criterion Variable: Definition, Use and Examples
- Critical Z Value TI 83: Easy Steps for the InvNorm Function
- Cronbach’s Alpha: Simple Definition, Use and Interpretation
- C-Statistic: Definition, Examples, Weighting and Significance
- Cumulative Distribution Function CDF
Previous editions can be accessed here: Part 1 | Part 2 | Part 3. Also, if you downloaded our book Applied Stochastic Processes, there is an error page 64, that I fixed. The new version of the book can be found here.
To make sure you keep getting these emails, please add mail@newsletter.datasciencecentral.com to your address book or whitelist us.
MMS • RSS
Article originally posted on InfoQ. Visit InfoQ
Key Takeaways
- It is to your advantage to acknowledge and prioritize the risks a project will face before actually facing them.
- A pre-mortem is a useful structure to help identify and prioritize project risks
- Including a diversity of voices covers the most ground in surfacing risks as well as problem solving
- Problem solving is a necessary component for a pre-mortem in order for people to feel safe to explore the real risks
- The learnings from a premortem are immediately applicable to influence the planning and execution of the initiative
When improving processes, there’s no doubt that post-mortems are helpful, but if they were perfect, there would never be any hiccups. Instead of exclusively looking back on what happened, why don’t we try to steer what will happen in the first place, especially for high-stakes projects with potentially costly issues?
The concept of a pre-mortem has been around for years, but only recently have we seen it pick up speed in the engineering community (though we have been doing this for some years now at Truss). This is an activity which is run before starting on a big stage in a project, but after doing a product mapping and prioritization activity. Rather than exploring what went wrong after the fact and what to do differently in the future, the goal of a premortem is to identify potential pitfalls and then apply preventative measures. It’s a great idea, but for those new to the concept, it’s easy to overlook some important aspects of the process.
To talk about what might go wrong is scary. It acknowledges many things are out of our control, and that we might mess up the things which are within our control. To talk about what might go wrong, and how to adapt to it, acknowledges the possibility of failure. As this is a rare thing in industry, if done initially outside of a structured activity, this can seem like trying to weasel your way out of work. But if premortems are held with some regularity, and always with a creative problem solving time at the end, it can build a safe space for adaptation in the face of adversity.
In our work with various organizations and missions–from digital overhauls for government services to disaster technology–these are the most commonly overlooked “must dos” for an effective pre-mortem:
Ask the right questions, the right way
Pose questions carefully, with a clearly outlined prompt. Conceptual questions are easier to process when given a specific context. For example, I like: “You are giving a presentation to the board of this company one year from now about why this project failed. What is in your presentation?” Being specific in this way prevents catastrophic or silly thinking such as “an 8-point earthquake hit San Francisco and we couldn’t finish the project” or “the military ran out of funding.” The specificity also helps your team shift their mindset to leaving no stone unturned at an early point in the project, when changes can still be made.
When I started managing a project to improve how military families relocate, one of the repeated themes in our first pre-mortem was the failure to sufficiently engage with the moving industry. To this day, we ask ourselves about new ways to engage, and push to engage sooner.
Make input fully inclusive
Too often, leadership seeks input exclusively from group leaders–even those not directly involved in the execution–and leave out the rest. Getting input from everyone involved–no matter how long they’ve been with the company–is crucial. These people were hired because the company felt they could do the job, and just because someone is more junior doesn’t mean they can’t bring a fresh perspective to the table. Think of this part of the pre-mortem as a book writing project: if we all thought we were going to write a book, and only the most senior person gets to write it, is that an accurate representation of the organization as a whole? Including more voices won’t just benefit the project, it will also create an environment in which people feel they will be heard, and can feel comfortable speaking up.
For example, in a previous job, I helped create a reference map and user interface for a gender-based-violence call center in Port-au-Prince. The user experience expert in the room guided the women who worked there to create their own interface, rather than making it for them. They had unique insights based on their experience as well as being the everyday users.
Group the concerns
After you’ve gotten each concern listed individually on sticky notes or note cards, group them. This will show which topics have “heat” around them — many people thinking about the same concern, or many manifestations of the same sort of concern. It will also highlight outliers.
At a premortem for our military family moving project, many people expressed concern about the bureaucracy necessary to get something called Authority to Operate (ATO). But only one person worried about the complexities of overlapping the new system with the old system in allotting moves fairly. Does that mean that the individual sees something that others don’t, or that they haven’t been kept in the loop about that topic?
Weigh the risks with their impacts
Here’s a major regret I’ve heard about having prioritized a risk at many a post-mortem: “there was hardly any chance of that problem arising!” When you assess risks to a project, it’s not just about the severity of impact. The likelihood of that risk is equally important to consider. Think about insurance, for an example. Some people buy flood insurance for their houses. The chances that their house will flood depends on geography, location of their home, how their house is built, nearby infrastructure, etc. So a homeowner in a high-risk flooding area with excellent drainage might forgo insurance, whereas someone in a lower risk area with poor drainage might choose to invest. And someone in a very low risk area with a very expensive book collection in their basement might
At a workshop around security for refugees and other vulnerable populations, I ran a risk analysis of the data flow on humanitarian aid workers. While something like wholesale shut down or takeover of the network would be devastating, the real concerns are in identity theft, extortion, and basic malware. Because of how unlikely wholesale takeover is, it wasn’t worth investing resources beyond basic security hygiene. The network admins should instead spend their limited time focusing on prevention, response, and recovery from identity theft, extortion, and basic malware. So, while some unlikely issues are still worth preparing for, effort to remedy them can be scaled depending on the degree of an event’s probability.
Solve theoretical problems playfully
Now that concrete concerns are expressed and prioritized, it makes sense to solve some problems. Because actions haven’t been taken yet (this is a pre mortem, after all), it’s possible to brainstorm wild ideas of how to stop the problems before they start. Can it be avoided entirely? Can a new group be involved in a unique way? While many of the ideas won’t be feasible, the creative juices will surface approaches that are.
At a recent pre-mortem, to creatively problem solve around some particularly onerous paperwork, a wild idea was entirely reorganizing branches of the military to increase understanding of modern devops methodologies. While we can’t do this, it did get us thinking about new stakeholders and ways we might lighten the load.
Those Who Asked “What If?”
The MIT Sloan Management Review published–“ahead of its time” in 2009–the story of an unlikely escapee of the Enron fall out: a credit union. The financial organization had run through scenarios that would be cause for collapse, and then added the necessary safeguards to their processes. In this case, the credit union had made sure to minimize their dependence on one corporation. That is a pre-mortem success story.
It may seem like another to-do on the list, but think about businesses that could have been saved from headline-making disasters if they had drawn up a comprehensive list of threats, and rolled with the punches? Perhaps Toys ‘R Us would have fared better had they considered the impact of e-retail when they chose to invest in their brick-and-mortar stores. Ultimately, introducing the pre-mortem process can determine how competitive a company remains in a fast-changing world.
In addition to avoiding massive issues, conducting a reasonable number of pre-mortems provides more data to help inform future projects–what problems are projects more likely to encounter in government, or healthcare, or finance? How much budget did preventative tactics take vs. the cost of not implementing them? This data can also help teams justify their approach on an issue to clients, making it easier to get buy in from all decision makers.
Introducing the pre-mortem to teams, and onboarding it as a regular occurrence, is likely to be more challenging with larger, established corporations as opposed to more agile startups that don’t have a library full of binders filled with branded guidelines (yet).
As teams improve on their own pre-mortem processes, businesses are seeing results. Airbnb has done this on a broader level, asking employees to shift their mindset to think about the ways the company could go down. In the years since that’s been a practice, their business has seen great success. So, that leaves the question: what can take you down?
About the Author
 Willow Brugh is project manager at Truss. She mastered the pre-mortem during her time working with disaster response technology. Willow has worked with digital tools to enable coordination between response agencies and emergent response groups in areas affected by fast and slow crises. This often means ad hoc project management with hundreds of volunteers across multiple timezones and cultures.
MMS • RSS
Article originally posted on Data Science Central. Visit Data Science Central
This article is an excerpt from “Natural Language Processing and Computational Linguistics” published by Packt.
Introduction
Arguably the most important application of machine learning in text analysis, the Word2Vec algorithm is both a fascinating and very useful tool. As the name suggests, it creates a vector representation of words based on the corpus we are using. But the magic of Word2Vec is how it manages to capture the semantic representation of words in a vector. The papers Efficient Estimation of Word Representations in Vector Space [1] [Mikolov et al. 2013], Distributed Representations of Words and Phrases and their Compositionality [2] [Mikolov et al. 2013], and Linguistic Regularities in Continuous Space Word Representations
[3] [Mikolov et al. 2013] lay the foundations for Word2Vec and describe their uses.
We’ve mentioned that these word vectors help represent the semantics of words – what exactly does this mean? Well for starters, it means we could use vector reasoning for these words – one of the most famous examples is from Mikolov’s paper, where we see that if we use the word vectors and perform (here, we use V(word) to represent the vector representation of the word) V(King) – V(Man) + V(Woman), the resulting vector is closest to V(Queen). It is easy to see why this is remarkable – our intuitive understanding of these words is reflected in the learned vector representations of the words!
This gives us the ability to add more of a punch in our text analysis pipelines – having an intuitive semantic representation of vectors (and by extension, documents – but we’ll get to that later) will come in handy more than once.
Finding word-pair relationships is one such interesting use – if we define a relationship between two words such as France: Paris, using the appropriate vector difference we can identify other similar relationships – Italy : Rome, Japan : Tokyo are two such examples which are found using Word2Vec. We can continue to play with these vectors like any other vectors – by adding two vectors, we can attempt to get what we would consider the addition of two words. For example, V(Vietnam) + V(Capital) is closest to the vector representation of V(Hanoi).
How exactly does this technique result in such an understanding of words? Word2Vec works by understanding context – in particular, what of words tend to appear in certain words? We choose a sliding window size and based on this window size attempt to identify the conditional probability of observing the output word based on the surrounding words. For example, if the sentence is The personal nature of text data always adds an extra bit of motivation, and it also likely means we are aware of the nature of the data, and what kind of results to expect., and our target word is the word in bold, motivation, we try and figure out what the odds of finding the word motivation if the context is always adds an extra bit of on the left side of the window and and it also likely means on the right. Of course, this is just an illustrative example – the exact training procedure requires us to choose a window size and the number of dimensions among other details.
There are two main methods to perform Word2Vec training, which are the Continuous Bag of Words model (CBOW) and the Skip Gram model. The underlying architecture of these models is described in the original research paper, but both of these methods involve in understanding the context which we talked about before. The papers written by Mikolov et al. provide further details of the training process, and since the code is public, it means we actually know what’s going on under the hood!
This blog post [4] (Word2Vec Tutorial – The Skip-Gram Model) by Chris McCormick explains some of the mathematical intuition behind the skip-gram word2vec model, and this post [5] (The amazing power of word vectors) by Adrian Colyer talks about the some of the things we can do with word2vec. The links are useful if you wish to dig a little deeper into the mathematical details of Word2Vec. This resources page [6] contains theory and code resources for Word2Vec and is also useful in case you wish to look up the original material or other implementation details.
While Word2Vec remains the most popular word vector implementation, this is not the first time it has been attempted, and certainly not the last either – we will discuss some of the other word embeddings techniques in the last section of this chapter. Right now, let’s jump into using these word vectors ourselves.
Gensim comes to our assistance again and is arguably the most reliable open source implementation of the algorithm, and we will explore how to use it.
Using Word2Vec with Gensim
While the original C code [7] released by Google does an impressive job, gensims’ implementation is a case where an open source implementation is more efficient than the original.
The gensim implementation was coded up back in 2013 around the time the original algorithm was released – this blog post by Radim Řehůřek [8] chronicles some of the thoughts and problems encountered in implementing the same for gensim, and is worth reading if you would like to know the process of coding word2vec in python. The interactive web tutorial [9] involving word2vec is quite fun and illustrates some of the examples of word2vec we previously talked about. It is worth looking at if you’re interested in running gensim word2vec code online and can also serve as a quick tutorial of using word2vec in gensim.
We will now get into actually training our own Word2Vec model. The first step, like all the other gensim models we used, involved importing the appropriate model.
from gensim.models import word2vec
At this point, it is important to go through the documentation for the word2vec class, as well as the KeyedVector class, which we will both use a lot. From the documentation page, we list the parameters for the word2vec.Word2Vec class.
- sg: Defines the training algorithm. By default (sg=0), CBOW is used. Otherwise (sg=1), skip-gram is employed.
- size: This is the dimensionality of the feature vectors.
- window: This is the maximum distance between the current and predicted word within a sentence.
- alpha: This is the initial learning rate (will linearly drop to min_alpha as training progresses).
- seed: For the random number generator. Initial vectors for each word are seeded with a hash of the concatenation of word + str(seed). Note that for a fully deterministically-reproducible run, you must also limit the model to a single worker thread, to eliminate ordering jitter from OS thread scheduling. (In Python 3, reproducibility between interpreter launches also requires the use of the PYTHONHASHSEED environment variable to control hash randomization.)
- min_count: Ignore all words with a total frequency lower than this.
- max_vocab_size: Limit RAM during vocabulary building; if there are more unique words than this, then prune the infrequent ones. Every 10 million word types need about 1GB of RAM. Set to None for no limit (default).
- sample: Threshold for configuring which higher-frequency words are randomly downsampled; default is 1e-3, the useful range is (0, 1e-5).
- workers: Use this many worker threads to train the model (=faster training with multicore machines).
- hs: If 1, hierarchical softmax will be used for model training. If set to 0 (default), and negative is non-zero, negative sampling will be used.
- negative: If > 0, negative sampling will be used, the int for negative specifies how many noise words should be drawn (usually between 5-20). The default is 5. If set to 0, no negative sampling is used.
- cbow_mean: If 0, use the sum of the context word vectors. If 1 (default), use the mean. Only applies when cbow is used.
- hashfxn : Hash function to use to randomly initialize weights, for increased training reproducibility. The default is Python’s rudimentary built-in hash function.
- iter: Number of iterations (epochs) over the corpus. The default is 5.
- trim_rule: Vocabulary trimming rule specifies whether certain words should remain in the vocabulary, be trimmed away, or handled using the default (discard if word count < min_count). Can be None (min_count will be used), or a callable that accepts parameters (word, count, min_count) and returns either RULE_DISCARD, utils.RULE_KEEP or utils.RULE_DEFAULT. Note: The rule, if given, is only used to prune vocabulary during build_vocab() and is not stored as part of the model.
- sorted_vocab: If 1 (default), sort the vocabulary by descending frequency before assigning word indexes.
- batch_words: Target size (in words) for batches of examples passed to worker threads (and thus cython routines). The default is 10000. (Larger batches will be passed if individual texts are longer than 10000 words, but the standard cython code truncates to that maximum.).
We won’t be using or exploring all of these parameters in our examples, but they’re still important to have an idea of – fine-tuning your model would heavily rely on this. When training our model, we can use our own corpus or more generic ones – since we wish to not train on a particular topic or domain, we will use the Text8 corpus [10] which contains textual data extracted from Wikipedia. Be sure to download the data first – we do this by finding the link text8.zip under the Experimental Procedure section.
We will be more or less following the Jupyter notebook attached at the end of this chapter, which can also be found at the following link [11].
sentences = word2vec.Text8Corpus(‘text8’)
model = word2vec.Word2Vec(sentences, size=200, hs=1)
Our model will use hierarchical softmax for training and will have 200 features. This means it has a hierarchical output and uses the softmax function in its final layers. The softmax function is a generalization of the logistic function that squashes a K-dimensional vector z of arbitrary real values to a K-dimensional vector of real values, where each entry is in the range (0, 1), and all the entries add up to 1. We don’t need to understand the mathematical foundation at this point, but if interested, links 1-3 go into more details about this.
Printing our model tells us this:
print(model)
-> Word2Vec(vocab=71290, size=200, alpha=0.025)
Now that we have our trained model, let’s give the famous King – Man + Woman example a try:
model.wv.most_similar(positive=[‘woman’, ‘king’], negative=[‘man’], topn=1)[0]
Here, we are adding king and woman (they are positive parameters), and subtracting man (it is a negative parameter), and choosing only the first value in the tuple.
-> (u’queen’)
And voila! As we expected, Queen is the closest word vector when we search for the word most similar to Woman and King, but far away from man. Note that since this is a probabilistic training process, there is a slight chance you might get a different word – but still relevant to the context of the words. For example, words like throne or empire might come up.
We can also use the most_similar_cosmul method – the gensim documentation [12] describes this as being slightly different to the traditional similarity function by instead using an implementation described by Omer Levy and Yoav Goldberg in their paper [13] Linguistic Regularities in Sparse and Explicit Word Representations. Positive words
still contribute positively towards the similarity, negative words negatively, but with less susceptibility to one large distance dominating the calculation. For example:
model.wv.most_similar_cosmul(positive=[‘woman’, ‘king’], negative=[‘man’])
-> [(u’queen’, 0.8473771810531616),
(u’matilda’, 0.8126628994941711),
(u’throne’, 0.8048466444015503),
(u’prince’, 0.8044915795326233),
(u’empress’, 0.803791880607605),
(u’consort’, 0.8026778697967529),
(u’dowager’, 0.7984940409660339),
(u’princess’, 0.7976254224777222),
(u’heir’, 0.7949869632720947),
(u’monarch’, 0.7940317392349243)]
If we wish to look up the vector representation of a word, all we need to do is:
model.wv[‘computer’]
model.save(“text8_model”)
We won’t display the output here, but we can expect to see a 200-dimension array, which is what we specified as our size.
If we wish to save our model to disk and re-use it again, we can do this using the save and load functionalities. This is particularly useful – we can save and re-train models, or further train on models adapted to a certain domain.
model.save(“text8_model”)
model = word2vec.Word2Vec.load(“text8_model”)
The magic of gensim remains in the fact that it doesn’t just give us the ability to train a model – like we have been seeing so far, it’s API means we don’t have to worry much about the mathematical workings but can focus on using the full potential of these word vectors. Let us check out some other nifty functionalities the word2vec model offers:
Using word vectors, we can identify which word in a list is the farthest away from the other words. Gensim implements this functionality with the doesnt_match method, which we illustrate:
model.wv.doesnt_match(“breakfast cereal dinner lunch”.split())
-> ‘cereal’
As expected, the one word which didn’t match the others on the list is picked out – here, it is cereal. We can also use the model to understand how similar or different words are in a corpus –
model.wv.similarity(‘woman’, ‘man’)
-> 0.6416034158543054
model.wv.similarity(‘woman’, ‘cereal’)
-> 0.04408454181286298
model.wv.distance(‘man’, ‘woman’)
-> 0.35839658414569464
The results are quite self-explanatory in this case, and as expected, the words woman and cereal are not similar. Here, distance is merely 1 – similarity.
We can continue training our Word2Vec model using the train method – just remember to explicitly pass an epochs argument, as this is a suggested way to avoid common mistakes around the model’s ability to do multiple training passes itself. This Gensim notebook tutorial [14] walks one through how to perform online training with word2vec. Briefly, it requires performing the following tasks – building a new vocabulary and then running the train function again.
Once we’re done training our model, it is recommended to start only using the model’s keyed vectors. You might have noticed so far that we’ve been using the keyed vectors (which is simply a Gensim class to store vectors) to perform most of our tasks – model.wv represents this. To free up some RAM space, we can run:
word_vectors = model.wv
del model
We can now perform all the tasks we did before using the word vectors. Keep in mind this is not just for Word2Vec but all word embeddings.
To evaluate how well our model has done, we can test it on data-sets which are loaded when we install gensim.
model.wv.evaluate_word_pairs(os.path.join(module_path, ‘test_data’,’wordsim353.tsv’))
–> ((0.6230957719715976, 3.90029813472169e-39),
SpearmanrResult(correlation=0.645315618985209, pvalue=1.0038208415351643e-42), 0.56657223796034)
Here, to make sure we find our file, we have to specify the module path – this is the path for the gensim/test folder, which is where the files exist. We can also test our model on finding word pairs and relationships by running the following code.
model.wv.accuracy(os.path.join(module_path, ‘test_data’, ‘questions-words.txt’))
In our examples so far, we used a model which we trained ourselves – this can be quite a time-consuming exercise sometimes, and it is handy to know how to load pre-trained vector models. Gensim allows for an easy interface to load the original Google News trained word2vec model (you can download this file from link [9]), for example.
from gensim.models import KeyedVectors
# load the google word2vec model
filename = ‘GoogleNews-vectors-negative300.bin’
model = KeyedVectors.load_word2vec_format(filename, binary=True)
Our model now uses a 300-dimension word vector model, and we can run all the previous code examples we ran before, again – the results won’t be too different, but we can expect a more sophisticated model.
Gensim also allows similar interfaces to download models using other word embeddings – we’ll go over this in the last section. We’re now equipped to train models, load models, and use these word embeddings to conduct experiments!
You have just read an excerpt from Packt’s book Natural Language Processing and Computational Linguistics, authored by Bhargav Srinivasa-Desikan.
If you want to know how to use natural language processing, and computational linguistics algorithms, to make inferences and gain insights about data you have, this is the book for you.
MMS • RSS
Article originally posted on Data Science Central. Visit Data Science Central
This article was written by Tristan Handy.
This post is about how to create the analytics competency at your organization. It’s not about what metrics to track (there are plenty of good posts about that), it’s about how to actually get your business to produce them. As it turns out, the implementation question – How do I build a business that produces actionable data? – is much harder to answer.
And the answer is changing fast. The analytics ecosystem is moving very quickly, and the options you have at your disposal have changed significantly in the past 24 months. This post reflects recommendations and experience with the data technology of 2017.
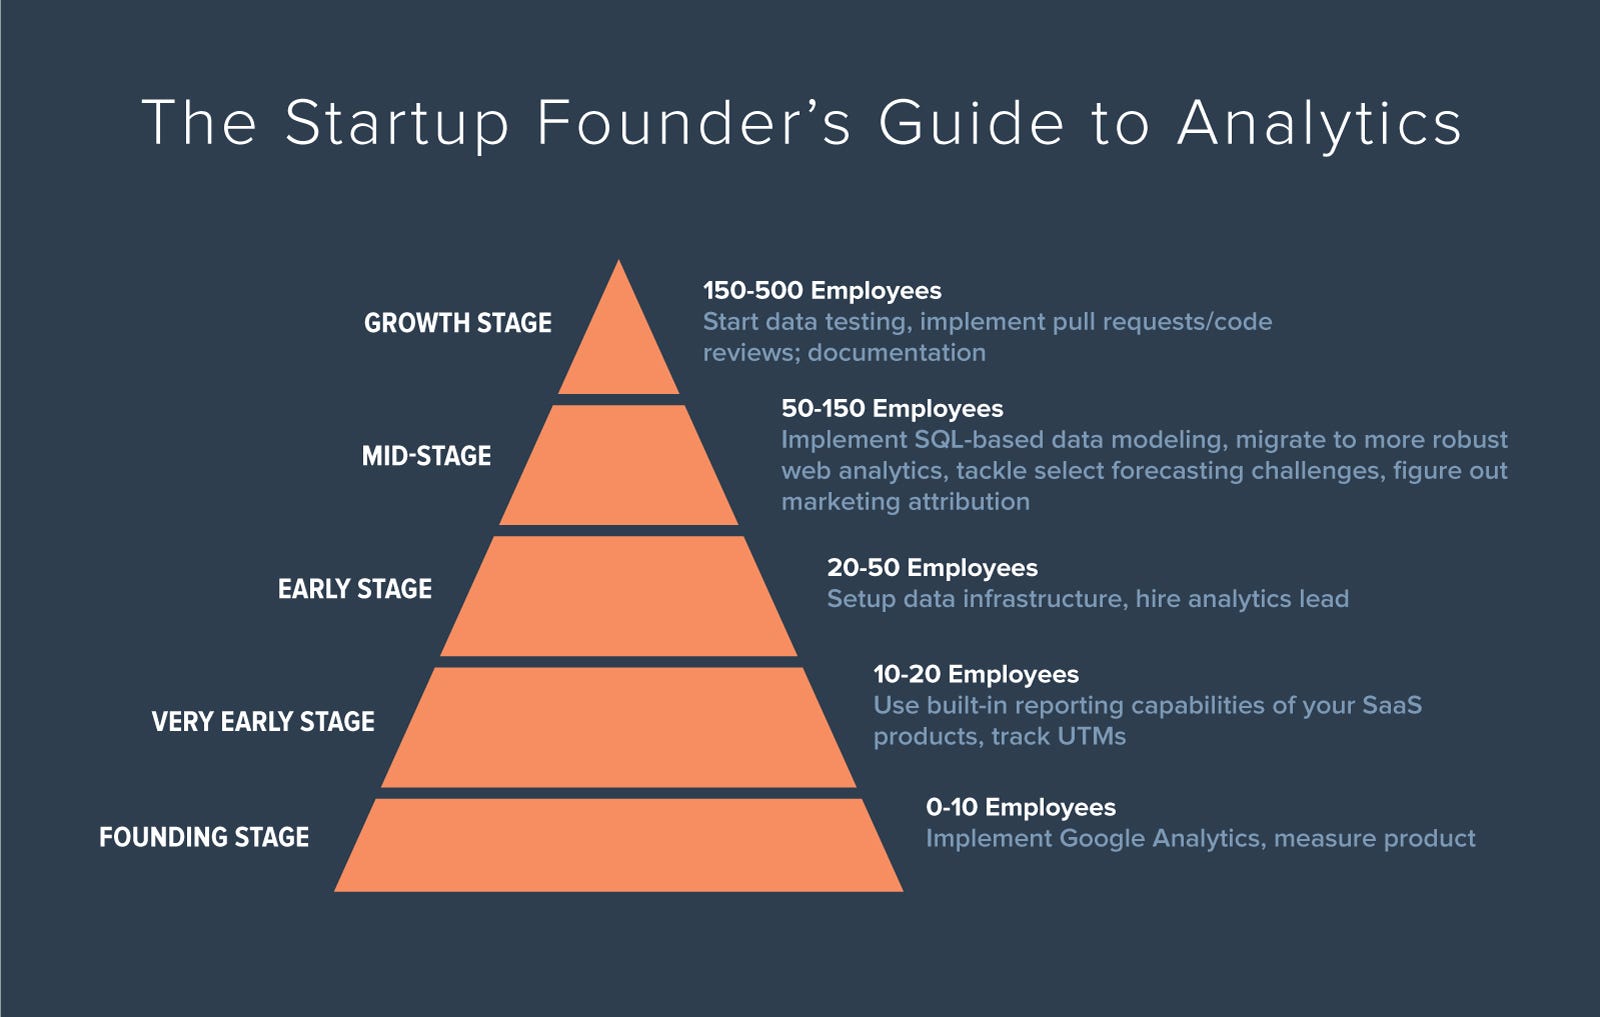
This articles explains in details what to do, and what not to do, at various stages in a company lifecycle:
1. Founding Stage
(0 to 10 employees)
At this stage, you have no resources and no time. There are a million things you could be measuring, but you’re so close to the details of your business that you’re actually able to make fairly good instinctual decisions. The one thing you need to make sure you are measuring is your product, because it’s your product metrics that will help you iterate quickly in this critical phase. Everything else can take a back seat.
What to do
- Install Google Analytics on your website via Google Tag Manager. The data won’t be perfect without more work but it’s not the right time to worry about that.
- If you are an ecommerce business, you really need to make sure that your Google Analytics ecommerce data is good. GA can do a decent job of tracking your ecommerce business all the way from visitor to purchase, so spend the time to make sure it’s right.
- If you build software of any type, you need real event tracking. I don’t care what tool you use – Mixpanel and Heap are very similar and they’re both good. At this point I wouldn’t think too hard about what you’re tracking: just use Mixpanel’s autotrack or Heap’s default installation. If you realize you need a datapoint, you’ll find it’s already there. This approach does not scale well, but for now, it’ll do.
- Your financial reporting should be done in Quickbooks. Your forecasting should be done in Excel. If you’re a subscription business, use
Baremetrics for your subscription metrics. If you’re an ecommerce business, use your shopping cart platform to measure GMV. Don’t get fancy.
If you’re not technical, you may need an engineer to help out with GA and event tracking. This entire exercise shouldn’t take more than an hour or two, including reading the docs. It’s worth it to take the time out of building for this.
What not to do
Everything that is not one of the things above. Do not let someone sell you a data warehouse, a BI platform, a big consulting project, or…yeah, you get it. Stay focused. When you make a commitment to analytics, there is an ongoing cost. Data changes. Business logic changes. Once you start down this road, you can’t really put the project on pause. Wait to make this investment until later.
There will be many questions that you just can’t answer yet. That’s fine (for now).
To read the rest of the article, covering early stage company, mid-stage, and growth stage, click here.
DSC Resources
- Book and Resources for DSC Members
- Comprehensive Repository of Data Science and ML Resources
- Advanced Machine Learning with Basic Excel
- Difference between ML, Data Science, AI, Deep Learning, and Statistics
- Selected Business Analytics, Data Science and ML articles
- Hire a Data Scientist | Search DSC | Find a Job
- Post a Blog | Forum Questions