Mobile Monitoring Solutions

Search
Close this search box.

Frequencies in Pandas Redux

MMS Founder
MMS RSS

Article originally posted on Data Science Central. Visit Data Science Central


A little less than a year ago, I posted a blog on generating multivariate frequencies with the Python Pandas data management library, at the same time showcasing Python/R graphics interoperability. For my data science work, the ability to produce multidimensional frequency counts quickly is sine qua non for subsequent data analysis.

Pandas provides a method, value_counts(), for computing frequencies of a single dataframe attribute. By default, value_counts excludes missing (NaN) values, though they’re included with the dropna=False option. As noted in that blog, however, the multivariate case is more problematic. “Alas, value_counts() works on single attributes only, so to handle the multi-variable case, the programmer must dig into Pandas’s powerful split-apply-combine groupby functions. There is a problem with this though: by default, these groupby functions automatically delete NA’s from consideration, even as it’s generally the case with frequencies that NA counts are desirable. What’s the Pandas developer to do?

There are several work-arounds that can be deployed. The first is to convert all groupby “dimension” vars to string, in so doing preserving NA’s. That’s a pretty ugly and inefficient band-aid, however. The second is to use the fillna() function to replace NA’s with a designated “missing” value such as 999.999, and then to replace the 999.999 later in the chain with NA after the computations are completed. I’d gone with the string conversion option when first I considered frequencies in Pandas. This time, though, I looked harder at the fillna-replace option, generally finding it the lesser of two evils.”

Subsequent to that posting, I detailed a freqs1 function for single attribute dataframe frequencies and freqsdf for the multivariate case. The functions have worked pretty well for me on Pandas numeric, string, and data datatypes. Simple versions of these functions are included below.

Last summer I started experimenting with the Pandas categorical datatype. Much like factors in R, “A categorical variable takes on a limited, and usually fixed, number of possible values (categories; levels in R). Examples are gender, social class, blood type, country affiliation, observation time or rating via Likert scales.” The categorical datatype can be quite useful in many instances, both in signaling to analytic functions a specific role for the attribute, and also for saving memory by storing integers instead of more consuming representations such as string.

Unfortunately, as I started to incorporate categorical attributes in my work, I found that my trusty freqsdf no longer worked, tripped up by the internal representation of the new datatype. So it was back to the drawing board to expand freqsdf functionality to handle categorical data. In the remainder of this blog, I present proof of concepts for two competing functions, freqscat and freqsC, that purport to satisfy all datatypes of freqsdf plus categorical attributes. Hopefully useful extensions, these functions should be seen as POC only.

The cells that follow exercise Pandas frequencies options for historical Chicago crime data with over 6.8M records. I first load feather files produced from prior data munging into Pandas dataframes, then build freqscat and freqsC functions from freqs1 and freqsdf foundations.

The technology used is JupyterLab 0.32.1, Anaconda Python 3.6.5, NumPy 1.14.3, and Pandas 0.23.0.

Read the entire post here.

Subscribe for MMS Newsletter

By signing up, you will receive updates about our latest information.

  • This field is for validation purposes and should be left unchanged.


Stack Overflow Developer Survey 2019

MMS Founder
MMS RSS

Article originally posted on InfoQ. Visit InfoQ

Javascript, MySQL and Linux have retained their places at the top of their respective categories for most popular, according to the 2019 Stack Overflow developer survey. Typescript and Python continue to impress with their growth in popularity and open source as ever having a prominent place in the responses of the survey. Public cloud providers- AWS, Azure and Google Cloud Platform – make the list for most popular platforms again. AWS is still the most popular amongst those surveyed, with GCP overtaking Azure for the first time. The survey of almost 90,000 developers also collated demographic information, highlighting again the huge imbalance of the genders in the industry.

In the annual survey of developers, Stack Overflow respondents were again overwhelmingly male, with over 90% identifying as such. There has been little change since 2011. Based on the survey responses, the chances of this imbalance correcting itself soon is low. The proportion of professional developers that identify as male is aligned with the number of student developers. 

Javascript has retained its place as the most popular programming language, a position it has held since the survey began in 2011. The top 10 continues to be dominated by some familiar faces, namely Java, C#, PHP, Python and C++. These have remained ever presents since the first survey. Python is the fastest growing of the major programming languages. In a similar vein to Python, Typescript continues to grow in popularity, gaining ground on the top 10, having made its debut in the 2016 survey with just 0.46% of respondents using it. If it follows the current trend it could break into the top 10 next year, with 21.2% of respondents now using it. According to the respondents, Python and Typescript filled second and third on most loved programming languages respectively, as well as first and fourth on the listed of most wanted programming languages. This goes some way in explaining their growth in popularity.

Four public cloud providers appear in the survey responses. AWS maintains a healthy lead over Google Cloud Platform, Azure respectively and IBM Cloud is in a distant fourth with 1.4% of those surveyed using it. IBMs position is not a surprise when considering it is the least loved, most dreaded and least wanted of the four providers from the responses. Google Cloud Platform only appeared on the survey in the 2018 edition with 8% popularity and has increased that value to 12.4% for 2019. AWS, Azure and IBM have remained fairly static in terms of popularity since 2017 when questions around platform usage first appeared. 

Stack Overflow asked about container technologies for the first time this year, with Docker and Kubernetes making appearances amongst the most popular platforms, with Docker in third place. Both Docker and and Kubernetes rate highly on most loved and most wanted platforms amongst respondents. Based on past trends, 2020 could see further growth in popularity of those two technologies. Linux maintained its position as most popular platform, with Windows a close second.

Open source databases continue to lead the way in popularity amongst respondents. MySQL and PostgresSQL lead the way overall, with MongoDB the most popular NoSQL database in the list.

Subscribe for MMS Newsletter

By signing up, you will receive updates about our latest information.

  • This field is for validation purposes and should be left unchanged.


Mature Microservices and How to Operate Them: QCon London Q&A

MMS Founder
MMS RSS

Article originally posted on InfoQ. Visit InfoQ

Microservices is an architectural approach to keep systems decoupled for releasing many changes a day, said Sarah Wells in her keynote at QCon London 2019. To build resilient and maintainable systems, you need things like load balancing across healthy nodes, backoff and retry, and persistence or fanning out of requests via queues. The best way to know whether your system is resilient is to test it.

The Financial Times adopted microservices because they wanted to be able to experiment with new features and products both quickly and cheaply. To do that, you need to be able to release code multiple times a day, and you can only do that if the individual changes are small and independent, argued Wells.

Wells mentioned that microservices are harder to maintain and operate than a monolith. The complexity is in between the services – the services themselves are simple to understand. But any request going through your system will likely touch a number of different services, maybe multiple queues and data stores, she said. The logs and metrics will be generated on lots of different VMs, and the path of the request changes a lot as teams build new things, combine services, add new functionality.

With microservices, you have to accept that these are complex distributed systems. That means you are generally running in a state of “grey failure” where something is not quite working perfectly – which likely doesn’t matter, as long as you have enough resilience for your business functionality still to be working as expected, argued Wells.

Chaos engineering is about changing the state of your system – for example by taking down nodes or increasing the latency of responses from a non-critical system – to test that everything else still works as expected. Chaos engineering should be done in production, but it shouldn’t have an impact on users, said Wells. You are coming up with a hypothesis about how your system will cope, then checking if you are right.

InfoQ interviewed Sarah Wells, technical director for operations and reliability at Financial Times, about the challenges that come with microservices and how we can deal with them.

InfoQ: At QCon you presented a problem with redirects on the FT website. What happened, and what made it so difficult to solve?

Sarah Wells: We often set up redirects for ft.com, so that we can share human-readable urls like “https://www.ft.com/companies” rather than our unique urls like “https://www.ft.com/stream/c47f4dfc-6879-4e95-accf-ca8cbe6a1f69“. The human-friendly url redirects to the unique one. The problem in this case was a badly setup redirect, where the destination we were being redirected to didn’t exist – so people were getting a “Not found” page. And we couldn’t work out how to reverse this through the url management tool.

The problem was that the url management tool is just one of hundreds of services we operate at the FT. And because we have so many services to operate, no-one had really had much experience making changes to this one, or really doing anything with it. We discussed restoring data from a backup but no-one was really that sure where the backup would be, or what the steps to restore it were: polyglot architectures where you have lots of different data stores are great, but it means you need to document exactly how this particular data store does backups and restores, and we found that documentation wasn’t detailed enough.

We managed to fix the problem, but we weren’t able to act with confidence, even with a very experienced set of developers involved. For an individual service, it’s easy to take action after the incident to practice a restore from backup, and to update the documentation. But that’s just a spot solution – we also need to work out how to set ourselves up so that all services have this level of ownership.

InfoQ: What have you learned about operating microservices?

Wells: If microservices give you the chance to release many times a day, then that additional complexity is worth it. You can make it easier by building in observability – log aggregation, metrics, business-focused monitoring: things that let you understand what’s going on in your production system. You need in particular to be able to find all the logs that relate to a particular event – by stamping them all with a transaction ID. And you can also improve things by changing the way you test to do more of it in production and to using monitoring to maintain quality.

When people and teams start moving on to new challenges, you need to make sure there is still active ownership of systems – people who know how to restore from backup, failover, release code, find relevant logs. We have a store of system information (we call it BizOps) that contains runbook information for every service and we want this to link every service to a team that is responsible for it. We’re also starting to introduce some automated scoring of the quality of that data, to find the places with the most risk that we wouldn’t know what to do in case of an incident.

InfoQ: How do you do experiments at the Financial Times?

Wells: For ft.com, we have A/B testing built in, and managed via feature flags. We run many experiments and do statistical analysis on each of them to see whether they had the impact we were looking for.

Because it’s cheap and easy to experiment, and because we ask people to predict what “success” would look like ahead of time, we often have experiments that prove we were better off the way we were before. So we don’t roll out that feature. That’s only really possible because there isn’t a huge amount of effort and cost already invested in the new feature – people are really reluctant to abandon an idea they’ve invested a lot into, even if it doesn’t work!

InfoQ: What are your suggestions for documenting microservices-based systems?

Wells: I think you need to document as close to the code as possible – even if someone writes a good runbook to start with, they won’t change it every time there’s a code change unless they can easily see the things that are no longer correct. We’re looking to update runbooks automatically on code release, based on information stored in the code repository.

I think the documentation should be about how to work out what’s going on with the service, rather than trying to identify the likely failure scenarios up front. With microservices, most problems are unexpected and involve someone digging into the detail using logs, metrics etc.

You also need to appreciate that lots of information that lived in a traditional runbook is shared across many microservices. You need to find a way to allow that shared context – no-one should have to type in the same information for 10s of services!

Subscribe for MMS Newsletter

By signing up, you will receive updates about our latest information.

  • This field is for validation purposes and should be left unchanged.


What is the Difference Between Hadoop and Spark?

MMS Founder
MMS RSS

Article originally posted on Data Science Central. Visit Data Science Central

Hadoop and Spark are software frameworks from Apache Software Foundation that are used to manage ‘Big Data’. There is no particular threshold size which classifies data as “big data”, but in simple terms, it is a data set that is too high in volume, velocity or variety such that it cannot be stored and processed by a single computing system.

Big Data market is predicted to rise from $27 billion (in 2014) to $60 billion in 2020 which will give you an idea of why there is a growing demand for big data professionals. The increasing need for big data processing lies in the fact that 90% of the data was generated in the past 2 years and is expected to increase from 4.4 zb (in 2018) to 44 zb in 2020. Let’s see what Hadoop is and how it manages such astronomical volumes of data.

A. What is Hadoop?

Hadoop is a software framework which is used to store and process Big Data. It breaks down large datasets into smaller pieces and processes them parallelly which saves time. It is a disk-based storage and processing system.

This image has an empty alt attribute; its file name is image-2.png
Distributed storage processing

It can scale from a single server to thousands of machines which increase its storage capacity and makes computation of data faster.

For eg: A single machine might not be able to handle 100 gb of data. But if we split this data into 10 gb partitions, then 10 machines can parallelly process them.

In Hadoop, multiple machines connected to each other work collectively as a single system.

There are two core components of Hadoop: HDFS and MapReduce

1.Hadoop Distributed File System (HDFS) –

It is the storage system of Hadoop.

It has a master-slave architecture, which consists of a single master server called ‘NameNode’ and multiple slaves called ‘DataNodes’. A NameNode and its DataNodes form a cluster. There can be multiple clusters in HDFS.

  • A file is split into one or more blocks and these blocks are stored in a set of DataNodes.

  • NameNode maintains the data that provides information about DataNodes like which block is mapped to which DataNode (this information is called metadata) and also executes operations like the renaming of files.
  • DataNodes store the actual data and also perform tasks like replication and deletion of data as instructed by NameNode. DataNodes also communicate with each other.

  • Client is an interface that communicates with NameNode for metadata and DataNodes for read and writes operations.

There is a Secondary NameNode as well which manages the metadata for NameNode.

2. MapReduce

It is a programming framework that is used to process Big Data.

It splits the large data set into smaller chunks which the ‘map’ task processes parallelly and produces key-value pairs as output. The output of Mapper is input for ‘reduce’ task in such a way that all key-value pairs with the same key goes to same Reducer. The Reducer then aggregates the set of key-value pairs into a smaller set of key-value pairs which is the final output.

An example of how MapReduce works

MapReduce Architecture

It has a master-slave architecture which consists of a single master server called ‘Job Tracker’ and a ‘Task Tracker’ per slave node that runs along DataNode.

  • Job Tracker is responsible for scheduling the tasks on slaves, monitoring them and re-executing the failed tasks.
  • Task Tracker executes the tasks as directed by master.
  • Task Tracker returns the status of the tasks to job tracker.

The DataNodes in HDFS and Task Tracker in MapReduce periodically send heartbeat messages to their masters indicating that it is alive.

Hadoop Architecture
.

B. What is Spark?

Spark is a software framework for processing Big Data. It uses in-memory processing for processing Big Data which makes it highly faster. It is also a distributed data processing engine. It does not have its own storage system like Hadoop has, so it requires a storage platform like HDFS. It can be run on local mode (Windows or UNIX based system) or cluster mode. It supports programming languages like Java, Scala, Python, and R.


Spark Architecture

Spark also follows master-slave architecture. Apart from the master node and slave node, it has a cluster manager that acquires and allocates resources required to run a task.

  • In master node, there is a ‘driver program’ which is responsible for creating ‘Spark Context’.
    Spark Context acts as a gateway for the execution of Spark application.
  • The Spark Context breaks a job into multiple tasks and distributes them to slave nodes called ‘Worker Nodes’.

  • Inside the worker nodes, there are executors who execute the tasks.
  • The driver program and cluster manager communicate with each other for the allocation of resources. The cluster manager launches the executors. Then the driver sends the tasks to executors and monitors their end to end execution.
  • If we increase the number of worker nodes, the job will be divided into more partitions and hence execution will be faster.


Data Representations in Spark : RDD / Dataframe / Dataset

Data can be represented in three ways in Spark which are RDD, Dataframe, and Dataset. For each of them, there is a different API.

1. Resilient Distributed Dataset (RDD)

RDD is a collection of partitioned data.


The data in an RDD is split into chunks that may be computed among multiple nodes in a cluster.

If a node fails, the cluster manager will assign that task to another node, thus, making RDD’s fault tolerant. Once an RDD is created, its state cannot be modified, thus it is immutable. But we can apply various transformations on an RDD to create another RDD. Also, we can apply actions that perform computations and send the result back to the driver.

2. Dataframe

It can be termed as dataset organized in named columns. It is similar to a table in a relational database.

It is also immutable like RDD. Its rows have a particular schema. We can perform SQL like queries on a data frame. It can be used only for structured or semi-structured data.

3. Dataset

It is a combination of RDD and dataframe. It is an extension of data frame API, a major difference is that datasets are strongly typed. It can be created from JVM objects and can be manipulated using transformations. It can be used on both structured and unstructured data.


Spark Ecosystem

Apache Spark has some components which make it more powerful. They are explained further.

1. Spark Core

It contains the basic functionality of Spark. All other libraries in Spark are built on top of it. It supports RDD as its data representation. Its responsibilities include task scheduling, fault recovery, memory management, and distribution of jobs across worker nodes, etc.

2. Spark Streaming

It is used to process data which streams in real time. Eg: You search for a product and immediately start getting advertisements about it on social media platforms.

3. Spark SQL

It supports using SQL queries. It supports data to be represented in the form of data frames and dataset.

4. Spark MLlib

It is used to perform machine learning algorithms on the data.

5. Spark GraphX

It allows data visualization in the form of the graph. It also provides various operators for manipulating graphs, combine graphs with RDDs and a library for common graph algorithms.

.

C. Hadoop vs Spark: A Comparison

1. Speed

In Hadoop, all the data is stored in Hard disks of DataNodes. Whenever the data is required for processing, it is read from hard disk and saved into the hard disk. Moreover, the data is read sequentially from the beginning, so the entire dataset would be read from the disk, not just the portion that is required.

While in Spark, the data is stored in RAM which makes reading and writing data highly faster. Spark is 100 times faster than Hadoop.

Suppose there is a task that requires a chain of jobs, where the output of first is input for second and so on. In MapReduce, the data is fetched from disk and output is stored to disk. Then for the second job, the output of first is fetched from disk and then saved into the disk and so on. Reading and writing data from the disk repeatedly for a task will take a lot of time.

But in Spark, it will initially read from disk and save the output in RAM, so in the second job, the input is read from RAM and output stored in RAM and so on. This reduces the time taken by Spark as compared to MapReduce.

2. Data Processing

Hadoop cannot be used for providing immediate results but is highly suitable for data collected over a period of time. Since it is more suitable for batch processing, it can be used for output forecasting, supply planning, predicting the consumer tastes, research, identify patterns in data, calculating aggregates over a period of time etc.

Spark can be used both for both batch processing and real-time processing of data. Even if data is stored in a disk, Spark performs faster. It is suitable for real-time analysis like trending hashtags on Twitter, digital marketing, stock market analysis, fraud detection, etc.

3. Cost

Both Hadoop and Spark are open source Apache products, so they are free software. But they have hardware costs associated with them. They are designed to run on low cost, easy to use hardware. Since Hadoop is disk-based, it requires faster disks while Spark can work with standard disks but requires a large amount of RAM, thus it costs more.

4. Simplicity

Spark programming framework is much simpler than MapReduce. It’s APIs in Java, Python, Scala, and R are user-friendly. But Hadoop also has various components which don’t require complex MapReduce programming like Hive, Pig, Sqoop, HBase which are very easy to use.

5. Fault Tolerance

In Hadoop, the data is divided into blocks which are stored in DataNodes. Those blocks have duplicate copies stored in other nodes with the default replication factor as 3. So, if a node goes down, the data can be retrieved from other nodes. This way, Hadoop achieves fault tolerance.

Spark follows a Directed Acyclic Graph (DAG) which is a set of vertices and edges where vertices represent RDDs and edges represents the operations to be applied on RDDs. In this way, a graph of consecutive computation stages is formed.

Spark builds a lineage which remembers the RDDs involved in computation and its dependent RDDs.

So if a node fails, the task will be assigned to another node based on DAG. Since RDDs are immutable, so if any RDD partition is lost, it can be recomputed from the original dataset using lineage graph. This way Spark achieves fault tolerance.

But for processes that are streaming in real time, a more efficient way to achieve fault tolerance is by saving the state of spark application in reliable storage. This is called checkpointing. Spark can recover the data from the checkpoint directory when a node crashes and continue the process.

6. Scalability

Hadoop has its own storage system HDFS while Spark requires a storage system like HDFS which can be easily grown by adding more nodes. They both are highly scalable as HDFS storage can go more than hundreds of thousands of nodes. Spark can also integrate with other storage systems like S3 bucket.

It is predicted that 75% of Fortune 2000 companies will have a 1000 node Hadoop cluster.

Facebook has 2 major Hadoop clusters with one of them being an 1100 machine cluster with 8800 cores and 12 PB raw storage.

Yahoo has one of the biggest Hadoop clusters with 4500 nodes. It has more than 100,000 CPUs in greater than 40,000 computers running Hadoop.

Source: https://wiki.apache.org/hadoop/PoweredBy

7. Security

Spark only supports authentication via shared secret password authentication.

While Hadoop supports Kerberos network authentication protocol and HDFS also supports Access Control Lists (ACLs) permissions. It provides service level authorization which is the initial authorization mechanism to ensure the client has the right permissions before connecting to Hadoop service.

So Spark is little less secure than Hadoop. But if it is integrated with Hadoop, then it can use its security features.

8. Programming Languages

Hadoop MapReduce supports only Java while Spark programs can be written in Java, Scala, Python and R. With the increasing popularity of simple programming language like Python, Spark is more coder-friendly.


Conclusion

Hadoop and Spark make an umbrella of components which are complementary to each other. Spark brings speed and Hadoop brings one of the most scalable and cheap storage systems which makes them work together. They have a lot of components under their umbrella which has no well-known counterpart. Spark has a popular machine learning library while Hadoop has ETL oriented tools. However, Hadoop MapReduce can be replaced in the future by Spark but since it is less costly, it might not get obsolete.

Learn Big Data Analytics using Spark from here

Subscribe for MMS Newsletter

By signing up, you will receive updates about our latest information.

  • This field is for validation purposes and should be left unchanged.


Red Hat Becomes Steward of Java 8 and 11

MMS Founder
MMS RSS

Article originally posted on InfoQ. Visit InfoQ

Red Hat has taken the leadership role of managing Java 8 and Java 11, under the guidance of technical lead, Andrew Haley. This role appears alongside Oracle’s focus on future Java releases moving in the 6-month release schedule.

Andrew Haley is one of five members of the OpenJDK Governing Board, and discussed this transition back in September 2018 in a blog post, “The future of Java and OpenJDK updates without Oracle support.” The change is expected to be nondisruptive, but may require some users to change where they obtain Java releases. This may affect users of Java 8 who previously obtained updates directly from Oracle, and would now need to locate another distribution. This change will likely not impact users of Java 11 who seek updates without cost, as Oracle previously clarified the policy of what is free (OpenJDK) and what is not free (Oracle’s Java distribution). Users with any questions on cost can consult a write-up by the Java Champions entitled “Java is Still Free” or review a previous speaker panel “Java is Still Free?” which raises a question and answers it with yes.

Red Hat is committed to supporting Java 8 and 11 as long-term support releases. This includes commercial support for Windows. Java 9 and 10 are absent, as they are short-lived releases. When questioned about support for those releases, Haley replied, “Probably not, no. I don’t expect that we’ll have any interest in keeping non-LTS releases going beyond their natural lifespan.”

One major feature in Red Hat’s distribution is the presence of Shenandoah, a low-pause garbage collector. Shenandoah project lead Roman Kennke and performance expert Aleksey Shipilev provided details of Shenandoah in a talk, “Shenandoah GC: The Next Generation.”

Aleksey Shipilev is also the largest individual contributor to this Java release, providing 62 of 83 commits by Red Hat. Other community contributions include 58 commits from SAP, 23 from Oracle, 7 from individuals, 7 from Google, and 5 from Amazon who manages their Corretto branch.

Security is significant driver in the need for maintenance and patching. The recent set of April releases include fixes for five remote unauthenticated security issues. The three highest issues impact Java Web Start and Applets, a technology that was deprecated in Java 9. One attack, CVE-2019-2684, impact Java RMI services, uses techniques similar to those in Mogwai Labs’ write-up, “Attacking Java RMI services after JEP 290.”

Other changes in this release include the addition of the new Japanese era, named Reiwa. This new era exits the previous Heisei era as Japan transitions to a new emperor. The change for Java developers will come from the JavaTime packages, specifically java.time.chrono.JapaneseEra.

Subscribe for MMS Newsletter

By signing up, you will receive updates about our latest information.

  • This field is for validation purposes and should be left unchanged.


Presentation: BBC iPlayer: Architecting for TV

MMS Founder
MMS RSS

Article originally posted on InfoQ. Visit InfoQ

Transcript

Buckhurst: My name is David Buckhurst. I’m an engineering manager for iPlayer BBC Design Engineering, which is the technology heart of the BBC. I look after 10 or so teams who build our big screen experiences, so not just iPlayer but any of our apps that run on set top boxes, TVs, games consoles. What’s this talk about then? Hopefully you’ve read the abstract so it’s not a total surprise. But this isn’t the usual talk we do when we’re talking about iPlayer. There are some great talks on the internet about video factory, about continuous delivery, about how we do our delivery pipeline. But I’m going to talk about TVs.

On and off for the last 8, 10 years I’ve been building video applications, particularly big screen TV experiences. This is a domain that I’m heavily invested in, and yet TV application development is largely a bit of a mystery. iPlayer TV and mobile teams are all based Salford, Media City, pictured. We saw a base for a big proportion of our design engineering teams, certainly the biggest proportion of our iPlayer people. A picture from outside our office. For a bit of context, a lot of content production happens at the BBC, particularly in Salford. So it’s not uncommon for something totally random to be happening in the morning when you come in, like a jousting tournament.

It is very different from anywhere I’ve worked before which – it’s always been software companies, tech companies about selling software and services. I’m also always asked to put more pictures of our offices in our talks, but really the primary feature of our offices is the sheer number of TVs we have and devices everywhere. We’ve got walls for monitoring. This is specifically our broadcast data player. We have store rooms that are full of TVs and we’ve got hundreds of TVs in offsite storage. If an audience member phones up and they’ve got a problem with a particular device, we can quickly retrieve it and test it to see if there’s a problem there. We’ve got racks and racks of old set top boxes and things like that for testing our broadcast chain. Even if we find an unused corridor, we’re pretty likely to just line it with TVs for testing. This did turn out to be a fire escape, so yes, I got in a little bit of trouble for that. Learn from your mistakes.

Why do we work in an office where the number of TVs outnumber humans 10 to 1? Well, there are two important factors to TV app development. One is the TV ecosystems themselves, which were a challenge, and we’ll talk about that shortly. The second is our public service remit which, so pictured here is the Royal Charter which sets out our purpose. Central to the idea of what we are as a public service entity is this this concept of universality. There are 25 million homes in the UK and we’re obliged to make sure that BBC content is available to as many of those homes as we can, which means we can’t really target specific devices. We can’t go after just the high end TVs that are easy to work with. We have to target as wide a range of devices as we can in order to make sure we hit as many homes as we can.

What’s a TV App?

So, what’s a TV app then? Well, I’m assuming everyone knows how to build web applications, and developing the bar for mobile application development’s really lowered these days. I mean, none of this is easy, but it’s a known thing, whereas TV apps are still a bit of a mystery. While we have multiple web and mobile development teams all across the BBC sitting with production teams, etc., all TV development happens on one floor in Salford. So we build a number of different apps for all the different departments in the BBC.

There are three categories roughly of application as far as we think of it. There’s broadcast applications, there’s JavaScript applications, and there’s native applications. So broadcast applications, it’s the first classification. These have been around for a while. They were developed in the ’60s, launched in the mid-70s, if you remember Ceefax and Teletext. Not a lot of people are aware, but when you’re watching a TV show on a BBC channel, there’s actually an application running in the background and that’s running in MHEG, and it allows us to do things like expose red triggers.

MHEG, not to be confused with MPEG, stands for the Multimedia and Hypertext Standards Group, which is basically a platform and a programming language for allowing you to display interactive text and graphics. So things like this. The red button digital tech services are built in MHEG. It lends itself well to the idea of scenes and then mixing graphics and text together. Radio slates. See, if you go to a radio channel, they’re built in MHEG. It is it is a legacy technology and the industry is moving away from it, but it’s still a pretty major platform for us, although things like HPV TV are coming along to replace that.

MHEG is significant for a couple of reasons. One, we still use it a lot, and we’ll talk about in a bit, but also the first implementation of TV iPlayer was built in MHEG. So iPlayer launched December 2007, initially as a desktop app, and there was a lot of controversy at the time, I recall. I wasn’t working for the BBC at the time, but I remember there was a big argument about who should foot the bill as the internet was suddenly going to become this place for distributing video. But 2007 really marks the birth of internet video services, so there wasn’t really any looking back. So this was the first TV iPlayer built in MHEG. It is a technological marvel. I’ll happily talk about that if you join me in the pub later. Yes, not going there.

The second classification, JavaScript applications. TV started to feature basic HTML browsers supporting JavaScript. If you remember doing web development in the ’90s, you’ve got the idea, right. These were ancient forks of open source browsers. They were all a nightmare to work with. No two browsers were the same. However, it was the direction the industry was going in, and we were about to get quite heavily invested in it. Picture this, iPlayer, so this is the JavaScript implementation. Yes, mostly applications these days on TVs are JavaScript apps running on browsers on TVs. We’ve got other apps. There’s a sports app which sort of blend of news, live content, text content. Got a news app, which again, JavaScript but focused on tech stories. So, most of our development effort goes into building and improving the JavaScript apps and ecosystem. And really, that’s what this talks about.

Very briefly I mentioned the native applications. So for example, the Apple TV application we’ve got here. So I’m not really going to go into these in any detail other than to say, we used to build a lot of bespoke native applications and it’s not really the direction that was right for us. It’s something we’ve been moving away from. Finally, it’s worth mentioning that our integration with the platform isn’t just about an app. For example, to promote your content on some platforms you have to expose feeds. For example, this is a Samsung homepage and we’ve got our recommended content appearing as a row. There is native integration, as well as those apps themselves.

Bet on TV

2012 which was the year I joined the BBC, was also the year of the London Olympics. That was the year that the BBC really decided to get behind TV experiences. The BBC’s promise was to deliver coverage of every single sport from every single stadium, and so digital offerings were really going to play a major part in being able to do that. When I joined, there were 14 different iPlayer for TV code bases. We had custom Wii, Xbox apps, MHEG implementations, multiple HTML, JavaScript applications, action script. But that was pretty much the full time of the department, supporting all these different code bases. So this desire to build any more apps was just unsustainable. We started to focus more on a standards approach. So leveraging web standards, but for TV browsers. That would help us scale better for the audience, and that standard was HTML5 running JavaScript.

We published a specification that sets the bar for TV application experiences. We didn’t just want to build to the lowest common denominator of a TV browser, but wanted a rich experience for everyone. We’ve got a spec and we publish that every year and update it depending on what the new capabilities we want to support are, and then we’ve got strict certification testing. This is a queue of TVs waiting to be certified, but basically manufacturers send us their TVs, then we certify to see whether iPlayer’s performances is what we expect on those devices. o we test that it meets the spec.

There was also an ambition for other TV apps, so news and sport, etc. But with all TVs using different browsers, a big part of the iPlayer code base was the abstractions that allowed us to deal with all the different browser types that we had. We extracted that into something called TAL, which is our open source platform for building TV applications, which we released about five years ago. This quickly meant we could spin up teams to build new apps and it helped us scale. Developers wouldn’t have to deal with abstracting the differences between all the different browsers.

What is TAL, then? TAL gives us two things. There are a bunch of abstractions, so things like video playback is exposed very differently on different devices, even things like pressing the up key is very different on different devices. This gives us this base with which to work and build all our other applications. Then the other part to TAL is there’s a UI Builder that lets you use widgets and components to build up your UI. So yes. This let us spin up some teams. We were able to build some new application experiences without having to multiply a code bases by 14 times for each product. So pictured here is the four main apps from about five, six years ago. They do look quite similar, but that’s more due to the designers sharing their designs, than anything that TAL really gave us because TAL was quite a low level abstraction.

But it was a big step forward for us, TAL. It’s used by a number of different TV application developers. It also allows manufacturers to contribute back when their platforms change. And on rare occasions, I’ve hired developers who’ve worked on TAL. It definitely has paid off for us. But there are numerous challenges still. So as the number of apps grew and the number of devices grew, the approach didn’t necessarily scale. It coped well with the device abstraction, but from a user perspective, and from a development perspective, there are issues.

From the user perspective, these were separate experiences. They weren’t really a unified offering. It was very slow to switch between applications. From a developer perspective, we weren’t really gaining much of the advantage of our shared layer of TAL because it was it was so low level that there was a lot of duplication of effort. So porting a bug to play back in iPlayer – we fix a bug in iPlayer, we’d still have to port that into a new sport red button. There was quite a lot of overhead, and also each of these apps has a totally different mechanism for launching. We somehow didn’t really want to go into much in this talk, but if you think about it, TV apps, while there might be browsers, you can’t just type something into a URL. There’s a whole team I’ve got that is focused on how you launch into applications in the right place.

The TV Platform

There was also the reality that, I think, TV wasn’t growing as an audience platform as much as we’d hoped. There was a lot of continued investment in something that we didn’t know when it was going to pay off. And a lot of people still thought that mobile was the real bet. So, what we had, four fundamentally different code bases built on one platform. We decided to introduce another layer. The idea here was we rebuilt all of our applications as a single platform using config to drive out the differences between the product. For example, our sports app was just iPlayer but with some sports branding, a yellow background, but then with substantially different program data, it meant it was a totally different experience. So essentially, we had a monorepo. It was a single runtime, so a single deployable client, so all our applications with the same code just exposed with a different kind of startup parameter. Immediately, it eliminated a vast amount of duplication. Any changes we made to one product would immediately result in improvement in all the others. Talent upgrades only had to happen once and then the whole thing was config-driven.

I’ve captured here one of our technical principles. It’s also our longest technical principle, but a really important one, which I think is key to how we’ve actually evolved our TV apps over the years. The principle SO1, which is the logic for our products and systems is executed in the most consistent runtime environment and available avoiding the need for runtime abstraction and logical duplication wherever possible. So really, the move from a platform model for the client meant we needed to do more work in the services, as we wanted to push as much logic out of that client as we could. So we introduced the backend-for-frontend architecture.

It’s my really rough diagram of what that looks like, but essentially, we were pulling BBC data from all over the place. Our TAP client had a consistent idea of what the schema for its data should look like. What our backend-for-frontend architecture did was provide- we called them mountains, just because if we can name them after random things – basically allowed us to take that data from different parts of the BBC and then present it in a way that the client understood. That was that was great. We were moving to the cloud, we had the opportunity to modernize the way we worked to see a continuous delivery. I put this diagram up. I don’t expect you to get anything out of it really, but it illustrates the complexity of the estate that we were dealing with, like that the sheer number of BBC system that we were pulling data over from everywhere, and then mangling it into a form that the client could deal with.

Slightly easier picture this one. But essentially, you can see we had some AWS services, some on-prem services, and then a real separation of our business concerns and the data logic. It let us move faster, all the good things from continuous delivery, from DevOps, allowing us to scale services independently, testability in isolation. But I don’t want to cover that stuff too much.

TV Takes the Lead

It’s round about this point when TV started to take the lead. When I started at BBC, TV apps were about 10% of the of the overall iPlayer usage, but we’ve reached a point today where 80% of all internet traffic is video content. Growth over the last few years has been absolutely phenomenal. This was the latest graph I could find for iPlayer usage where you can see it’s just been consistent. It starts at 2009 here, and every year it grows and grows.

The more interesting graphic, at least from my perspective, is this one that shows the split between the different platforms. As I said, 10% was initially where TV was, and we’re now at nearly 60% of overall iPlayer usage. So, certainly it’s the premier platform. But we’ve been content with slowly evolving our offering, making sure that we are optimized for engineering efficiency, rather than the speed of change that the BBC was now asking us to look at. So BBC was moving towards signed in experiences that would require a major reworking of our applications, and we were getting a lot more content. As iPlayer shifted from a catch up experience to a destination on its own, we were going to have a lot more stuff to show.

We had this large, monolithic front end, that was slow to iterate on, and it was quite difficult to work on. While the backends were quite pleasant in the modern JavaScript, we had a frontend that no one really wanted to work on. So everyone said, “Look, we just want to do react.” Then in addition to this, we got more and more reports of iPlayer crashing, because as this client was getting bigger and bigger, what we found was the devices weren’t quite coping with it. So it became clear that we were at the verge of the biggest change to how we were going to do TV application development. Could we get something like react working on browsers?

We had a lot of preconceptions about what was and what wasn’t possible from years and years of dealing with devices that never really performed. We threat set ourselves three rules. Where possible, we use off-the-shelf libraries, performance must be improved, and we can’t start from scratch. iPlayer was far too mature product to just start with a Greenfield.

Two things that we had to understand about the devices we’re building for if we wanted to make a major change like this, where we’re pretty much changing everything, capability and performance. The first one, capability, it wasn’t really an option to go and get every single device we had out of storage and start seeing which flavors of JavaScript worked with them. We had to devise a mechanism whereby we could experiment and find out what the actual devices that people were using were doing. What we did was when iPlayer loads, there’s a small little try block where we can execute a tiny bit of arbitrary JavaScript. So what that let us do was run a small bit of React or a web pack code or whatever it might be, to see what the compatibility would be like on all the devices out there, because we still didn’t know if these kind of technologies would work or not.

Actually, the finding was that pretty much most of the devices out there would support React. It was only about 5% that couldn’t typically if you’re not supporting something like an object-defined property. Then we had some unknowns, where one day the devices would be reporting they could and one day they’d be reporting they couldn’t, which we assumed was due to changes to the firmware on those devices that meant they supported for recent versions of JavaScript. So, we knew it was it was possible, but the bigger challenge was around performance. We were already hitting performance issues with our custom built framework, and specifically memory. We had a number of TVs that we could use to do debug memory profiling, but we didn’t really have any good way of doing it in a reliable or repeatable, automated way that we could actually get behind.

This is the rig we built for doing memory profiling. We did use a bunch of different devices, but largely because FI TVs are Android TV devices, they’re easy to reboot and get consistent results. We plugged a whole load of these into the hive, which is our device testing farm, and we managed to get some consistent graphs out that showed us the memory use. You can ignore the actual numbers, because it’s the difference between the numbers that’s more significant. So we started to see these really interesting, interesting graphs of memory performance.

And there was this particular kind of signature that we were seeing as you navigated through all of our applications. At point A, that’s the point when someone had navigated to a new menu item, and therefore the whole process of requesting some new JSON building up the UI or changing whatever that experience on the screen was would happen. Then it sort of flattens, and then at point B, we’d see that memory drop down again. So our assumption at this point was that the kind of the memory overhead with building those UI components with parse in the JSON was causing the memory increase, and then at point B, the garbage collector was kicking in.

So we did the obvious thing. There was a memory leak. Over a minute period, we had this consistent line upwards, that stuff was easy to fix. But what we started doing was looking at builds from the last 12 months to really get an idea of was there a correlation between features we built, the code we were writing, and the memory usage? That was quite startling. One of the one of the main culprits was thisDEF, which shows the memory usage before and after what we called the purple rebranding. This was when we introduced the purple shards and things in the background. But basically, we were moving to very large images, background images, the sort of things that devices we were working with didn’t really like.

Another big change and culprit for memory bloat was just the sheer number of images on the display. Over the years, the amount of content in iPlayer has gone up and up and therefore we’ve had far more images being loaded. So that was one of the biggest changes to memory use. And then one of the massive ones we saw was- so with iPlayer, if you’re watching a video, you can go back and navigate the menus and the video’s playing in the background. That actually was one of the biggest causes of devices crashing. We saw that really chewed up a lot of memory.

Our findings are summarized here. Number of images, processing of JSON and constructing of the UI, video in the background and going purple were the four main causes. What was clear, though, is that certainly the way that we were building UI wasn’t that different from React. So the idea of having React on device, it wasn’t really going to solve any of the performance issues that we had. What we’ve got is a fairly painful memory intensive process where we passed the JSON that the client requests, we interpret what that means and work out what the UI should look like, and then build up a DOM, and change that out in the screen. React turned out to be pretty equivalent in its memory usage.

Our real preference was to remove that whole UI Builder capability all together. And so we basically moved to the idea of using server side render wherever we could. This meant that we have a hybrid app where some of the logic is in the client, but then a lot of it is HTML, it’s JavaScript chunks, it’s CSS built by the back end and then swapped out in the right places on the client. Performance massively increased, our lower performing devices loved it. Memory Usage really went down. The garbage collection seem to kick in and managed better with that. There was less need for the TAL abstractions. And importantly, we had way less logic in the front end, so it was much easier to test and reason with that.

This is before and after. We reduced memory usage quite significantly despite actually tripling the number of images and the complexity of the UI that we had. We were using significantly less memory, performance was better and we were motoring again.

Learning from Failure

I think the biggest change for us in iPlayer, and I think this is a common story everywhere, is taking on operational responsibility for our system. We literally went from a world where we handed over RPMs to an ops team, they managed any complaints, they managed scaling and then suddenly, we had to learn like all of this. So basically, we had every lesson about scaling and dealing with failure to learn from. This is why I love working for the BBC, is this constant learning culture. We were no longer shield it from the daily barrage of audience complaints, and so we were just inundated with problems. Apps failing to load, being slow on some devices.

But in a lot of cases, when we investigated a complaint, it might turn out to be a Wi-Fi problem or a problem with a particular device. We realized we really didn’t have a good grasp of our domain at all. Of course, the only way to really improve something with confidence is to be able to measure the problem. We went about building a telemetry system that could give us real time insight into what was actually happening on our estate. This is actually last week’s launch stats. Our telemetry system basically lets us put checkpoints at all stages of the app loading. So there are lots of different routes into the app. You can press red, press green, you can launch through an app store. This lets us break down by model, by device, by range, so that if we’ve got complaints or if we’re seeing problems, we can go and look at the stats and see if it’s a localized problem or if it’s a general problem.

That really allowed us to tackle what the real problems were, and which they weren’t. This is another really interesting thing from the launch stats, is the pattern of usage we have. Because we largely serve the UK, there’s no one using it at night. When people get up in the morning, you get this little hump just as people are watching whatever they watch in the morning. But then come eight o’clock at night, we get these massive peaks as everyone jumps on to iPlayer. Again, we see it a lot on program boundaries. People finish watching whatever it is they’re watching on TV, realize they don’t want to watch the next thing and so they put iPlayer on. We can pretty much tell every half an hour or every hour, we get these spikes as people decide they’re going to launch into iPlayer experience.

Despite that general pattern which does allow us to scale, so we really scale up in the evenings. We can get some real unpredictability, like this spike, which was nearly a million launches a minute that hit us back last year. So we’re very sensitive to things like continuity announcers telling the viewer that they can watch more content on iPlayer. So yes, if they say something like, “Oh, yes, you can watch the rest of this show on iPlayer,” we’ll suddenly get a million people trying to tune into that. So, our approach has been that we do scale up very aggressively at peak times, but also we’ve had to engage with our editorial colleagues and be part of that promotion strategy. We need to know when you’re going to tell people to use our systems if you’re doing it after 8 million people have watched something. But also, we can help them better understand how successful their promotions are. So it is win-win.

Another key strategy for dealing with the TV domain – almost everything in iPlayer has a built in toggle and a lot of this is driven by device capabilities, so device support live restart or how many images could a device realistically cope with. This is our toggle for turning off the heartbeat that we send back during the video play. But yes. The complexity of the TAP ecosystem increased with data arriving from all sorts of places across the BBC, so it wasn’t really good enough to assume that everything worked. Building in toggles became really, really important. We use them for testing rollout of new features, we’ll expose new features in the live system and then turn it on for testing. We can use them for operational toggles when we know there’s a problem. And once we get happier with them, we can use them for automated fail back degraded behavior.

A great example of this is during live events when we get really high volumes of traffic. For example, the World Cup last year. We were streaming UHD. It was our big live UHD trial. We knew we might have a problem with distribution capacity. This graph shows our top end bit rate for HD streams, about five megabits per second, for UHD that goes up to about 22 megabits per second, and then live UHD is about 36 megabits per second. So, the problem with live content is it pretty much needs to be stream simultaneously with the live event. Encoders aren’t quite mature enough yet to achieve the level of compression that we’d need to really bring that down. I think we worked out that if every compatible device in the UK tried to watch the UHD streaming concurrently, then the UK internet wouldn’t actually have the distribution capacity to deal with it. So, we derived this limit of 60,000 live streams which was the limit to which we could cope for the World Cup.

We had to build something called our counting service, which allows us to get you pretty much real time insight into particular metrics we care about. In this case, it’s how many UHD streams have we got? We did actually hit the cap for a couple of times in the World Cup. One was for the England vs Sweden game. So, new viewers coming in attempting to watch UHD were only presented with a HD stream. That said, the worst did still happen. We were overloaded by traffic turning up to watch the last few minutes of the match. And there’s nothing like being on the front page of the Metro to make you learn fast from failure.

While it’s a, only a single deployable app at any one time, we can have multiple versions of the client talking to our backend systems. We’ve used version schemas a lot to be really able to make those changes with confidence. So what can happen is someone is using the client, they’re watching a video. We make a change. Someone launches, they’re using a new version of the client. If there’s any schema changes to the API using the back end or front end, you’re going to get a problem at that point. So, schemas are great and that we can use them to generate test data that protects us from blind spots in our testing. We can also use them to check live data to make sure that our upstreams are conforming to the schemas that we’ve agreed, and that there’s nothing unexpected happening.

We also realized that the idea of a pure server side rendered approach wouldn’t provide the quality of experience that perhaps the audience expected. It was my belief that the client could essentially be a browser within a browser. But we needed to be a lot more than that. There was a lot more resilience required to be reactive to back end problems. A great example of how we manage upstream issues comes from this example which is how we degrade our playback controls. So this is, I guess, the part of the app that people spend most of their time in and you’ve got various control options. You’ve also got suggested onward journeys, recommended content to watch the peaks up at the bottom there. You’ve got an added button for adding it to your user favorites.

There’s also Metadata. So if any of those systems are having any kind of scaling problems, we can basically turn off any of those things and they’ll actually just scale back. So in fact, you can get to a point where you’re happily watching “Bodyguard” and all the rest of the BBC systems are down, well you’ve still got some very, very basic controls that are baked into the client. So that mix of the server side rich functionality and the onward journeys and everything, and then just the simple journeys that we look after on in the client code itself. When we rolled this out, my wife, she complained to me. She was like, “I can’t find a fast forward button.” I was thinking, “Oh, that’s brilliant because if it was this time last week, you’d be complaining that the video had stopped playing.” So it was a quite reaffirming, that.

What’s Next?

What’s next then? I think one of the most interesting opportunities for the BBC, being a broadcaster, is leveraging the world of broadcast technology. And it brings this talk full circle to what I was talking about MHEG at the beginning. But there’s this this junction where our MHEG world of broadcasting and our JavaScript world of IP join. I don’t know if you’ve seen the green button triggers, but these are graphics that we broadcast that are displayed by the MHEG app that are timed to only be displayed at the right points in the program where you’ve come in and missed the beginning.

There’s quite a lot of logic and complexity going on there, but there’s even more to it than that because the EDC check, you’ve got internet access and use to check, you can actually launch iPlayer on that device. But the big thing though, and a big change from a broadcast experience is that suddenly in the broadcast domain, you have to understand what load that the client’s actually going to encounter. So the World Cup UHD problem, even if only a small percentage of the potentially millions of people watching an episode of “Bodyguard” decides to press green to watch it from the start, that we could have real capacity issues there. It’s very, very hard to tell how many people follow those triggers.

Another journey we’ve been playing with is this one, which is press red to watch the rest of the episodes on the box set. Again, it’s impossible to know how popular a program’s going to be, how many people actually want to binge this thing. So we have to tie these things into our counting service so that we can’t go over capacity. We have to be able to scale in advance of these kind of triggers, otherwise we can have really big problems, and we can suppress the triggers if we need to.

I think these broadcast to IP journeys are really interesting for me, because they do represent this union of two very different worlds. There are two very different priorities. The challenges are very different. The development practices are very different. And while they both serve millions of viewers, they do so in very different ways. For example, broadcast, you might think it’s got millions of people watching it, but effectively the load is one, so that data is being played out higher. It’s being broadcast out. Whereas IP, you’ve got millions of people directly connecting to have that personalized data experience. Availability typically measure in broadcast five to seven nines, IP, you’re lucky really, if you’re talking in three nines. Data-wise, the broadcast has very much a push model where things change and you push it out to the user and it gets broadcast to their box. Whereas IP, very much a pull model, you want the latest live data. Security, I mean, broadcast is amazing. Everything’s triply locked down and triply encrypted, whereas IP, they run tracks at conferences on security for IP systems.

And then even the approach to risk, like broadcast there’s this great mentality of well, it’ll never fail and everything’s triply redundant, and there’s extra data centers everywhere and nothing can ever fall over, or if it falls over, there’s always another entirely expensive data center or broadcast tower to play it out. Whereas IP, the philosophy is very much about learning from failure and fail fast. So, I think there’s a lot that these worlds can learn from each other, which is what makes that triggering work really, really interesting. Our broadcast estate has to have kind of operational triggers that monitor live load, and our IP estate has been challenged to think about resilience and push models, and what can we borrow from broadcasts that makes sense in the IP world?

I think that clash captures the real opportunity that the BBC has, now as audiences make this transition from broadcast to IP. I wanted to end on this quote from our CTO. He said that, “We need these attributes of broadcasting to be carried over to the digital age and should have the ambition for them to be amplified by the creative potential of the internet.” So, he was referring to the qualities of broadcast experiences, so things like quality, breadth, universality. But I think it’s equally true for broadcast technologies. And for engineers, we need to learn from the platforms that have come before us.

Questions & Answers

Participant 1: What sort of lifetime are you planning for supporting a TV for?

Buckhurst: We typically support them for about eight years. That’s what we aim for. The spec evolves every year and we do our best to keep devices running for as long as possible. But that does reach a point where the audience on a particular device range is not significant enough. To keep it going can become very costly. It depends on what the stack is and what the capabilities are. I think also the reality these days is people can buy quite inexpensive sticks and things to plug in and upgrade their TVs.

Participant 2: Was there a particular reason that you guys decided to have a server side rendered JavaScript onto the TV, instead of pushing the application to TV? Something like a hybrid package just shipped to the TV that stays there?

Buckhurst: There are a few things. One, is as much as possible we wanted to turn TV application development into web development, right? We could use React’s backend. We could we could just bring in web developers who’d feel comfortable working with that. But then they own a small chunk of the application. And then the clients there to glue all the parts together and keep the resiliency there. So some teams only really deal with the backend services and they do server side, and then more about solving the business challenges of iPlayer. Some teams are a bit more focused on the client. And then some teams have a mix of both where it makes sense.

Participant 3: Thank you for the talk. Is there a way of using emulators instead of physical TVs, or are those just for those high end [inaudible 00:43:03]

Buckhurst: We have played with emulators in the past. You don’t typically get many of these days and they tend to be sort of the same level of experience we’d see on the TV’s. We also prefer using retail models of televisions, so we know we’re actually dealing with the real user experience, because quite often the debug versions don’t really represent the retail versions. But yes, certainly these days we don’t really use any emulators.

Participant 4: Thanks for the presentation. I noticed the “Game of Thrones” reference inside the mountains on one of the slides as well. Most comical game, which I thought was quite nice. You mentioned about you’d have different clients needing different schema versions. I’m just wondering how you handle that at runtime. Do you have redundant systems that have the old data schema or is it only additive? Do you only add new …?

Buckhurst: We have tests that can run against the client or the backend, and the schema tests, they basically have a version of the schema that they’ll run. So, I guess, if there are 10 different clients out there, it should be running 10 different versions of those tests. Years back we used to have a lot of devices we’d have to hold back and they’d have to run on older versions of the client, particularly as everything was client side. So these days it’s pretty much just, has someone just left iPlayer on for two days if they’re going to be on really old version?

See more presentations with transcripts

Subscribe for MMS Newsletter

By signing up, you will receive updates about our latest information.

  • This field is for validation purposes and should be left unchanged.


Some Fun with Gentle Chaos, the Golden Ratio, and Stochastic Number Theory

MMS Founder
MMS RSS

Article originally posted on Data Science Central. Visit Data Science Central

So many fascinating and deep results have been written about the number (1 + SQRT(5)) / 2 and its related sequence – the Fibonacci numbers – that it would take years to read all of them. This number has been studied both for its applications (population growth, architecture) and its mathematical properties, for over 2,000 years. It is still a topic of active research.

Fibonacci numbers are used in stock market and population growth models

I show here how I used the golden ratio for a new number guessing game (to generate chaos and randomness in ergodic time series) as well as new intriguing results, in particular:

  • Proof that the rabbit constant it is not normal in any base; this might be the first instance of a non-artificial mathematical constant for which the normalcy status is formally established.
  • Beatty sequences, pseudo-periodicity, and infinite-range auto-correlations for the digits of irrational numbers in the numeration system derived from perfect stochastic processes
  • Properties of multivariate b-processes, including integer or non-integer bases.
  • Weird behavior of auto-correlations for the digits of normal numbers (good seeds) in the numeration system derived from stochastic b-processes
  • A strange recursion that generates all the digits of the rabbit constant

1. Some Definitions

We use the following concepts in this article:

  • A normal number is a number that has its digits uniformly distributed. If you pick up a number at random, its binary digits are uniformly distributed: the proportion of zero’s is 50% and the digits are not auto-correlated, among other things. No one knows if constants such as Pi, log 2, SQRT(2), or the Euler constant, are normal or not.
  • Rather than normal numbers, we rely on the concept of good seeds, which is a generalization to numeration systems where the base b might not be an integer. In such systems, the vast majority of numbers (good seeds) have digits that are distributed according to some specific equilibrium distribution, usually not a uniform distribution. Also they have a specific auto-correlation structure. Any number with a different digit distribution or auto-correlation structure is called a bad seed. Typically, rational numbers are bad seeds. Examples of numeration systems, with their equilibrium distribution, are discussed here, also here, and in my book.   
  • The concept of numeration system can be extended to non-integer bases. Two systems have been studied in detail: perfect processes and b-processes, see here. The b-process generalizes traditional numeration systems. In that system, a sequence x(n+1) = { b x(n) } is attached to a seed x(1), where the brackets represent the fractional part function, and b is a real number larger than 1. The n-th digit of the seed x(1) is defined as INT(b x(n)). When b is an integer, it corresponds to the traditional base-b numeration system. 
  • The perfect process of base is characterized by the recursion x(n+1) = { b + x(n) } and a seed x(1), where b is a positive irrational number. In that system, the n-th digit of the seed x(1) is defined as INT(2 x(n)). All seeds including x(1) = 0 are good seeds. Also, x(n+1) = { nbx(1) }. A table comparing b-processes with perfect processes is provided in section 4.1.(b) in this article. Perfect processes are related to Beatty sequence (see also here.)
  • By gentle chaos, we mean systems that behave completely chaotically, but that are ergodic. By ergodicity, we mean that these systems have equilibrium distributions, also called attractor distributions in the context of dynamical systems, or stable distributions in the context or probability theory. The equilibrium can be found using a very long sequence x(n) starting with any good seed, or using x(1) only and a large number of different (good) seeds.  

2. Digits Distribution in b-processes 

It is known that the digits are not correlated, and that the digit distribution is uniform if b is an integer. If the base b is not an integer, the digits take values 0, 1, 2, and so on, up to INT(b). Then, the digit distribution and auto-correlation (for good seeds) is know only for special bases, such as the golden ratio, the super-golden ratio, and the plastic number: see section 4.2. in this article for details. Also, the lag-k auto-correlation in base b is equal to the lag-1 auto-correlation in base b^k. The picture below shows the empirical lag-1 auto-correlation for b in ]1, 4]. The bumps are real and not caused by small sample sizes in our computations. 

Figure 1: Lag-1 auto-correlation in digit distribution of good seeds, for b-processes

Figure 1 shows that the the lag-1 auto-correlation, for any good seed, is almost always negative. In particular, it is always negative if b is in ]1, 2[. It is minimum for the golden ratio b = (1 + SQRT(5)) / 2 and in that case, its value is (-3 + SQRT(5)) / 2. This fact can be proved using results published here (see section 3.2.(a) about the golden ratio process.) 

Finally, unlike perfect processes that have long range (indeed, infinite range) auto-correlations just like periodic time series, for b-processes auto-correlations are decaying exponentially fast. See here for illustrations. 

The digit distribution, for b in ]1, 2], is pictured in section 4.3.(b) in this article. If b is in ]1, 2[, the digits are binary and the proportion of zero’s is always less than 50%. . 

3. Strange Facts and Conjectures about the Rabbit Constant

The rabbit constant R = 0.709803442861291 … is related to Fibonacci numbers (and thus to the golden ratio) used to model demographics in rabbit populations. It is typically defined by its sequence of binary digits in the ordinary binary numeration system (a special case of b-processes with b = 2) and it has an interesting continued fraction expansion, see here

We use here a different approach to construct this number, leading to some interesting results. First, let us introduce a new constant. We call it the twin rabbit constant, and it is denoted as R*.

The twin rabbit constant R* is built as follows:   

  • x(n) = { n (-1 + SQRT(5)) / 2 } for n = 1, 2, and so on
  • d(n) =INT(2 x(n)) is equal to 0 or 1
  • R* = d(1)/2 + d(2)/4 + d(3)/8 + d(4)/16 + d(5)/32 + …  = 0.6470592723139 …

The rabbit constant R is built as follows, using the same sequence x(n):

  • x(n) = { n (-1 + SQRT(5)) / 2 } for n = 1, 2, and so on
  • g(n) = INT(x(n))
  • e(n) = g(n+1) – g(n) and is thus equal to 0 or 1
  • R = e(1)/2 + e(2)/4 + e(3)/8 + e(4)/16 + e(5)/32 + …  = 709803442861291 …

Note that x(n) is a perfect process with b = (-1 + SQRT(5)) / 2.We have the following properties:

Facts and Conjectures

Here are a few surprising facts:

  • The digits d(n) and e(n), respectively of R* and R, are identical about 88% of the time. The exact figure is probably (4 – SQRT(5)) / 2.
  • If d(n) and e(n) are different, d(m) and e(m) are different, with m  > n, and for all values between n and m, the digits are identical, then m – n must be equal to 5, 8 or 13. This is still a conjecture; I haven’t proved it.
  • The function g(n) satisfies the recurrence relation g(n) = ng( g(n -1) ) with g(0). I published the proof in 1988, in Journal of Number Theory (download the proof). 
  • The lag-1 auto-correlation in the digit sequence e(n) is equal to (1 – SQRT(5)) / 2. You can try to prove this fact, as an exercise. This is lower than the lowest value that can be achieved with any good seed, in any b-process. We have the same issue with the sequence d(n). As a result, the binary digits e(n) and d(n) of the rabbit and twin rabbit numbers can not generate a good seed (or normal number) in any base
  • The proportion of digits equal to zero in the rabbit number, is (3 – SQRT(5)) / 2, also too low to be a good seed, regardless of the base. For the twin rabbit number, the proportion is 50%.

It would be interesting to study the more general case where b is any positive irrational number, constructing twin numbers using the same methodology, and analyze their properties.  Some of the candidate numbers include those listed in the Beatty sequence. Here we only focused on b = (-1 + SQRT(5)) / 2. As a general result, the binary digits of the twin numbers generated this way, can never generate a good seed in any base, because they are too strongly auto-correlated.

4. Gaming Application

We use this technology in our generic number guessing game. Our gaming platform features pre-computable winning numbers, and payout based on the distance between guesses and winning numbers. This system is described here, and I will present it at the INFORMS annual meeting in Seattle in October 2019. It mimics  a stock market or lottery game depending on the model parameters. At its core, among many sequences, we also use the golden ration b-process x(n) described in section 3.2 in my article on randomness theory. Here b = (1 + SQRT(5)) / 2. Of course, we start with a good seed. 

In order to make the number guessing process more challenging, we de-correlate the digits. For this purpose, we consider two options. 

De-correlating Using Mapping and Thinning  Techniques 

This option consists of de-correlating the sequence x(n). The first step is to map x(n) onto a new sequence y(n), so that the new equilibrium distribution becomes uniform on [0, 1]. This is achieved as follows:

If x(n) <  -1, then y(n) = x(n) / (b – 1) else y(n) = (x(n) – (b  1)) / (2 – b). 

Now the y(n) sequence has a uniform equilibrium distribution on [0, 1]. However, this new sequence has a major problem: high auto-correlations, and frequently, two or three successive values that are identical (this would not happen with a random b, but here b is the golden ratio — a very special value — and this is what is causing the problem.)

A workaround is to ignore all values of x(n) that are larger than – 1, that is, discarding y(n) if x(n) is larger than b -1. This is really a magic trick. Now, not only the lag-1 auto-correlation in the remaining y(n) sequence is equal to 1/2, the same value as for the full x(n) sequence with b = 2, but the lag-1 auto-correlation in the remaining sequence of binary digits (digits are defined as INT(b y(n)) is also equal to zero, just like for ordinary digits in base 2. 

Dissolving the Auto-correlation Structure Using Multivariate b-processes

An interesting property of b-processes is the fact that auto-correlations in x(n) are decaying exponentially fast. In fact, for any good seed, the lag-k auto-correlation in base b is equal to the lag-1 auto-correlation in base b^k. Note that if b is an integer, the lag-1 auto-correlation is equal to 1 / b

Another interesting property is the fact that two sequences x(n) and y(n) using different (good) seeds x(1) and y(1), and the same base b, are independent if the seeds are independent in base b. The concept of independent seeds will be formally defined in a future article, but it is rather intuitive. For instance, the seeds x(1) and y(1) = x(3) are not independent, regardless of the base.

Thus, in order to dilute the auto-correlations by a factor b^k, one has to interlace k sequences using the same base b for each sequence, but using k independent good seeds, one for each sequence. Doing so, we are actually working with multivariate b-processes that are not cross-correlated. The same mechanism can be applied recursively to each of the k sequences, eventually resulting in multiple layers of nested sequences (a tree structure) to further reduce auto-correlations. Finally, re-mapping the resulting process may be be necessary to obtain a uniform equilibrium distribution.

Note that if b is an integer, there is no need to de-correlate as the sequence of digits is automatically free of auto-correlations. Also, in that case, no re-mapping is needed as the equilibrium distribution is uniform to begin with. 

Related Articles

To not miss this type of content in the future, subscribe to our newsletter. For related articles from the same author, click here or visit www.VincentGranville.com. Follow me on on LinkedIn, or visit my old web page here.

Subscribe for MMS Newsletter

By signing up, you will receive updates about our latest information.

  • This field is for validation purposes and should be left unchanged.


How a Data Catalog Connects the What and the Why

MMS Founder
MMS RSS

Article originally posted on Data Science Central. Visit Data Science Central


“Technology is nothing in itself. What’s important is that you have faith in people, that they’re basically good and smart, and if you give them tools, they’ll do wonderful things with them.”

                                                                Steve Jobs

The what and the why 

Businesses today increasingly turn to big data and advanced analytics for their most troubling questions. The belief that if you get lots of data, a system to handle it (hardware, software), and a few smart people, the data will magically reveal insights.


But having more data doesn’t usually mean you have better data. A lot of bad data (unreliable reporting, missing observations) means a lot of noise which has to be filtered down. Second, having more data doesn’t help you determine causality between variables of interest. 


Data can tell you what is happening, but it will rarely tell you why. To effectively bring together the what and the why — a problem and its cause, in order to find a probable solution — leaders need to combine the advanced capabilities of big data and analytics with tried-and-true qualitative approaches such as human collaboration, interviewing teams, conducting focus groups, and in-depth observation. 


What can serve as a platform to do all this human collaboration? A data catalog.


 What is a data catalog?


A data catalog is a centralized repository of metadata, created to organize and unify data that was siloed in databases throughout the company – ERP, e-commerce stores, HR and Finance databases, and many others.

Further, it enables users to search this data using natural language. One can also discover new datasets by identifying relationship amongst data. With a data catalog users across an organization can find and understand data in a secure and governed environment. 


With use a data catalog keeps evolving both through the participants and AI.  The different roles of data catalog participants are — data organizers (data architects and database engineers), data curators (data stewards and data governors) and the data consumers (data and business analysts). 

See here for step-by-step guide to build a data catalog.


How can it help us? 


1) Enables analysts to find data from everywhere in the company – 

A data catalog collects and showcases all streams of data – qualitative as well as quantitative which can be critical for an analysis. Let’s consider an example – your company wants to understand how a loyalty program was received by customers. Of course, you want data from CRM department about how many customers participated in the program, and data about the program’s churn. But you also need to find out what customers are saying about the program and whether it’s enhancing – or hurting – the brand. Thus, comments on your Facebook page about the reward program is crucial. You can add the Facebook comments into the data catalog – and then get a complete picture about the program’s overall effectiveness.


2) Empowers data participants to seek advice, brainstorm and collaborate about data – 

 It starts with collaboration features, such as the ability to annotate data assets or participate in threaded discussions. Because of that, instead of having to track down the expert or team responsible for the data in order to get a question answered, a user can immediately see who is engaging with the data and reach out to them for help. 


3) Motivates data participants to share tribal knowledge

If participants get recognized for their knowledge, they are more likely to share it. But where? A data catalog lets those in the know easily share their knowledge and get rewarded for it.

For example, if an e-commerce employee contributes insights about the most common questions regarding a product, his/her feedback can be rated or “liked” by their associates. This not only helps the company, but it also helps the individual get recognized as an expert or thought leader about the subject.


4) Refute obvious theories

In many companies, if a fact shows up on three different Power Points, it’s also considered true. But maybe that fact isn’t correct in the first place and it was just repeated?

With a data catalog, analysts can dig deep into data and make connections that may refute common wisdom or perceptions.

For example, a company who sold used phones online was experiencing dropped sales on Saturdays. The analysts, even after scratching their heads could not think of a clear explanation. Then the team decided to put a customer feedback system (chatbots).  It popped up on an exit after several steps of order process and then a drop off. A large number of customer provided feedback that they were confused whether Saturday was taken as a business day where the website mentioned – ‘same day shipping on all business days’. The data catalog made it possible to connect to all the customer feedbacks and analyze them. The company got its answer and were able to fix the problem.  


Data analytics can be most effective in identifying and exploring and delivering actionable insights if collaboration and in-depth observation is added to it. A data catalog can help with this exploration about what’s truly motivating a behavior or causing something to happen.


Subscribe for MMS Newsletter

By signing up, you will receive updates about our latest information.

  • This field is for validation purposes and should be left unchanged.


Presentation: Test-Driven Machine Learning

MMS Founder
MMS RSS

Article originally posted on InfoQ. Visit InfoQ

Transcript

Nauck: I’ll talk about machine learning. First, before I start, I want to say something about what that is, or what I understand from this. So, here is one interpretation. It is about using data, obviously. So, it has relationships to analytics and data science, and it is, obviously, part of AI in some way. This is my little taxonomy, how I see things linking together. You have computer science, and that has subfields like AI, software engineering, and machine learning is typically considered to be subfield of AI, but a lot of principles of software engineering apply in this area.

This is what I want to talk about today. It’s heavily used in data science. So, the difference between AI and data science is somewhat fluid if you like, but data science tries to understand what’s in data and tries to understand questions about data. But then it tries to use this to make decisions, and then we are back at AI, artificial intelligence, where it’s mostly about automating decision making.

We have a couple of definitions. AI means using intelligence, making machines intelligent, and that means you can somehow function appropriate in an environment with foresight. Machine learning is a field that looks for algorithms that can automatically improve their performance without explicit programming, but by observing relevant data. That’s what machine learning typically means. And yes, I’ve thrown in data science as well for good measure, the scientific process of turning data into insight for making better decisions. So, that’s the area.

The Ethical Dimension of AI, ML and Data Science

If you have opened any newspaper, you must have seen the discussion around the ethical dimensions of artificial intelligence, machine learning or data science. Testing touches on that as well because there are quite a few problems in that space, and I’m just listing two here. So, you use data, obviously, to do machine learning. Where does this data come from, and are you allowed to use it? Do you violate any privacy laws, or are you building models that you use to make decisions about people? If you do that, then the general data protection regulation in the EU says you have to be able to explain to an individual if you’re making a decision based on an algorithm or a machine, if this decision is of any kind of significant impact. That means, in machine learning, a lot of models are already out of the door because you can’t do that. You can’t explain why a certain decision comes out of a machine learning model if you use particular models.

Then the other big area is bias, which is somehow an unfair, under or over-representation of subgroups in your data; obviously your racial bias, gender bias is the obvious one. You may have heard that things like facial recognition, they are racially biased, and they are also gender-biased. So, if you look at tests trying to identify the gender of a person using a facial image recognition system, you find that white males are recognized most frequently, but dark-skinned females most infrequently. So, there’s a strong gender and racial bias in these systems. Where does this come from? How does this happen?

Another area that is of concern, maybe to you guys in software development too, but people tend to use modules that they get from somewhere. You get a library, you get a piece of code, you stick it together to build what you want to build. When you’re using code, and if you have the source code, at least you can look into it, you can read it. If you have standard code, you can use your testing regime.

But what about stuff that has been generated by machine learning? So, if you get yourself a facial image recognition system from somewhere, and you stick it into your home security solution, and that then fails to recognize the owner and let them into the house, how can you be responsible for this component that you have included into your system? Do you know how it has been built, tested, validated? Is it free of bias? All of these things. So, we will see, especially in this domain, gluing together different components from different areas with different types of provenance and quality. How do you make sure that what you assemble is of good quality?

A Report from the Coalface: Naïve Bayes- from R to Spark ML

Here is an example of a team that used a machine learning algorithm to tackle a particular problem. They want to predict the propensity of a customer to call a helpline. So, they had data about customers calling helplines, and data about customers who didn’t call helplines. Then all the data they had about these customers, they tried to use to predict a customer like you to call a helpline in a particular timeframe. They used a particular machine learning model here, or a statistical model, called a Naive Bayes classifier. For the purpose of this example, it’s not important how that works, but they used to a particular library. And in data science, machine learning, you’ll find a lot of people using R or Python typically.

These guys used R, and this particular library can work with numerical data and categorical data, so numbers or strings if you like. They built this model, then they found out the target system they had to deploy their model into. Unfortunately, they couldn’t use R, they had to use Spark. And they used another library, Spark ML, to try to rebuild, and this particular library can only use categorical data strings represented as numbers. So, what they did is say, “Okay, we have strings in our data, and we have numbers, we leave the numbers alone. We just take the strings and convert them into numbers. And then we have numbers, so we can use this library.” They used the library. And luckily they had negative numbers in their data, so the algorithm refused to work with that. There were luckily some tests in there, otherwise, they would have got some weird result and deployed it.

If you look into the documentation, this is the documentation of the library in R, and it says it works with a numeric matrix or data frame of categorical and/or numeric variables. So, this is what it can ingest and work with. If you look at the Spark ML library, this is what the documentation says, a bit less readable, but the input here has to be data, which is like an array or a list of labeled points, and a labeled point apparently seems to be something that uses real numbers. The first number seems to be somewhat separate from the rest. The rest seems to be in vector. So, hopefully, here they have put the zeros and ones in there. You can’t really tell from this sort of documentation what sort of data this algorithm can work with. If there is no testing happening inside the procedure to check what is it that you stick inside to use it, then you might get all sorts of weird effects, if you don’t understand what these methods do.

Some of them helpfully do this. Here’s an example. This is, again, from an R environment. Here we are trying to build a number of classifiers, and one of them complains and says, “It looks like one of your variables is constant.” When you do data analysis, constant data is useless because it doesn’t have any information. So, it’s very helpful that the algorithms tells me that. That means there’s some testing happening inside. That looks at what is the data that’s going in and does it make sense for the algorithm to run? But you can’t rely on this. This is not necessarily happening in every piece of code that you find in any library around machine learning.

Machine Learning Can Work Really Well- But It Doesn’t Always

Machine learning usually works quite well, and you have seen in the media, there’s a lot of success in machine learning. Most of it these days is down to what’s called deep learning or deep networks, which is a technique that was already around in the 1980s and has really come to fruition now because we have lots of compute power, and we have lots of big data with labels. Where does this data come from? You have helpfully provided it by uploading photos into the cloud and sticking labels against it. So, Google now knows what cats and dogs are because you guys have either clicked on images when you looked for images of a cat or a dog, or you have uploaded photos somewhere and put the labels.

This system here has learned to label images by using that sort of data, photos and labels that are associated with it. Then they try to label new pictures, and it does quite a good job in the first columns. If you look at the top left one, it says a person riding a motorcycle on a dirt road; that’s quite good for labeling a picture. But, obviously, it’s wrong. It’s not a dirt road. It’s probably an off-road motorcycle race, which already gives you an idea that these things probably don’t understand what they’re seeing. If we go further across, then we see second column, two dogs play in the grass. So, somehow it missed the third dog. A human wouldn’t make this mistake. If we go further to the right, then look at the one in the second row, a little girl in the pink hat is blowing bubbles. So, some of the hat of the lady here has been interpreted as a bubble. And if you look in the same row, far right, that’s the best one, a refrigerator filled with lots of food and drinks.

How does that happen? How does a system make such an obvious mistake? This is because these systems don’t understand anything. They don’t understand what they’re looking at. For them, it’s just statistical patterns. Without testing and proper analysis, you have no idea what these things are actually finding. There are classical examples where these systems tried to differentiate between wolves and huskies, and what they have learned is that all the huskies are on pictures with snow. So, you have built a snow detector, but not the differentiator for wolves or huskies. But if all your data is of that sort, you have no way of finding that out. You have to become quite smart about how you test.

People say that machine learning is more alchemy than science. That is because of this hype around using things like deep networks. People are in a bit of a frenzy. What can I do with it? Where can I apply it? What cool stuff can I do with these things? The kind of things you want to have is reproducibility. So, if you train a model on some data and you get a result, like anything in science, you want it to be reproducible; that means somebody else needs to walk the same path and come to the same result. It doesn’t mean it’s correct and you can’t really prove that it’s correct, but you can show that somebody else can come to the same result. In these systems, you sometimes have a lot of parameters that you have to play with, and people have an intuitive understanding how to do this, and they get a result, and then they stop. And the question is, how good is this really? Can you show that what you’ve done is correct and useful?

Challenges in Analytics

There are quite a few challenges in machine learning, and we are looking at a few of them here. Data provenance means where does this data come from? That’s always the first question you should ask yourself. Where does the data come from? What has been done to the data? Is it really first source or has somebody messed with it? Is it somehow transformed already? Interpreted? Has somebody put their stamp on it and changed it? Also, can you trust it? How has it been generated? Is it like measurements from sensors? Maybe you have then some idea how good these sensors are. What is the error of the sensor? Has it had been created by humans? Do they have an incentive to lie about the data? These kind of questions you should ask yourself and test for it.

Data quality is then more error free. When the data has been recorded, have errors crept in somehow? Is there missing data in there that shouldn’t be missing? Data bias, we have talked about it already. It’s some group over or under-represented in that data, and that is actually quite difficult to find, and even more difficult to get rid of. Like keeping data out of modelings, like keeping hands off your picnic, it will always creep back in. It can come in via the data or via modeling, because every one of us has intuitive bias and we have some ideas what the world is like, and this goes into the models and that this bias is the models. So, the way you select the data that you seem to be relevant for the training would bias it, and when you test your model, you will have biases about it. Where it should perform, where the performance doesn’t mean so much, is not relevant. That puts bias into the models.

You can test for bias, you can try to correct for bias, but it’s not trivial. If you think about a loan application, do you want that everybody is evaluated based on their financial performance, their financial indicators, or do you want loan rejections to be equal across gender groups, racial groups, age groups? Completely different question. Different types of bias that you need to get your head around.

Model comprehension. We already talked about it. You may have to explain to somebody why does a model give you the answer that it gives you. And that’s not always possible. There are approaches for this. You can get libraries, like LIME or SHAP that do this. But you have to think about what is an explanation. To people, an explanation is something meaningful in the context they’re talking about. When we give explanations about why we did this, we always make them up. An explanation is something you make up post-talk to communicate to somebody else about why you did something. But it’s very rare that you have a reasoning process in your head based on language. That you said, “Okay, what am I going to do? I’m going to do this, and this is because I’m going to do it.” Your decision making is usually much snappier, and you don’t reason it out for yourself. Maybe if you’re going to buy a car, but in the end still the decision making is typically an emotional process.

An explanation for a human is something that has a certain kind of quality. An explanation that you might get out of a statistical model might be something that is expressed in numbers, and weights, and combinations of variables, which somebody might not understand if they are not a statistician or mathematician. So that’s another tricky dimension. Then the ethical dimension. So, are you allowed to use the data? What kind of decisions are you making? How does it affect people? You may have to test for the effects of your model application as well and I’ll come back to this.

The Process of Building Models from Data

Here’s the picture of a process around data analytics, data science, machine learning. It’s pretty much all the same. You start with some business understanding, you have to understand your data, prepare it, and then you get to the modeling. That’s the sexy bit. Everybody wants to work in this modeling box, But in reality, you waste 70% to 90% of your time in the data preparation stage. And so, this is also where your test efforts should be. Modeling is actually quite easy. The difficult bit is getting the data right for the modeling. Then, okay, the other bits, you have to obviously test what you’re doing, evaluate it and then deploy it where things can go wrong too.

There’s a perception problem. As I said, everybody wants to do modeling. So, if you thinking, “Oh, I’m working in machine learning,” and this is the idea you have in your mind of what your work environment looks like, but actually, it looks like this. You spend most of your time trawling through data, trying to get your head around data, trying to get hold of data, figuring out the quality of the data is what it means, and how you can combine different types of data that are in different operational systems. It is very messy, and all sorts of errors can creep in there.

What I do when I talk about machine learning or data science to that community, I point to you guys, and hold you up as shining beacons, because you’re a software developer, you know all about testing. I say, “We have to learn from these guys. These guys test what they do, test-driven development.” So, how can we lift and shift this over to machine learning and to data science? How do we know that our data is any good, that our model is any good? If the decisions that we’re taking based on model outputs have the impacts that we expect.

Follow Best Practice for AI, ML and Data Science- Test Everything!

Here is a data diagram that shows where you can test. This roughly shows the kind of stages you go through when you put a model in deployment. You build a model from data, and you use it in some sort of application later. So, you start with data repository. This is the first stage where you can do testing. Ideally, you prevent bad data going into your repository. The earlier you start, the better. In databases, there is something like triggers. If you work with databases, you might know this. It basically rules you. You write down, say if you put a row of data into this table, these are conditions it has to meet before you can put it in. Nobody is using this anymore. But that’s a possibility. You can just write, say, make sure that this column is always positive, or that there’s never a missing value in this column. You can do this at the level of the data repository. If you know that somebody is doing this and says, “Yes, I’m testing that no bad stuff goes into my data repository,” Then okay, that’s great, You have shifted the responsibility, and you can move on.

The next stage is data wrangling. That means the data is never in the kind of shape that you can just put it into a learning algorithm. If you learn your machine learning by going to Kaggle where all the data is nicely prepared for you, there was a whole lot of pain that happened before that you’re not seeing. So, this is the preparation phase. You take the data, you turn it into something else so you can use it in machine learning. You generate features out of it, and you can make a lot of mistakes in that space.

Often, this phase is even documented. So, you magically arrive at a set of data, and you say, “Okay, this is what I use for machine learning.” Then you build your model, and then if somebody wants to reproduce it, then, “How the hell did they arrive at these columns and this sort of data set?” You can’t replicate it. But obviously, from your point of view, you should understand you’re writing software to stage. Data wrangling means you write software. The simplest software you can write on this is SQL queries. So, you modify the data in the repository to change it into something else that is code. That should be version, should be tested.

Feature generation. That means you start combining columns. Instead of column A and column B, maybe A divided by B is a useful feature to have. Then you create something new. Again, even this A divided by B is software, which you produce something through code, through manipulating data, and that should be tested. Are you dividing by zero at some point? What does that do? Then you go into model building and then there’s a whole lot of testing around how you build a model, and I’ll come to this in a minute. All of this stuff should also be versioned, and you should keep track of it so you can replicate it. If you have to hand it over to somebody, they have to be able to pull the latest version from the repository, and they have to be able to walk in your shoes.

Now we have a model that sits in a versioning system somewhere; when we deploy it, it should be pulled. So, always have the latest version of the model. Machine learning people are not software developers, so they usually don’t understand these concepts. They don’t necessarily know what the software repository is and how you orchestrate these things. But you guys should know this. You deploy it. You can test there, is the environment you deployed into, can it handle the kind of traffic that comes, will it scale? These kind of things can go wrong.

And then you go to application. That means it’s now sitting in some sort of operational process and produces decisions. The same data that you used to build it in structure is going back into the model. Now time has moved on. You have built your data. Data is built from historic data, and it’s applied to future data, otherwise, it would be pointless. So, how do you know that the future data is the same as the data that you used to build your model from? You need to check that the data is structurally still the same, and things can catch you out.

Let’s say you have something like product codes in your model. Companies change product codes every blue moon. So, suddenly there might be something in there the model has never seen. How will it react to it? Or there’s drift in your data, some kind of numbers, and suddenly the numbers have drifted from the interval they used to be, and then they’re becoming smaller or larger, or there’s some sensor data, and then somebody decided to update the sensor. Now, this is calibrated differently, the numbers have changed. Maybe the mean of the measurements is no different than the standard deviation. Again, not something you would expect. So, you need to check these kinds of things.

Then you’re going to decision making. Again, you should test. If you use your model to make a decision, do you actually have the effect that you want to have? You can test this by keeping a control group, and you know this from testing medicines. In medicine, when they test new drugs, they have a very strict regime of how to do this, double-blind tests. The doctor doesn’t know what sort of pill they give, and the patient doesn’t know what they are receiving. So, this sort of regime, you can replicate in the decision-making process. You’re making a decision, you apply your procedure to your treatment group, and you do the same thing to a control group, or not the same thing, you just do what you always did, or you do nothing. And then you compare in the end, is this the same?

Some companies are very good in this. Netflix does this on you all the time. They experiment on you. So, if you open your Netflix main screen, you’ll see some movies just based on what you like, but also the movie images or the title images are different. Your friend might see a different set of images. They just try out what’s more interesting. And so, these are the groups, and they test these treatments across the groups. Which decision-making gives me a better response? And you can do this as well.

Testing Your Model: Cross-Validation

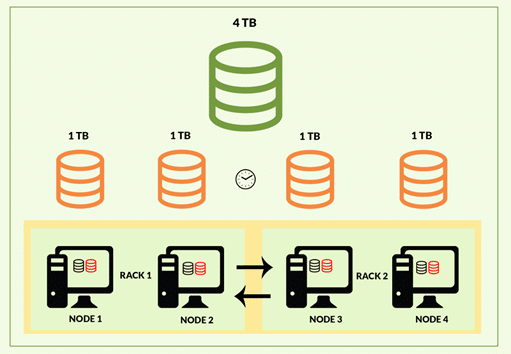
I’ll talk about two things, I’ll talk about testing a model and testing your data. Model is, if you work in machine learning, then this is something that you know, that you’ve been trained to know this sort of stuff. Cross-validation. So in a nutshell, when you build a model, you have a set of data which is called your training data. You partition it into K equal parts, let’s say 10, and then you use one part to test or validate your model and the other nine parts you use to build it. You do this 10 times. Ideally, you repeat this again. Why are we doing this?

We want to understand how strongly the selection of the training data impacts the model built. So, what you do is, your training data is a kind of a sample of all the data that is potentially available and you somehow have created this set of training data, and you use it to build a model and then this model will be applied to all the other data that’s out there that you haven’t seen. You need to make sure that your training data is representative of that data that the model is going to see in the future.

So selecting that training data, if you don’t do it well, will have an impact of how well the model performs. The only way to check this is by creating many models and see how different they are and how they perform. And this is what this cross-validation procedure is for. So, you do this partitioning into 10 subsets to check if the selection of a set of data has an impact, and then you do this many times to check if this partitioning also has an effect. Because everything should be random. So, in practice, people use K equals 10 or 5, and N equals one. But ideally, aim for K equals 10 and N greater than 1 to have some good idea about how well your model performs.

What are you looking for when you do this? You’re looking for the training performance to be better, but only slightly, than the test performance. You look at the numbers that indicate the performance, and that’s what you want to see. And you want to look for consistent figures across all faults. So, if something sticks out where it’s 90% correct and all the other times it’s only 70% correct, that’s suspicious. If the training performance is much better than the test, then it’s overfitting. If you consistently get 90% performance and training, but only 60% in test, there’s some overfitting happening. That means you have to control your model parameters. If the test performance is much better than the training performance, then all the alarm bells should go off. That probably means that you have some data leakage; some information you shouldn’t have has gone into your test data. And if the figures vary a lot, then you probably don’t have enough data for the task that you’re trying to solve.

You also want to look at the model that you’re building. Sometimes that’s possible, sometimes it’s not. But if you can look at the model structure- so what does the model actually look like when it has been created- does that look consistent across all the folds? The typical example would be a decision tree, which you can look at,. You can plop this out or write it down as rules. Or what you can do is, in every fold, are the same features selected again and again? Or do you see that one fold takes these variables and another fold takes these variables? If you have automatic feature selection in your algorithm. So, these are the kinds of things you can look for. If this differs a lot, then probably you don’t have enough data, or the data selection strongly influences the model built, which would be the case if you don’t have enough data. So, you have to go back to basics and check is the data right? Is the model right? Is the model too complex for the task that I’m trying to solve? Things like this, you have to look into.

What’s the most misused term in machine learning and data science?

Participant 1: Big data.

Nauck: Yes. Good one. Any other takers? That was big data. No? This one, accuracy. Accuracy is a bad word because it hides so much. It hides so many sins in machine learning and data science. if your target class is only 1% in your data and your model is 99% correct, 99% accurate by just saying nobody is from the target class, yes, you have 99% accurate model but it’s 100% pointless. So, accuracy, avoid using it. It doesn’t give you enough information.

If you’re in machine learning, print it out and nail it over your bed. These are the terms you need to work with. You need to understand this is for binary classifiers only. What type of errors are you making? What are the false positives? The false negatives? You need to understand what’s the impact in your decision domain of these arrows, and you want to understand things like sensitivity and specificity, and you want to understand what’s the base rate in your data. These kind of things you need to work with. There’s a very good Wikipedia page. If you Google, “confusion matrix wiki”, you’ll find exactly that. So, that’s very handy to keep available when you do machine learning.

Test Your Data!

To test your data. That’s, I said, you spent 70% to 90% of the time massaging your data to get it into a shape to put it into a model. So, your test effort should be spent in that domain as well. It’s also the most difficult part to test. You could actually say that everything that you do during machine learning is either using data or generating data. So, everything is about testing data. But what I said about the cross-validation, generates data; the data is statistical performance of your models. So, you can test this. If you want to make sure that your training performance is always better than the test performance, it’s a rule that you can test for, but the difference shouldn’t be too big. You can test for that.

So you can write a lot of tests on the output of a cross-validation to check that your model is actually any good before you continue on your pipeline. And this is testing the data that comes out of the cross-validation. But the data that you work with, you should test as well. So, what you do before you do any kind of modeling in machine learning, you go through something that we call exploratory data analysis, and it’s the part where you try to get your head around the data that you’re working with, and you do a lot of visualization at this stage, you plot stuff, you compute statistical features, means, variances, tests, all sorts of stuff. Just to try and understand what is this data telling me? Where does it come from? Is it any good? What’s the quality, bias? All of these kinds of things. So, you learn something about your data, and you can write this down as tests.

We have a few examples. I use R a lot, so these examples are from R. There’s a library called assertr. What you can do is you can write assertions in your code, and, I don’t know if you guys use assertions in your own code, typically something that is used at compile time or maybe even at runtime. This one here is used at runtime, and you use it to write tests about the data. The data I’m playing with here is data about flights and flight delays, flights out of New York. There’s an example data set which is available in R, and I’m looking for a column here that is called delayed. What I have here is a pipeline where I pipe a data table called my data through a number of operators. Actually, what I want to compute is I want to see how many delays I have in this data. What’s the ratio of the delays in my data?

I have this verify, I have these two verify commands in here. The first one says, “Verify delayed is equal to one or delayed is equal to zero,” which is a useful thing to have if you want to build a binary classifier, and you indicate that the positive class is indicated by a one and a negative class is indicated by a zero. Ideally, you don’t want any other numbers to turn up there, or you don’t want any missing values.

The other thing I’m verifying here is that I have at least 50% of delayed rows in my data. So, compute, because one and zero is my indication for delayed. I can just sum it up, divided by the number of rows in my data set, and then I get the ratio. If that all goes through, then this pipeline will produce the output I want. I want the number of delayed flights in my data and I want the ratio, so it tells me 86%. It’s probably skewed, I’m not too happy with it, but just for the sake of it, we’ll continue with it.

If it fails, you see something like this, there’s an arrow, and the execution has stopped. This is what you want. Your code should throw an exception if the data that you tried to feed into it, is not what it expects. Especially, you want to do this when you apply your model later in an operational system. It’s always bad to make a decision that is on wrong data. So, ideally, you want a model that says, “Oh, I’ve never seen that. I don’t know what to do,” and tells you that instead of, “Yes, don’t know, but will give you a one as an output because this is the closest thing I can find.” So, this is your way of enforcing to say, “I don’t know what to do with this.” And that’s a very useful situation to be in when you use models. It tells you it’s not what you expect, but you don’t know exactly where it goes wrong. But this kind of verification is very useful, just as generic checks on the data.

You can try to find the culprit, which is useful in the first stages when you try to get your head around the data. Here I’m using an assertion that says a particular column, or actually the keyword “everything” here means all the columns, they should be positive. They should be between zero and infinity, and this is what this predicate checks. If that goes through, I get my result, and you can see it doesn’t go through, and I get a number of columns where this is not true, and this is the variable for dew point where you have negative value. So, the data set has information about weather, and flights, and so on. And dew point actually can be negative. So it’s cool. I learned something about the data, now I can change my assertions. I can say the dew point columns is okay if it’s negative.

Sometimes we need to test something that you have to compute first, there are also operators for this. This one here insists, says that the wind speed and the wind gust should be within three standard deviations. But in order to do this, you first have to take your data, you have to calculate the mean and the standard deviation of the column, and then you can test if the individual role within is three standard deviations or not. And it would show you all the ones that are not, and there’s a potential outlier. Again, this is useful in the first phase when you get your head around the data.

There are a lot of packages. You can find several of those. The one that I used here is assertr. If you’re working with R, you probably know the name Hadley Wickham. This is more runtime assertions for code. But there are many you can play with. If you’re more a Python person, then there is a package called TDDA, test-driven data analytics, which I would recommend to have a look at this. It’s very cool stuff that can even derive constraints on data or assertions on data automatically. It can look at the data and say, “Oh, I think this column is just positive numbers or so.” That’s the tricky bit. There’s no support to help you write these test cases. You have to do this yourself, and that’s one of the problems in this domain. There is not a lot of tooling that helps people to do this, and that’s why it typically doesn’t get done so much.

Research Trends in Data Science: Supporting Tools

There are some tools out there that try to fill this particular gap. On data quality, you get things like Quilt and TopNotch that try to do things like data quality checking or data versioning, also interesting. So, if you used your data for machine learning and you replicate the whole experiment next month when you have new data, what is the difference between the datasets? That’s quite a cool idea to version your data. Obviously, quite a challenge to do if you talk about massive amounts of data. FeatureHub is the idea that you can work across teams. So, when you develop machine learning models in teams, and you have thousands of columns to go through and to turn them into features, you do this in a team. How do you record and keep these features available and share them across teams? FeatureHub is trying to look at this. And then when you build models, you have to keep track of what you’re doing as well, and things like ModelDB and MLflow try to look at this.

There’s also a whole other area around governance around models. When you have them in production, and you need to check how they perform, or you may have to explain to somebody why they make certain decisions, you need a governance layer around this. For this, you want a certain type of APIs. You want to ask a model, who built you? What sort of data did they use? How many decisions have you made? What have you been built for? Especially in these image recognition domains, what do people do? They reuse deep networks. They chop off the top and the bottom layer and take a network that has learned to detect cats and dogs and then use it elsewhere, but retrain it on their domain by using what it has been trained for before.

But maybe somebody said, “Oh, you can’t do this. If you use this model, you can only use it to recognize cats and dogs. Don’t use it to diagnose x-ray images for cancer,” or something like that. And so, these indications when you have a model are important to keep track of, and these approaches look into this direction. We have a whole working group at BT that looks at model governance and tries to develop standards across industry for that.

Future of AI: Explainable AI (Xai)

The future- what I think is where things have to go to is explainability. So, explainable AI is one of the interesting keywords in the scene. This is the idea that you can ask a model, “Why are you telling me this?” Or, “What sort of data have you seen in the past that makes you give me this decision?” This is really tricky to do. It’s not easy, but this is something where we have to get to, and so we need to be able to get to this sort of conversation with a model and ask it stuff so that we can develop trust in it.

So, we need to be able to trust that it has been built in a proper way, that all the tests have been done. When you buy something of a vendor, when they say, “Here’s my facial image recognition system,” how do you know they have built it in the proper way? If you have certain kind of quality gates for your own software, for your own machine learning, how do you know that the people you buy stuff from have the same? How can you check this? These kind of things could be introduced through explainability, and model-based design could be a way here to help ensure these kinds of things, think of explainability by design, similar to security by design, or privacy by design.

This is what I wanted to say. I hope you guys found it interesting and I’m happy to take questions. I don’t know how it works, but there should be microphones coming around I think.

Questions & Answers

Participant 2: A very interesting talk. One of the things that is used to correct fundamental misconceptions in the academic world, as I understand it, not being within it, is other people challenging the original results and using that attempt to reproduce as a way to discover problems. Is there any way to reproduce that kind of argumentative tension inside an organization, or is that not the right way to do it?

Nauck: Yes. What we try to do is to replicate this to some kind of peer review. So, if one of my guys builds a machine learning model, then somebody else has to check it. That means this reproducibility idea. So, where is the data that you used? What are the steps you went through, and what is the result that you have? Then trying to get to the same result. In academia, you find more and more that people are asked to publish not only the code but also the data that they used so that somebody can take it and replicate the results. You can do this inside your own team or organization.

Participant 3: Thank you for your very interesting and thought-provoking presentation. I have a question about a few of the slides that you had in there. For instance, you had the image recognition problem, and you used an example about huskies and wolves.

Nauck: This one?

Participant 3: Yes, this one. The huskies and wolves are easy to identify as a human because it’s already built in us to see through our eyes that a thing is in certain order. And if they were ordered in a vector of 2 million pixel values, they would be very difficult for a human too. So, humans build their vision in layers upon layers of information, and they check their stuff. The problems here lie in the fact that they interpolate or extrapolate the area of expertise that the model is using, and it fails. Is there a way to identify when the model is exceeding its boundaries in interpolation or extrapolation?

Nauck: Yes, very good question and very difficult to answer, especially in that space when you do image recognition, once you have potentially got an infinite number of images that can possibly be entered into a system. And because these systems, they don’t see or understand the image, they don’t look for concepts in an image like we would. If you’ve been in the previous talk of the track, then Martin showed the attention, the hotspots where humans look at an image, and where the algorithms look at. It has nothing to do with each other. It’s important to realize this is only a statistical pattern recognition as you say. So, if you want to build a system where you can be sure what it is they’re doing, you need to think about combining different concepts.

And so, for example, let’s say you have a camera in a car that is supposed to look at the road and identify only if the road is free or not, which is a similar challenge too here. Then how do you guarantee that the image is actually a road. These image processing systems can be fooled. You could have an image that looks the same to you and me, but one pixel has changed, and it classifies it completely differently. You can find examples like this. So, this is really, really challenging.

What you would typically do if you test inputs to the system, you would say, “Okay, this comes from a particular domain,” so I can check that the input comes from that domain. Is it within certain intervals or whatever? You don’t really have this because you don’t have concepts here; you just have pixels. You can think of maybe different ways of looking at images. There could be the old-fashioned type that does image segmentation, and you use this as well, and then you check, “Okay, the system here says that’s a road, but have I seen a white line in the middle, and have I seen two black stripes to other side of it?” Or things like that. You can try these things. But this is, I would say in its infancy.

Participant 3: So, you suggest that there is a certain kind of unit testing for same machine vision or machine learning? This actually takes to the diagram a few lines after this. Yes. This one. Here the three is the feature generation, and four is the model building. Say, the model building creates machine learning model, and this machine learning model is used as a feature in the next model. So, the models build on each other. And now I have a system that is not tested like you say, with the code examples you have, the system performs, statistically. Sometimes it’s correct, and sometimes it’s not, based on the input you have. That would require something like testing using distributions or something. Is there some kind of literature that has done this research, or something that has used models upon models upon models to create this kind of a stack of machine learning systems?

Nauck: Again, great question. I haven’t seen any.

Participant 3: None?

Nauck: No. So, the typical testing that you see in machine learning is all around cross-validation. Come up with a model that has this, where you can guarantee a certain performance. That’s the idea. But this idea of looking at what type of errors does this model make, and what does it mean in the application context, and how can I detect these arrows when I to use it somewhere – I have not seen any work on this.

See more presentations with transcripts

Subscribe for MMS Newsletter

By signing up, you will receive updates about our latest information.

  • This field is for validation purposes and should be left unchanged.


Security Landscape of the Docker Ecosystem and Best Practices

MMS Founder
MMS RSS

Article originally posted on InfoQ. Visit InfoQ

As part of its annual State of Open Source Security Report, security firm Snyk issued a specific report focusing on Docker security that shows vulnerabilities in container images are widespread. According to Snyk’s report, the top ten official Docker images in DockerHub, including node, httpd, postgres, nginx, and others, have at least 30 vulnerabilities each, with the node image being the top offender with more than 500 vulnerabilities. The problem concerns even Docker certified images, which must conform to best practices and pass certain baseline tests, according to Docker.

The sheer numbers provided by Snyk are surely worrying, but they might not represent the hardest part of the problem. In many cases, fixing vulnerabilities in a Docker image is as easy as rebuilding the image using non-vulnerable versions of its dependencies. According to Snyk, as many as 44% of Docker images contained vulnerabilities that had been already removed in newer versions of their base image. More worrisome seems to be a general lack of security ownership among developers, who do not always seem to be aware of the criticality of their role. According to Snyk’s survey, 80% of developers say they do not test their images during development, while 50% of them do not scan their images for vulnerabilities at all.

The best approach to deal with Docker image vulnerabilities rests on three key practices, Snyk says. First, as a hygiene rule, it is convenient starting with the smallest Docker image that is available for a given purpose and do not add any unnecessary package. Second, images should be scanned frequently both during development and in production. Finally, images should be rebuilt as part of a CI/CD pipeline and multi-stage builds should be preferred, since they help optimize your images.

Snyk State of Open Source Security Report has a broader scope that just the Docker ecosystem and is based on a survey among more than 500 open source developers and maintainers, data from public application registries, library datasets, GitHub repositories.

InfoQ has spoken with Snyk developer advocate Liran Tal to learn more.

InfoQ: Snyk report shows a steep increase in the number of vulnerabilities found in open source libraries in the last few years. Can you tell us how you found that results?

Liran Tal: Snyk tracked information about the state of security disclosures that were made public on some of the most popular Linux distributions, based on data Snyk gathered from cvedetails. Snyk found that security vulnerabilities in RedHat Enterprise Linux, Ubuntu and Debian grew four fold in 2018. That’s right, there’s no decimal place missing, it grew by almost three and a half times.

As Snyk take a look at a breakdown of vulnerabilities by their severity, we found out that 2017 and 2018 continue the trend in an increase of the number of high and critical vulnerabilities being disclosed.

InfoQ: When it comes to Docker, the security of the underlying OS and system libraries is critical. Can you comment on what your report brings to the fore?

Tal: Docker images almost always bring known vulnerabilities alongside their great value. System libraries are of course common artifacts in operating systems, which docker images are built upon. With more system libraries and tools bundled in a Docker image, the risk of finding a security vulnerability in the image increases.

Most vulnerabilities come from libraries you don’t explicitly use. In most ecosystems, 75% or more of your dependencies are indirect, implicitly pulled in by the libraries you use and Snyk found that 78% of overall vulnerabilities tracked are from indirect dependencies.

As containers continue to explode onto the IT landscape in 2019, container security threats continue to rise, and organizations are now more than ever placing a higher level of importance on ensuring image security is a top priority.

At 50 pages in length, the Snyk report on open source security contains much more detail than can be covered here. Make sure you read it if you are interested in software security and how to improve it.

Subscribe for MMS Newsletter

By signing up, you will receive updates about our latest information.

  • This field is for validation purposes and should be left unchanged.