Month: July 2019
Podcast: Kingsley Davies and Cat Swetel at QCon London about Ethics and Requisite Variety

MMS • RSS
Article originally posted on InfoQ. Visit InfoQ

In this episode recorded at QCon London 2019 Shane Hastie, Lead Editor for Culture & Methods, first spoke to Kingsley Davies about ethics and then with Cat Swetel about requisite variety and being mindful of the impact our decisions have for the future
Key Takeaways
- The need to explore the application of technology for good
- The need for ethical standards in the technology industry
- Data is the new oil and it is frequently used in ways that are not in the best interest of society
- Other engineering professions have codes of conduct and ethical frameworks that are mandated as part of the education process, software engineering currently has very little
- Ashby’s law of requisite variety – the more options that are available to a system, the more resilient the system is applies to all aspects of our socio-technical systems
- We exist in the realm of ethics – we can’t just go to work and do what you’re told. Everything we do is a choice and our choices have a huge impact on the future
Subscribe on:
- 0:43 Introduction to Kingsley
- 0:53 Kingsley’s talk Effective Ethics for Busy People
- 1:15 The need to explore the tech for good and ethical technology space
- 1:49 Tech for Good – technology used for social impact in the charity sector
- 2:20 the impetus behind opening a coffee shop as a community space
- 2:45 Now is prime time for tech for good
- 2:54 Data is the new oil and it is frequently used in ways that are not in the best interest of society
- 3:27 The need to carefully evaluate the capabilities and uses of data analytics
- 4:03 Exploring the options open to an individual when they are unsure of the ethics of a course of action
- 4:29 The need for psychological safety as a prerequisite for ethical decision making
- 4:40 If you don’t feel safe in the environment you’re in then you should probably change your organisation
- 4:57 Ways to incorporate ethics into the decision-making stream – possibly as a discrete element in the continuous delivery pipeline
- 5:42 Other engineering professions have codes of conduct and ethical frameworks that are mandated as part of the education process, software engineering currently has very little
- 6:08 Examples of some activities happening in the space – such as the Stockholm Letter
- 6:29 There are a number of examples of codes of conduct and codes of ethics that are available, such as the ACM
- 6:51 The sad inevitability that it may well need some more incidents before the IT community and society as a whole demand ethical guidelines for software engineering
- 7:20 Ways to start getting involved
- 7:40 Referencing the ethical OS toolkit as a framework for evaluating the likely future use of technology being developed
- 8:15 The grassroots groundswell of developers who are getting engaged and interested in the area of ethics
- 8:50 Events and activities that are happening in the ethics and tech for good space
- 10:13 The way business strategies from Open Source and Crowd Funding are being adapted for social good and the charity sector
- 10:48 An example of tech for good – the application of AI to reduce the load on health services
- 11:29 Green tech and energy use as a social driver
- 12:00 the impact of bitcoin and blockchain – the amount of electricity used by bitcoin miners is the equivalent to the electricity consumption of the 38th largest country in the world
- 12:31 The need for green technology and the efficient use of power and the impact of technology on carbon emissions
- 13:11 Exploring the background of bitcoin and why it emerged through the global financial crisis in 2008
- 14:52 Work underway to reduce the power consumption of bitcoin validation, but it’s still experimental
- 16:08 Introducing Cat Swetel
- 17:12 Cat’s talk on Requisite Variety
- 17:32 Ashby’s law of requisite variety – the more options that are available to a system, the more resilient the system is
- 18:18 Aspects of variety in socio-technical systems
- 18:35 Examples of where variety makes sense and where it doesn’t
- 19:13 Sometimes the same relationship needs both high and low variety in different aspects
- 19:41 Recommendations as an example of variety
- 20:25 Socio-technical systems are implemented by people, for people
- 20:44 To build resilient organisations we need teams with a wide variety in background, experiences, culture, knowledge, beliefs and viewpoints
- 21:35 Become sensitized to opportunities to uncover more options
- 21:55 The difference between taking an account of a situation and accounting for a situation
- 22:28 Examples of the assumptions that limit our options and opportunities
- 22:44 An example of changing the thinking to take account of a situation
- 23:28 There is no simple answer to overcoming the inherent biases we have
- 23:33 Some examples of things Cat has found which help overcome the assumptions we hold
- 23:52 Imagine you are someone else and think about how they will view the situation
- 24:05 Use diverge-converge thinking to help belief differences
- 24:32 Using A3 thinking in a collaborative, deliberately provocative approach
- 25:10 The information technology industry is very young, and we are currently setting the tone for future generations
- 25:47 Each of us working in the industry today have a huge responsibility to future generations to consider the outcomes of our actions and the way we implement systems
- 26:38 Being mindful and thinking about what we’re building and the impact of what we do on the future – applying test-first thinking
- 27:22 Questioning strategy and direction – what would the impact have been if someone at Facebook had questioned the strategy of seeking engagement regardless of the type of engagement
- 28:05 We exist in the realm of ethics – we can’t just go to work and do what you’re told. Everything we do is a choice
- 29:12 Where we need to look for moral guidance and transcendence and meaning
- 29:47 Listen to each other and value the testimony that we each bring to the table
- 30:17 We constantly make choices in the work that we do – we need to be more deliberate and mindful about the choices we make
- 30:42 Feeling empowered to say no and challenge unethical behaviour
- 30:54 Those of us in the position to say no have a responsibility to do so when it is needed
Mentioned:
About QCon
QCon is a practitioner-driven conference designed for technical team leads, architects, and project managers who influence software innovation in their teams. QCon takes place 8 times per year in London, New York, San Francisco, Sao Paolo, Beijing, Guangzhou & Shanghai. QCon San Francisco is at its 13th Edition and will take place Nov 11-15, 2019. 140+ expert practitioner speakers, 1600+ attendees and 18 tracks will cover topics driving the evolution of software development today. Visit qconnewyork.com to get more details.
More about our podcasts
You can keep up-to-date with the podcasts via our RSS Feed, and they are available via SoundCloud, Apple Podcasts, Spotify, Overcast and the Google Podcast. From this page you also have access to our recorded show notes. They all have clickable links that will take you directly to that part of the audio.
Previous podcasts
MMS • RSS
Article originally posted on InfoQ. Visit InfoQ
Kirsten Westeinde, senior engineer at Shopify, discussed the evolution of Shopify into a modular monolith at Shopify Unite 2019. This included using the design payoff line to decide when to make this change, how it was achieved, and also why microservices were ruled out as a target architecture.
A key takeaway is that monoliths are not necessarily a bad architecture, coming with many advantages such as a single test and deployment pipeline. This is particularly useful at the start of a project when new features must be shipped quickly. It’s only when the “design payoff line” is crossed, the point where bad design impedes feature development, that the architecture should start to be improved. In the case of Shopify, improving on their architecture did not mean a move to microservices, but a move to the modular monolith. This combined the advantages of a monolith, such a single test and deployment pipeline, with the advantages of microservices, such as code modularity and decoupling.
Westeinde believes that a monolithic architecture is a good starting point for a project, stating: “I would actually recommend, that new products and new companies start with a monolith”. She lists some of their advantages:
- A single project containing all the code.
- Due to this single codebase, testing and deployments are straightforward.
- All data is available and does not need to be transmitted across services.
- A single set of infrastructure.
Because of these benefits, Shopify started off as a small Ruby on Rails monolith, over time evolving into an extremely large codebase. As this happened, it meant that Shopify started to become unmaintainable, thus making it hard to deliver new features. For example, changing one piece of code would cause unintended side effects on seemingly unrelated code, and building and testing the application took too long.
Referencing the design stamina hypothesis by Martin Fowler, Westeinde explained that this is when it became time to refactor their architecture – once feature development is impeded by bad design, a design payoff line is crossed which means that it makes sense to invest resources to fix this.
Initially, Shopify looked at microservices as an alternative more maintainable architecture. However, they were ruled out due to the complexity of a distributed system, instead wanting a more maintainable monolith:
We realised all the things we liked about our monolith, were a result of the code living in and being deployed to one place. And all the issues we were experiencing were a direct result of a lack of boundaries between distinct functionality in our code
Westeinde explains that they realised their design goal was to increase the modularity of the system, such as with microservices, whilst keep a single deployable unit, like a monolith. In order to achieve this Shopify adopted the modular monolith pattern. This allows boundaries between code, but for that code to live in and be deployed to the same place. The migration path included:
- Code re-organization: Initially the code was organised like a typical Rails application, with the top-level parts being named after technical components such as controllers. This was changed to be organised based on business functionality, such as “billing” and “orders”, making it easy to locate code.
- Isolating dependencies: Each business component was isolated from the other, then made available to use through a public API. A tool named Wedge was developed in house which tracks the goal of each component towards isolation. It does this by building up a call graph and then working out which calls, such as ones across components, are violating.
- Enforcing boundaries: Once each component has achieved one hundred percent isolation, boundaries will be enforced between them. The idea is that there will be a runtime error when code tries to access code in a component which it hasn’t explicitly depended on. Having dependencies declared in this way will also allow them to be visualized in a dependency graph.
To conclude, Westeinde explains that this was a good example of how architecture can evolve based on business needs:
Good software architecture is a constantly evolving task, and the correct solution for your app absolutely depends on the scale that you’re operating at
The full talk can be watched online, also coming with a corresponding blog post.
Docker Enterprise 3.0 Brings Docker Kubernetes Services, New Lifecycle Automation Tools, and More
MMS • RSS
Article originally posted on InfoQ. Visit InfoQ
After over 2000 people participated in the Docker Enterprise 3.0 public beta program, Docker has announced Docker Enterprise 3.0 GA. This version brings Docker Kubernetes Services (DKS), new lifecycle automation tools for automating deployment of containers and Kubernetes, security enhancements, and more.
Docker Enterprise 3.0 introduces Docker Kubernetes Services (DKS). Docker Kubernetes Services is designed to solve the Kubernetes complexity that stems from a lack of intuitive security and manageability configurations that enterprises expect and require.
Docker Kubernetes Services integrates Kubernetes from the developer desktop to production servers, making Kubernetes easier, more secure, and more accessible to the entire organization. DKS does it through theVersion Packs, that keeps developers’ environment in sync with production environments. Furthermore, DKS includes the latest release of Kubernetes, including full support for Container Storage Interface (CSI).
Aiming to make easier for teams to deploy, scale, backup, restore, and upgrade a certified Kubernetes environment, Docker has created a CLI plugin based on Docker Certified Infrastructure for simplified Docker cluster operations. This tool uses a declarative model that handles cluster configurations using a YAML file with the following structure:
variable:
        <name>:
provider:
        <name>:
                <parameter>:
cluster:
        <component>:
                <parameter>:
resource:
       <type>:
                <name>:
                        <parameter>:
The file above defines configuration settings, such as instance types, Docker Enterprise versions, OS used, networking setup, etc. Once defined, this file can be used with the new docker cluster CLI commands:

(Image taken from blog.docker.com)
With the docker cluster and the declarative model, it is simple to update an environment; by using the docker cluster update command, the CLI plugin will identify the changes and implement a safe upgrade. In addition, it is possible to upgrade a cluster without any downtime using a blue-green deployment model for worker nodes.
To restore a backup, there is the docker cluster backup command that stores the cluster environment as a single tarball file that can be stored in any location.
Docker has also developed an interesting conversion tool. The conversion tool is designed to automate the generation of Dockerfiles for applications running on virtual machines or bare metal servers. The conversion tool scans the server where the application is running in order to determine the configuration of the OS, web server settings, and how the application is running. The data is then assembled into a Dockerfile and the application code is pulled into a directory, ready for a Docker Build on a modern operating system. For example, a Windows Server 2003 environment can be scanned to generate Dockerfiles for IIS-based .NET applications running in disparate IIS Application Pools.
Docker Applications is a new set of tooling that allows users to build, share and run multi-service applications across multiple configuration formats. It allows users to bundle together application descriptions, components, and parameters into a single unit that can be a file or directory, building a kind of “container of containers”. Docker Applications are an implementation of the Cloud Native Application Bundles (CNAB), originally co-developed by Docker, Microsoft, Hashicorp, Bitnami, and Codefresh. It can identify and build the containers needed from Docker Hub, and creates the Docker Compose and Kubernetes YAML files, Helm charts, and other required configuration settings.

(Image taken from blog.docker.com)
Users can also create Docker Applications, leveraging predefined Application Templates. Docker Application Templates enable developers to build applications using a library of predefined and organization-approved application and service templates, without requiring prior knowledge of Docker commands. The Application Templates include many of the components required for developing an application, such as the Dockerfile, custom base images, common compose service YAML, etc.
Docker Enterprise 3.0 also includes additional security enhancements, such as Group Managed Service Accounts (gMSA) for Swarm, and PKI Certificate-Based Authentication.
Docker Desktop Enterprise brings exclusive features compared with Docker Desktop Community. Let’s see a comparison between them:


(image taken from blog.docker.com)
Users who want to test Docker Enterprise 3.0 trial should register at https://trial.docker.com.
MMS • RSS
Article originally posted on Data Science Central. Visit Data Science Central

I never thought that ML could be useful for small-scale businesses. Surprisingly, almost everyone I met and discussed the concept of ML with also held the same view. I continued to hold this opinion until I registered for a short training course on ML. Subsequently, I was assigned a project to develop a ML model that could effectively improve the cost of marketing campaigns for a charitable organisation, which changed my perspective completely.
This article aims to discuss the importance of ML for small-scale businesses and gives an example of the way an ML algorithm can be employed to estimate costs.
Six Common Important Functions of Machine Learning (ML) for Small-Scale Businesses
- Trend and Pattern Recognition – Several owners of small-scale businesses maintain a sales book and an account one, wherein they record their customers’ names, sales volume, cash transactions, and so on, from a different store. This record generates data that can be analysed to identify buying patterns of customers, along with other factors that drive sales or influence customers’ preferences.
- Modelling and Forecasting – The information in one’s sales book can be capitalised to estimate costs, predict sales volume and gauge revenues, profits as well as expected market share. The advantage is that the sustainability and success of a business depend upon the accuracy of such forecasts.
- Security – ML can help in analysing data and identifying patterns in such data. Further, this process can be used to identify suspicious transaction behaviour, track errors and detect fraud. As a result, business owners can easily take immediate actions to cover a loophole and prevent its occurrence in future.
- Information Extraction – ML can be used to extract valuable information from other database and encourage operation coordination. The fact is that no business owner can be an island of knowledge. In order to take proper business decisions, business owners require external information, to conduct appropriate data analysis of the same (for instance, information on weather, inflation, interest rate, etc.).
- Good Business Environment – ML creates a suitable environment for small businesses to grow and become efficient; it also provides staffs with new technology to function better. For example, ML recommendation engines can imitate customer behaviour, recommend additional products and promote upselling. Media companies use ML to identify patterns of lip movements, which they convert into text.
- Advertisement and Marketing – It is noteworthy that 75% of enterprises utilise ML to enhance customer satisfaction by more than 10%, while three in four organisations employ AI and ML to increase the sale of new products and services by more than 10%. Within seconds, ML apps can reach millions of customers to inform them about new products and why the existing product is better than the product produced by other competitors according to Columbus (2018).
An Example of How Machine Learning Can be Used to Estimate Costs
A charitable organisation relies on the generosity of its well-wisher to cover the operational cost and provide the necessary capital to pursue charitable endeavours. Owing to the higher numbers of donors from different parts of various countries, the cost of soliciting for funds through postcard has increased over the years, for 10% record that the average donation received through postcard for an individual is £15, while the cost to produce and send the card is £2. The expectation is that this cost could increase if a charitable organisation chooses to send a postcard to everybody that identifies with the organisation. As a result, the organisation would need to hire a data scientist to develop a cost-effective model that can identify donors with the highest potential and likelihood of making donations.
Here is the link to the code of this project. I skipped a lot of code for brevity. Please follow the Github code provided on the side while reading this article: Machine Learning: Donor Prediction.
Machine Learning Algorithms
We compare the forecasting performance of six different supervised machine learning techniques together using python with aim of chosen the appropriate algorithm to estimate cost. In particular, we considered the following classification techniques: Logistic Regression (LR), Kneigbors Classifier (KNN), GaussianNB, Random Forest Classifier(RF), Linear Discriminant Analysis and Neural Network Classifier (NN).
The results represent below with box and whisker plots
From the above graph, we observed that the decision tree classifier (CART) outperformed other prediction models because the model has the highest mean when compared with other selected models. Therefore, we apply CART model for prediction. The results are available below:
True positives 280
False positives 796
True negatives 2106
False negatives 693
Classification Report
precision recall f1-score support
0 0.75 0.73 0.74 2902
1 0.26 0.29 0.27 973
avg / total 0.63 0.62 0.62 3875
For the classification report comprising 3875 households, we test for the actual number of households that are likely to donate funds for the charitable organisation. In our report, there are two possible predicted classes: “0” and “1”. For the two predicted outcomes, “1” indicates the actual number of households that are likely to donate, whereas “0” represents the actual number of households that are unlikely to do so.
Confusion Matrix
|
N = 3875 |
Predicted “0” |
Predicted “1” |
|
|
ACTUAL “0” |
TN = 2106 |
FP = 796 |
2902 |
|
ACTUAL “1” |
FN = 693 |
TP =280 |
973 |
|
|
2799 |
1076 |
|
From the 3875 households in total, the decision tree classifier predicted 1076 households likely to donate and 2799 households unlikely to do so. In reality, 973 households from the sample will donate, while 2902 households may not.
To calculate the cost, recall the following:
Unit cost = £2
Unit average revenue = £15
For the organisation to minimise its cost, it could avoid sending postcards to everyone who expressed an interest and send them to only those households that are most likely to donate.
In this case, the total cost will be (TP+FN) *unit cost = £1946
Revenue = TP*unit revenue = £4200
Profit = (TP*unit revenue) – ([TP + FN] *unit cost) = £2254
This result implies that if the charity sends postcards to only those households that are likely to donate, it will spend £ 1946 and earn £4200, to generate a profit of £2254.
Conclusion
In this article, we discussed how small-scale business can apply ML to improve their performance and generate greater revenue. We also provided an example of how ML can be used to estimate costs and identify likely donors for a charity. We believe that it is crucial for business owners to learn about the importance of data collection and use ML algorithms to improve their businesses’ performance.
Mozilla's Firefox Reality VR Browser Now Available on Oculus Quest, With Tracking Data Protection
MMS • RSS
Article originally posted on InfoQ. Visit InfoQ
Mozilla recently brought Firefox Reality, its popular open-source Virtual Reality (VR) browser, to the Oculus Quest handset. Oculus Quest users will now enjoy the privacy features included in the browser, such as Enhanced Tracking Protection.
Mozilla revealed Firefox Reality in April, with the goal to provide manufacturers with an easy way to integrate a full-fledged, open-source, customizable browser into their headsets. Firefox Reality leverages emerging mixed reality web standards, such as WebVR and WebXR, so that users may live immersive experiences without installing headset-specific, custom-built apps. Mozilla’s chief R&D officer Sean White explained in a blog post:
We believe that the future of the web will be heavily intertwined with virtual and augmented reality, and that future will live through browsers.
(…) All of Firefox Reality is open source. Not only does this make it easier for manufacturers to add the browser to their platform, but it provides a level of transparency that our users have come to know and expect from Mozilla.
Firefox Reality initially supported the HTC Vive Focus and HTC Vive Wave platforms, adding later HTC Viveport, Oculus Go, and Daydream. HTC as a matter of fact positioned Firefox Reality as its default browser for its headsets. This week, Mozilla added Facebook’s Oculus Quest to the list of supported headsets.
Oculus Quest owners can visit sites, watch videos in a virtual window whilst also taking advantage of VR-specific features like 360 videos and WebVR support. Quest users can additionally use Mozilla Hubs to meet up other people in VR. As a user commented on Hacker News:
The interesting feature of this browser is navigating VR ready websites that provide an immersive experience (aka. webvr). You can also browse the regular web from your headsets, of course, but that’s not particularly exciting.
While Oculus has its own browser appearing across its various headsets too, the Firefox Reality browser emphasizes privacy (Enhanced Tracking Protection is turned on by default) and VR web activities. Virtual Reality triggers novel issues around privacy and data protection, as VR sites and apps may record behavioural and personal data. White outlines the importance of privacy for the Firefox Reality browser:
Mixed reality is still new. We don’t yet have all the answers for what privacy looks like in this new medium, but we are committed to finding the solution. We will continue to build on the proven permissions model of the web platform, which provides even more protection than native apps provide.
Firefox Reality is presently available in 10 languages (including Simplified and Traditional Chinese, Japanese and Korean), with other languages being added. Mozilla plans to “bring the experience to desktop VR and a variety of standalone AR headsets in the second half of this year”.
MMS • RSS
Article originally posted on Data Science Central. Visit Data Science Central
Several years ago, I met a senior director from a large company. He mentioned the company he worked for was facing data quality issues that eroded customer satisfaction, and he had spent months investigating the potential causes and how to fix them. “What have you found?” I asked eagerly. “It is a tough issue. I did not find a single cause, on the contrary, many things went wrong,” he replied. He then started citing a long list of what contributed to the data quality issues – almost every department in the company was involved and it was hard for him to decide where to begin next. This is a typical case when dealing with Data Quality, which directly relates to how an organization is doing its business and the entire life cycle of the data itself.
.
Before data science became mainstream, data quality was mostly mentioned for the reports delivered to internal or external clients. Nowadays, because machine learning requires a large amount of training data, the internal datasets within an organization are in high demand. In addition, the analytics are always hungry for data and constantly search for data assets that can potentially add value, which has led to quick adoptions of new datasets or data sources not explored or used before. This trend has made data management and good practices of ensuring good data quality more important than ever.
.
The goal of this article is to give you a clear idea of how to build a data pipeline that creates and sustains good data quality from the beginning. In other words, data quality is not something that can be fundamentally improved by finding problems and fixing them. Instead, every organization should start by producing data with good quality in the first place.
.
First of all, what is Data Quality? Generally speaking, data is of high quality when it satisfies the requirements of its intended use for clients, decision-makers, downstream applications and processes. A good analogy is the quality of a product produced by a manufacturer, for which good product quality is not the business outcome, but drives customer satisfaction and impacts the value and life cycle of the product itself. Similarly, the quality of the data is an important attribute that could drive the value of the data and, hence, impact aspects of the business outcome, such as regulatory compliance, customer satisfaction, or accuracy of decision making. Below lists 5 main criteria used to measure data quality:
-
Accuracy: for whatever data described, it needs to be accurate.
-
Relevancy: the data should meet the requirements for the intended use.
-
Completeness: the data should not have missing values or miss data records.
-
Timeliness: the data should be up to date.
-
Consistency: the data should have the data format as expected and can be cross reference-able with the same results.
The standard for good data quality can differ depending on the requirement and the nature of the data itself. For example, the core customer dataset of a company needs to meet very high standards for the above criteria, while there could be a higher tolerance of errors or incompleteness for a third-party data source. For an organization to deliver data with good quality, it needs to manage and control each data storage created in the pipeline from the beginning to the end. Many organizations simply focus on the final data and invest in data quality control effort right before it is delivered. This is not good enough and too often, when an issue is found in the end, it is already too late – either it takes a long time to find out where the problem came from, or it becomes too costly and time consuming to fix the issue. However, if a company can manage the data quality of each dataset at the time when it is received or created, the data quality is naturally guaranteed. There are 7 essential steps to making that happen:
.
1. Rigorous data profiling and control of incoming data
.
In most cases, bad data comes from data receiving. In an organization, the data usually comes from other sources outside the control of the company or department. It could be the data sent from another organization, or, in many cases, collected by third-party software. Therefore, its data quality cannot be guaranteed, and a rigorous data quality control of incoming data is perhaps the most important aspect among all data quality control tasks. A good data profiling tool then comes in handy; such a tool should be capable of examining the following aspects of the data:
-
Data format and data patterns
-
Data consistency on each record
-
Data value distributions and abnormalies
-
Completeness of the data
It is also essential to automate the data profiling and data quality alerts so that the quality of incoming data is consistently controlled and managed whenever it is received – never assume an incoming data is as good as expected without profiling and checks. Lastly, each piece of incoming data should be managed using the same standards and best practices, and a centralized catalog and KPI dashboard should be established to accurately record and monitor the quality of the data.
2. Careful data pipeline design to avoid duplicate data
.
Duplicate data refers to when the whole or part of data is created from the same data source, using the same logic, but by different people or teams likely for different downstream purposes. When duplicate data is created, it is very likely out of sync and leads to different results, with cascading effects throughout multiple systems or databases. In the end, when a data issue arises, it becomes difficult or time-consuming to trace the root cause, not to mention fixing it.
In order for an organization to prevent this from happening, a data pipeline needs to be clearly defined and carefully designed in areas including data assets, data modeling, business rules, and architecture. Effective communication is also needed to promote and enforce data sharing within the organization, which will improve overall efficiency and reduce any potential data quality issues caused by data duplications. This gets into the core of data management, the details of which are beyond the scope of this article. On a high level, there are 3 areas that need to be established to prevent duplicate data from being created:
-
A data governance program, which clearly defines the ownership of a dataset and effectively communicates and promotes dataset sharing to avoid any department silos.
-
Centralized data assets management and data modeling, which are reviewed and audited regularly.
-
Clear logical design of data pipelines at the enterprise level, which is shared across the organization.
With today’s rapid changes in technology platforms, solid data management and enterprise-level data governance are essential for future successful platform migrations.
.
3. Accurate gathering of data requirements
.
An important aspect of having good data quality is to satisfy the requirements and deliver the data to clients and users for what the data is intended for. It is not as simple as it first sounds, because:
-
It is not easy to properly present the data. Truly understanding what a client is looking for requires thorough data discoveries, data analysis, and clear communications, often via data examples and visualizations.
-
The requirement should capture all data conditions and scenarios – it is considered incomplete if all the dependencies or conditions are not reviewed and documented.
-
Clear documentation of the requirements, with easy access and sharing, is another important aspect, which should be enforced by the Data Governance Committee.
The role of Business Analyst is essential in requirement gathering. Their understanding of the clients, as well as current systems, allows them to speak both sides’ languages. After gathering the requirements, business analysts also perform impact analysis and help to come up with test plans to make sure the data produced meets the requirements.
.
4. Enforcement of data integrity
.
An important feature of the relational database is the ability to enforce data Integrity using techniques such as foreign keys, check constraints, and triggers. When the data volume grows, along with more and more data sources and deliverables, not all datasets can live in a single database system. The referential integrity of the data, therefore, needs to be enforced by applications and processes, which need to be defined by best practices of data governance and included in the design for implementation. In today’s big data world, referential enforcement has become more and more difficult. Without the mindset of enforcing integrity in the first place, the referenced data could become out of date, incomplete or delayed, which then leads to serious data quality issues.
.
5. Integration of data lineage traceability into the data pipelines
.
For a well-designed data pipeline, the time to troubleshoot a data issue should not increase with the complexity of the system or the volume of the data. Without the data lineage traceability built into the pipeline, when a data issue happens, it could take hours or days to track down the cause. Sometimes it could go through multiple teams and require data engineers to look into the code to investigate.
Data Lineage traceability has 2 aspects:
-
Meta-data: the ability to trace through the relationships between datasets, data fields and the transformation logic in between.
-
Data itself: the ability to trace a data issue quickly to the individual record(s) in an upstream data source.
Meta-data traceability is an essential part of effective data governance. This is enabled by clear documentation and modeling of each dataset from the beginning, including its fields and structure. When a data pipeline is designed and enforced by the data governance, the meta-data traceability should be established at the same time. Today, meta-data lineage tracking is a must-have capability for any data governance tool on the market, which makes it easier to store and trace through datasets and fields by a few clicks, instead of having data experts go through documents, databases, and even programs.
.
Data traceability is more difficult than meta-data traceability. Below lists some common techniques to enable this ability:
-
Trace by unique keys of each dataset: This first requires each dataset has one or a group of unique keys, which is then carried down to the downstream dataset through the pipeline. However, not every dataset can be traced by unique keys. For example, when a dataset is aggregated, the keys from the source get lost in the aggregated data.
-
Build a unique sequence number, such as a transaction identifier or record identifier when there are no obvious unique keys in the data itself.
-
Build link tables when there are many-to–many relationships, but not 1–to-1or 1–to–many.
-
Add timestamp (or version) to each data record, to indicate when it is added or changed.
-
Log data change in a log table with the value before a change and the timestamp when the change happens
Data traceability takes time to design and implement. It is, however, strategically critical for data architects and engineers to build it into the pipeline from the beginning; it is definitely worth the effort considering it will save a tremendous amount of time when a data quality issue does happen. Furthermore, data traceability lays the foundation for further improving data quality reports and dashboards that enables one to find out data issues earlier before the data is delivered to clients or internal users.
.
6. Automated regression testing as part of change management
.
Obviously, data quality issues often occur when a new dataset is introduced or an existing dataset is modified. For effective change management, test plans should be built with 2 themes: 1) confirming the change meets the requirement; 2) ensuring the change does not have an unintentional impact on the data in the pipelines that should not be changed. For mission-critical datasets, when a change happens, regular regression testing should be implemented for every deliverable and comparisons should be done for every field and every row of a dataset. With the rapid progress of technologies in big data, system migration constantly happens in a few years. Automated regression test with thorough data comparisons is a must to make sure good data quality is maintained consistently.
.
7. Capable data quality control teams
.
Lastly, 2 types of teams play critical roles to ensure high data quality for an organization:
Quality Assurance: This team checks the quality of software and programs whenever changes happen. Rigorous change management performed by this team is essential to ensure data quality in an organization that undergoes fast transformations and changes with data-intensive applications.
.
Production Quality Control: Depending on an organization, this team does not have to be a separate team by itself. Sometimes it can be a function of the Quality Assurance or Business Analyst team. The team needs to have a good understanding of the business rules and business requirements, and be equipped by the tools and dashboards to detect abnormalities, outliers, broken trends and any other unusual scenarios that happen on Production. The objective of this team is to identify any data quality issue and have it fixed before users and clients do. This team also needs to partner with customer service teams and can get direct feedback from customers and address their concerns quickly. With the advances of modern AI technologies, efficiency can be potentially improved drastically. However, as stated at the beginning of this article, quality control at the end is necessary but not sufficient to ensure a company creates and sustains good data quality. The 6 steps stated above are also required.
.
Summary
.
In conclusion, good data quality requires disciplined data governance, rigorous management of incoming data, accurate requirement gathering, thorough regression testing for change management and careful design of data pipelines, in addition to data quality control programs for the data delivered both externally and internally. For all quality problems, it is much easier and less costly to prevent the data issue from happening in the first place, rather than relying on defending systems and ad hoc fixes to deal with data quality problems. Finally, by following the 7 steps in this article, good data quality can not only be guaranteed and but also sustained.
MMS • RSS
Article originally posted on Data Science Central. Visit Data Science Central
Decision Trees, Random Forests and Boosting are among the top 16 data science and machine learning tools used by data scientists. The three methods are similar, with a significant amount of overlap. In a nutshell:
- A decision tree is a simple, decision making-diagram.
- Random forests are a large number of trees, combined (using averages or “majority rules”) at the end of the process.
- Gradient boosting machines also combine decision trees, but start the combining process at the beginning, instead of at the end.
Decision Trees and Their Problems
Decision trees are a series of sequential steps designed to answer a question and provide probabilities, costs, or other consequence of making a particular decision.

They are simple to understand, providing a clear visual to guide the decision making progress. However, this simplicity comes with a few serious disadvantages, including overfitting, error due to bias and error due to variance.
- Overfitting happens for many reasons, including presence of noise and lack of representative instances. It’s possible for overfitting with one large (deep) tree.
- Bias error happens when you place too many restrictions on target functions. For example, restricting your result with a restricting function (e.g. a linear equation) or by a simple binary algorithm (like the true/false choices in the above tree) will often result in bias.
- Variance error refers to how much a result will chance based on changes to the training set. Decision trees have high variance, which means that tiny changes in the training data have the potential to cause large changes in the final result.
Random Forest vs Decision Trees
As noted above, decision trees are fraught with problems. A tree generated from 99 data points might differ significantly from a tree generated with just one different data point. If there was a way to generate a very large number of trees, averaging out their solutions, then you’ll likely get an answer that is going to be very close to the true answer. Enter the random forest—a collection of decision trees with a single, aggregated result. Random forests are commonly reported as the most accurate learning algorithm.
Random forests reduce the variance seen in decision trees by:
- Using different samples for training,
- Specifying random feature subsets,
- Building and combining small (shallow) trees.
A single decision tree is a weak predictor, but is relatively fast to build. More trees give you a more robust model and prevent overfitting. However, the more trees you have, the slower the process. Each tree in the forest has to be generated, processed, and analyzed. In addition, the more features you have, the slower the process (which can sometimes take hours or even days); Reducing the set of features can dramatically speed up the process.
Another distinct difference between a decision tree and random forest is that while a decision tree is easy to read—you just follow the path and find a result—a random forest is a tad more complicated to interpret. There are a slew of articles out there designed to help you read the results from random forests (like this one), but in comparison to decision trees, the learning curve is steep.
Random Forest vs Gradient Boosting
Like random forests, gradient boosting is a set of decision trees. The two main differences are:
- How trees are built: random forests builds each tree independently while gradient boosting builds one tree at a time. This additive model (ensemble) works in a forward stage-wise manner, introducing a weak learner to improve the shortcomings of existing weak learners.
- Combining results: random forests combine results at the end of the process (by averaging or “majority rules”) while gradient boosting combines results along the way.
If you carefully tune parameters, gradient boosting can result in better performance than random forests. However, gradient boosting may not be a good choice if you have a lot of noise, as it can result in overfitting. They also tend to be harder to tune than random forests.
Random forests and gradient boosting each excel in different areas. Random forests perform well for multi-class object detection and bioinformatics, which tends to have a lot of statistical noise. Gradient Boosting performs well when you have unbalanced data such as in real time risk assessment.
References
Top Data Science and Machine Learning Methods Used in 2017
Random Forests explained intuitively
Boosting Algorithms for Better Predictions
Gentle Introduction to the Bias-Variance Trade-Off in Machine Learning
How to improve random Forest performance?
Training a Random Forest with a big dataset seems very slow #257
Gradient Boosting vs Random Forests
Using random forest for reliable classification and cost-sensitive learning for medical diagnosis
Applications of Gradient Boosting Machines
MMS • RSS
Article originally posted on Data Science Central. Visit Data Science Central
Monday newsletter published by Data Science Central. Previous editions can be found here. The contribution flagged with a + is our selection for the picture of the week. To subscribe, follow this link.
Featured Resources and Technical Contributions
- An elegant way to represent back & forward propagation in neural networks
- Comparing Model Evaluation Techniques Part 3: Regression Models
- Exploratory Data Analysis with Python
- Boosting Trading Models with Sagemaker and Essentia
- How to deal with missing data
- First steps with leading data visualization programs
- US Arrests: Hierarchical Clustering using DIANA and AGNES
- Logisitic Regression
- How Can Python Help Solve Machine Learning Challenges?
- Question: How much of training data is required?
Featured Articles
- Measuring Progress Toward AGI Is Hard
- Statistical Hypothesis Testing – Spinning The Wheel
- Is Your Data Ready for AI?
- The missing link for IoT – the Cloud
- Book: AI for People and Business
- Are Successful Data Scientists Hired or Trained?
- Return on Investment: KPIs for Measuring Automation
- Best Machine Learning Tools to Modernize your Software Development
- Ontario’s First-Ever Digital and Data Task Force
- How Data Science can transform Logistics
Picture of the Week

Source: article flagged with a +
To make sure you keep getting these emails, please add mail@newsletter.datasciencecentral.com to your address book or whitelist us. To subscribe, click here. Follow us: Twitter | Facebook.
An elegant way to represent forward propagation and back propagation in a neural network
MMS • RSS
Article originally posted on Data Science Central. Visit Data Science Central
Sometimes, you see a diagram and it gives you an ‘aha ha’ moment
Here is one representing forward propagation and back propagation in a neural network
I saw it on Frederick kratzert’s blog

A brief explanation is:
Using the input variables x and y, The forwardpass (left half of the figure) calculates output z as a function of x and y i.e. f(x,y)
The right side of the figures shows the backwardpass.
Receiving dL/dz (the derivative of the total loss with respect to the output z) , we can calculate the individual gradients of x and y on the loss function by applying the chain rule, as shown in the figure.
A more detailed explanation below from me
This post is a part of my forthcoming book on Mathematical foundations of Data Science. Please follow me on Linkedin – Ajit Jaokar if you wish to stay updated about the book
The goal of the neural network is to minimise the loss function for the whole network of neurons. Hence, the problem of solving equations represented by the neural network also becomes a problem of minimising the loss function for the entire network. A combination of Gradient descent and backpropagation algorithms are used to train a neural network i.e. to minimise the total loss function
The overall steps are
- In the forward propagate stage, the data flows through the network to get the outputs
- The loss function is used to calculate the total error
- Then, we use backpropagation algorithm to calculate the gradient of the loss function with respect to each weight and bias
- Finally, we use Gradient descent to update the weights and biases at each layer
- We repeat above steps to minimize the total error of the neural network.
Hence, in a nutshell, we are essentially propagating the total error backward through the connections in the network layer by layer, calculating the contribution (gradient) of each weight and bias to the total error in every layer, and then using the gradient descent algorithm to optimize the weights and biases, and eventually minimizing the total error of the neural network.
Explaining the forward pass and the backward pass
In a neural network, the forward pass is a set of operations which transform network input into the output space. During the inference stage neural network relies solely on the forward pass. For the backward pass, in order to start calculating error gradients, first, we have to calculate the error (i.e. the overall loss). We can view the whole neural network as a composite function (a function comprising of other functions). Using the Chain Rule, we can find the derivative of a composite function. This gives us the individual gradients. In other words, we can use the Chain rule to apportion the total error to the various layers of the neural network. This represents the gradient that will be minimised using Gradient Descent.
A recap of the Chain Rule and Partial Derivatives
We can thus see the process of training a neural network as a combination of Back propagation and Gradient descent. These two algorithms can be explained by understanding the Chain Rule and Partial Derivatives.
Gradient Descent and Partial Derivatives
As we have seen before, Gradient descent is an iterative optimization algorithm which is used to find the local minima or global minima of a function. The algorithm works using the following steps
- We start from a point on the graph of a function
- We find the direction from that point, in which the function decreases fastest
- We travel (down along the path) indicated by this direction in a small step to arrive at a new point
The slope of a line at a specific point is represented by its derivative. However, since we are concerned with two or more variables (weights and biases), we need to consider the partial derivatives. Hence, a gradient is a vector that stores the partial derivatives of multivariable functions. It helps us calculate the slope at a specific point on a curve for functions with multiple independent variables. We need to consider partial derivatives because for complex(multivariable) functions, we need to determine the impact of each individual variable on the overall derivative. Consider a function of two variables x and z. If we change x, but hold all other variables constant, we get one partial derivative. If we change z, but hold x constant, we get another partial derivative. The combination represents the full derivative of the multivariable function.
The Chain Rule
The chain rule is a formula for calculating the derivatives of composite functions. Composite functions are functions composed of functions inside other function(s). Given a composite function f(x) = h(g(x)), the derivative of f(x) is given by the chain rule as
You can also extend this idea to more than two functions. For example, for a function f(x) comprising of three functions A, B and C – we have
for a composite function f(x) = A(B(C(x)))
All the above, the elegantly summarised in this diagram
This post is a part of my forthcoming book on Mathematical foundations of Data Science. Please follow me on Linkedin – Ajit Jaokar if you wish to stay updated about the book
MMS • RSS
Article originally posted on InfoQ. Visit InfoQ
Peter Tesler, former lead Software Development Engineer in Test (SDET) at Walt Disney, recently announced the first major release of Smashtest, a new domain-specific language for describing and deploying test cases. Smashtest strongly focuses on improving tester productivity by expressing succintly in the language the repetitive testing chores performed by developers. The new language comes with dedicated tooling including a test runner which can run tests in parallel, and a REPL.
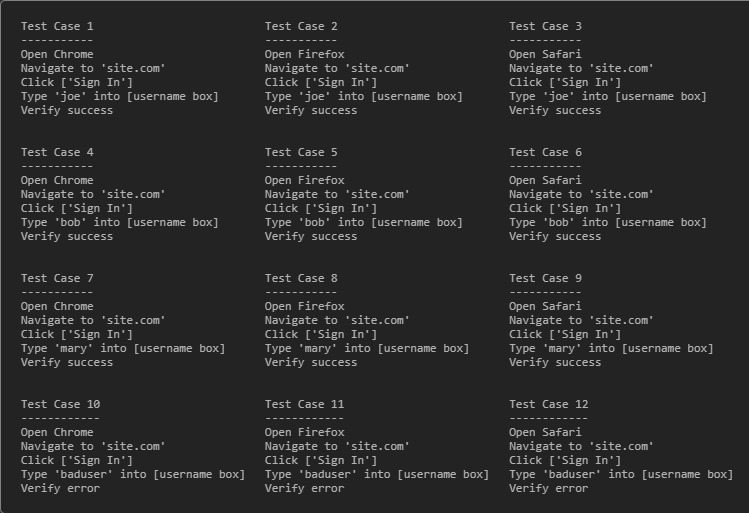
The major novel feature of Smashtest consists of allowing testers to declaratively describe their tests in a tree-like format. The following Smashtest script given on the Smashtest site:
Open Chrome
Open Firefox
Open Safari

    Navigate to 'site.com'

        Click 'Sign In'

            Type {username:} into 'username box'

                {username} is 'joe'
                {username} is 'bob'
                {username} is 'mary'

                    Verify success

                {username} is 'baduser'

                    Verify error
describes 3 (Chrome, Firefox and Safari browsers) x (3 + 1) = 12 tests in one go, covering both happy paths (joe, bob, mary) and error paths (baduser) in the same description:
Smashtest is thus a whitespace-sensitive language, using the white space to organize the tests into a tree. The tests to execute are deduced by depth-first exploration of the tree. Smashtest is best used with editors which can respect the existing spaces. A plug-in for the Atom Editor is made available in the release.
The Smashtest language includes a mocking API, allowing in particular to mock time and geolocation. Network conditions and throttling can also be described in the language (feature only available on Chrome browser). The language also includes an API for finding elements on a page, on which to conduct assertions.
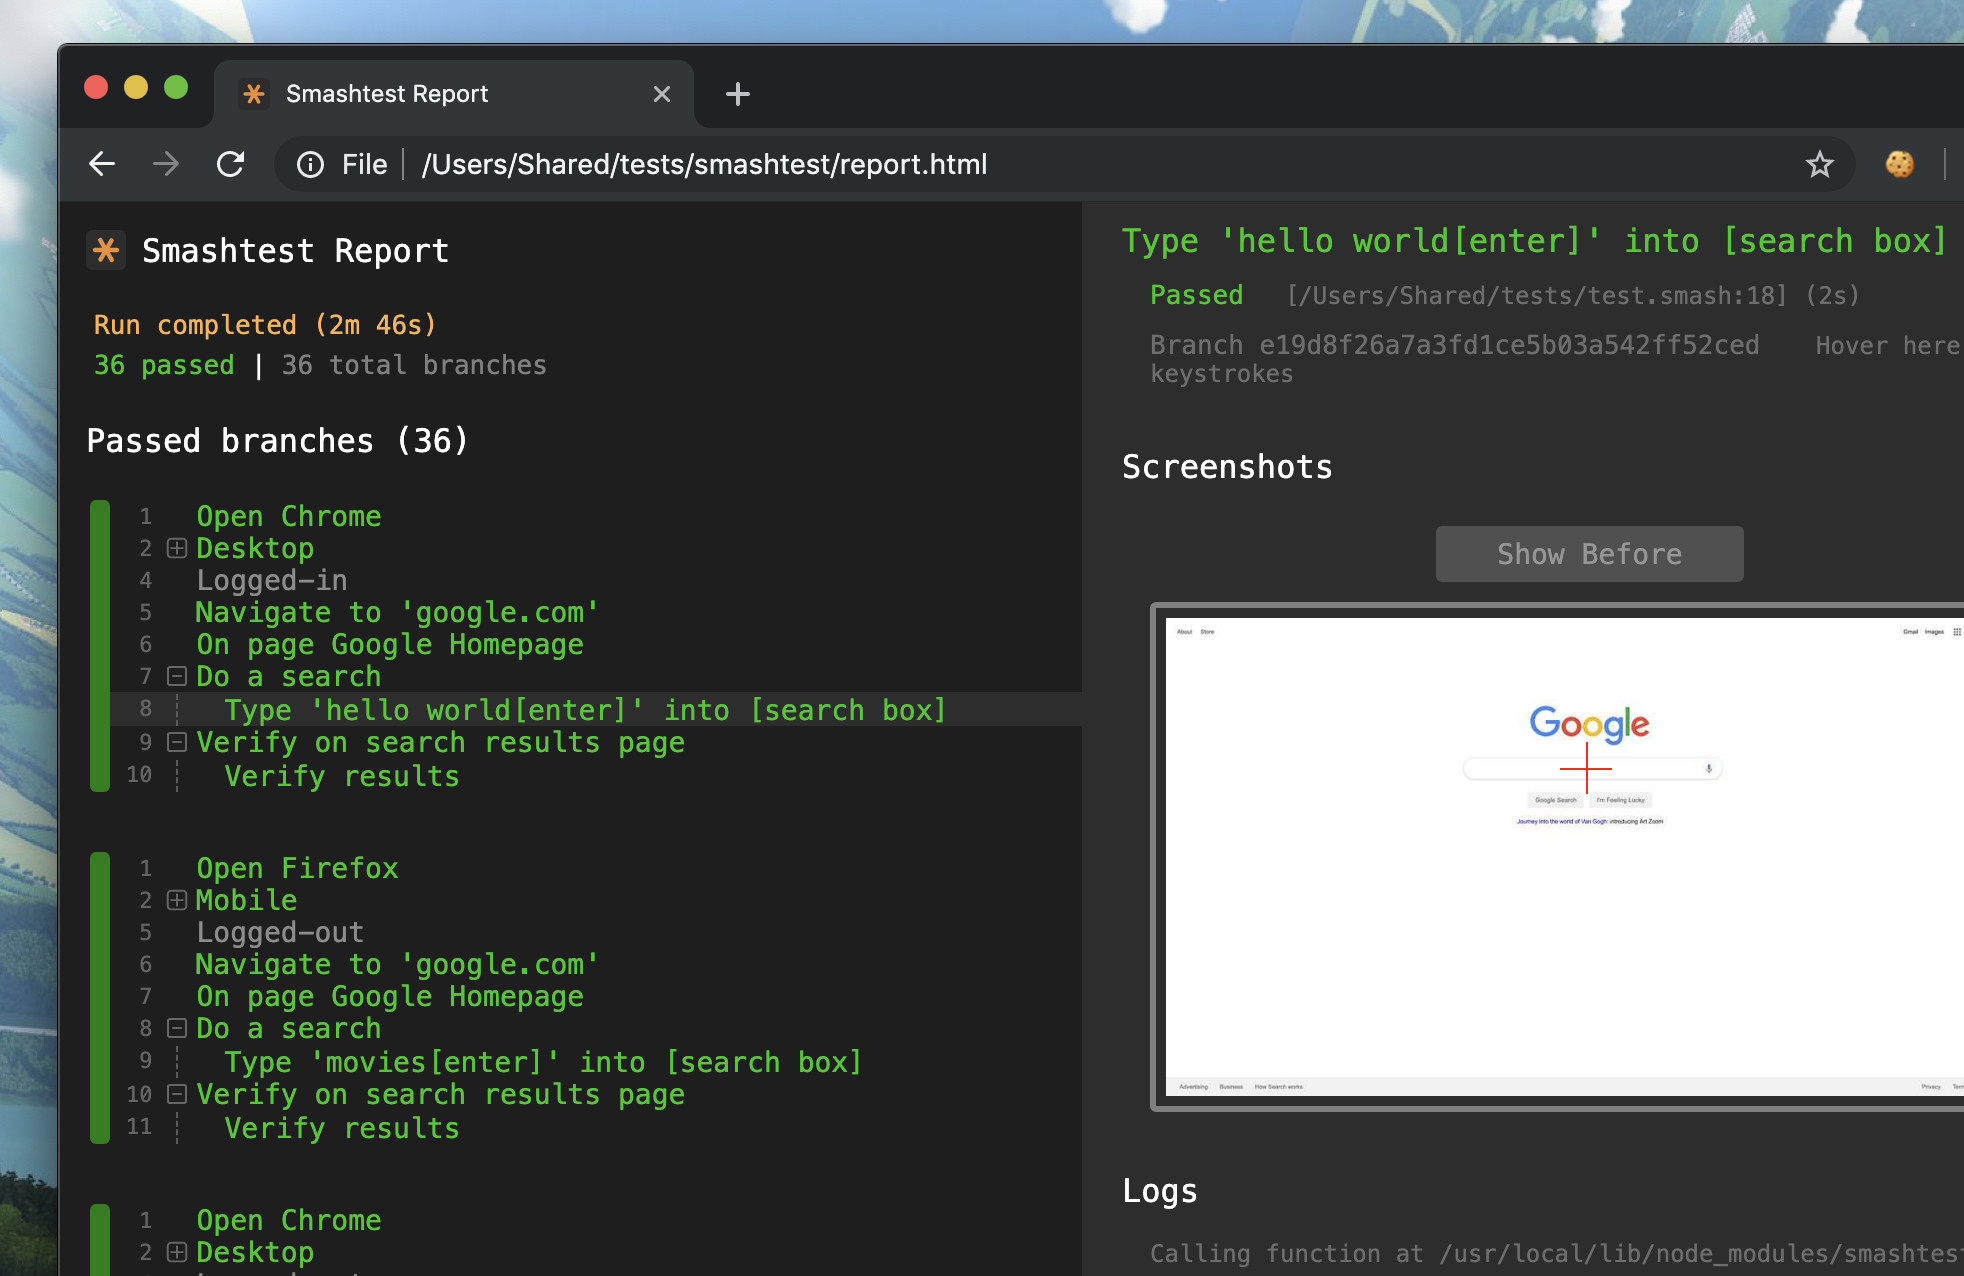
The Smashtest Command Line Interface (CLI) includes tooling for Continuous Integration/Continuous Delivery and a REPL(Read–Eval–Print Loop) interpreter. The CLI can additionally create reports with automatically-generated screenshots:
InfoQ interviewed Peter Tesler, creator of Smashtest, about Smashtest’s value proposition:
InfoQ: What drove you to write Smashtest? Why a new testing language?
Peter Tesler: The speed at which we’re able to write, deploy, update, and tear down automated tests is of utmost importance. Software changes rapidly and tests need to keep up. I wanted to build a testing language that made speed a priority.
I also wanted it to reflect how we think when we test, namely breadth-first. Meaning, when I’m at a particular state in my app, I think of all the permutations that can happen next. If I’m at a login box, for example, I list inside my head all the potential usernames I can enter. Users think depth-first, or in a linear series of steps. Traditional tests have always reflected the latter, but reflecting the former (writing tests as a tree of permutations) makes it easier to write as you think, see what you have covered, and do so quickly (since there’s much less to type out).
InfoQ: How does Smashtest compare with Gherkin-based solutions organized around Feature/Scenario and Given/When/Then triples?
Tesler: Smashtest handles Gherkin too. But traditional BDD/TDD tools don’t store tests as trees.
We also made optional what we thought was unnecessary, such as describing or naming tests, outside of the steps themselves. Tests have a tendency to look very similar to other tests, and usually get called unhelpful names like ‘cart test 014’. Having to come up with names only slows you down (though you can still add names and descriptions if you want to).
InfoQ: You mention an increase in testing speed. What parts of the testing process does Smashtest refer to?
Tesler: Test writing and maintenance. The time it takes to write a functional automated test these days is incredibly long, especially when we’re talking about selenium webdriver tests. The longer it takes to churn out a new test, and the more often the app and/or requirements change, the less bang for the buck you get out of automation. To the point where many organizations give up on automation altogether, in favor of manual testing (where test creation cost is low).
InfoQ: Do you have empirical or hard measures of speed improvements vs. hand-made or existing testing solutions?
Tesler: While we don’t have concrete empirical measures yet, I did time myself writing a few sample test scenarios using traditional webdriverjs vs. Smashtest, and saw around a 10-fold improvement. It’s really easy to add a single line in Smashtest and instantly double the permutations you have covered.
InfoQ: Three reasons for developers, testers and product owners to adopt Smashtest?
Tesler:
- Speed of writing tests. Ease of reading them.
- It handles a lot right out of the box. UI and API testing, various kinds of mocking, even a language to describe what a page should look like (so you don’t need 20+ verify steps, one after another).
- Live reports. They update as the tests run, combine similar failures into groups (makes it much easier to debug), display all the screenshots/logs, and they’re downright beautiful!
InfoQ: Three reasons for developers, testers and product owners not to adopt Smashtest?
Tesler:
- Like with any language, there’s a learning curve.
- You’ll have to break with tradition and write tests in a new way.
- Right now it has built-in support for testing web UIs (with selenium webdriver) and HTTP APIs. If you want to test anything else, you’ll have to write some custom js. But anything that can run in nodejs can run in Smashtest.
InfoQ: What comes next for Smashtest?
Tesler: Right now we’re focused on spreading the word and building the community. We’ll probably add support for more editors and languages, depending on where there’s demand.