Month: July 2021

MMS • RSS
Article originally posted on Data Science Central. Visit Data Science Central

I missed Tau day, which was the 28th of June. However, I’ve been thinking about the intersection of Tau, complex numbers, code libraries and Javascript in analytics for a while now, and this seemed like a good chance to explore one of my favorite topics: Tauism. — Kurt Cagle
One of the things that most young mathematicians (think eight years old or so) learn is that pie are square, a fact which is immediately refuted with the confused observation “No they’re not! Pies are round!” Later, of course, they discover algebra and geometry, where in fact it is proven demonstrably that, well, the circumference of a circle and the area of the same circle are related by two simple equations:
C=2πr
and
A=πr^2
The first law was at least known at the time of Euclid, though it would be a few centuries later that Archimedes actually calculated the ratio of the diameter (twice the radius) to the circumference to be roughly 3 1/7 (though in fact, he was able to get it right to within eight digits eventually, in Greek numeric notation). However, it would be early in the eighteen century AD that Welsh mathematician William Jones would use the Greek letter π (pi) for this particular ratio.
The great mathematician Leonhard Euler would eventually pull together the use of π, the base of the natural logarithms (e, approximately 2.71828) and the square root of negative one (called i) into one of the more fundamental equations of mathematics:
e^(πi) = -1
For the next three hundred years, π would reign supreme in mathematics as perhaps the single most well known constant ever. However, for several years, Euler debated whether to use π to indicate the circumference of a circle divided by the diameter (a ratio of about 3.1415927…) or to indicate the circumference divided by the ratio (a ratio of 6.2831854…). His decision, ultimately, to go with the former may have complicated mathematics far more than he’d planned.
In 2010, mathematician Michael Hartl wrote a paper that would eventually become known as the Tau Manifesto, in which he proposed using the letter tau (τ) for the ratio of the circumference divided by radius, the aforementioned 6.28 value. His arguments were actually quite compelling:
- One τ is precisely one turn around a circle, or one revolution (360°). τ/2 is half a circle or 180°, τ/4 is one fourth of a circle, or 90° and so forth. Compare this with 2π, π, and π/2 respectively. In general, this becomes the same as C= τr, as opposed to C= xn—
- Euler’s equation (which laid the foundation for complex numbers), can be expressed with τ as:
e^(τi) = 1
- Similarly, the area of a circle takes on the same characteristics as other power laws in mathematics and physics:
A = dfrac{1}{2} tau r^2; E= dfrac{1}{2} m v^2;
A=(1/2)τr^2 ; E = (1/2) mv^2
Where it really shines, however, is in areas such as trigonometry and complex matrix algebra. For instance, if you had trigonometric functions built around τ, you can state that
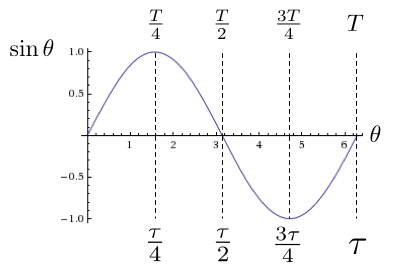
e^(iθ) = cos(θ) + i sin(θ), where 0 < θ < τ
This equation makes it clear that a quarter of the way through a revolution, the equation has the value +i, at halfway it’s -1, at 3/4 of the revolution, the equation is –i, and at one full revolution you’re right back to where you started. It also highlights the close association between exponential functions and rotations.

This becomes especially useful in gaming and 3D applications, in which the square root of -1 (the i part) is treated as an axis of rotation. In three dimensions, you end up with three such axes: i, j, and k. These are known as quaternions. If each of these are used to describe a complex number (such as 0.5 + 0.866i) on the unit sphere (a great circle), then by performing a rotation on that circle (from 0 to 1 τ ), you can position that object precisely along that rotation. Camera operators (and pilots) understand these three dimensions as pitch, yaw and roll.

These quaternions become especially important when dealing with rigging in three-dimensional work, involving vectors connecting end to end. These are also known as gimbals, again from the camera mounts that allow for orienting in any dimension. While in data science this can be done using matrix transformations, quaternion calculations are often faster and less time consuming to set up.
The skeleton of a 3D figure is made up of vectors, with quaternions acting as gimbals at the joints to help move the figure around.

A Library For Tau Based Complex Number Operations
The value of Tau (and the relationship between Tau revolutions and complex numbers, inspired me to write a small Javascript library that both defined some Tau helper functions (the Tau class, made up exclusively of static) and an immutable TauComplex class that was built specifically with Tau revolutions in mind. These scripts are available at https://github.com/kurtcagle/tau.
class Tau {
static TAU = 2 * Math.PI
static TAU_2 = this.TAU/2
static TAU_4 = this.TAU/4
static TAU_6 = this.TAU/6
static TAU_8 = this.TAU/8
static TAU_12 = this.TAU/12
constructor(){
// This consists solely of static methods and constants
}
// converts a revolution to degrees
static toDegrees(rev){return rev * 360}
// converts a revolution to radians
static toRadians(rev){return rev * this.TAU}
// converts from degrees to revolutions
static fromDegrees(deg){return deg / 360}
// converts from radians to revolutions
static fromRadians(rad){return rad / this.TAU}
// returns the sine value of the given revolution
static sin(rev){
return Math.sin(rev * this.TAU)
}
// returns the cosine value of the given revolution
static cos(rev){
return Math.cos(rev * this.TAU)
}
// returns the tangent value of the given revolution
static tan(rev){
return Math.tan(rev * this.TAU)
}
// returns the arcsine value of the given revolution
static asin(rev){
return this.fromRadians(Math.asin(rev))
}
// returns the arccosine value of the given revolution
static acos(rev){
return this.fromRadians(Math.acos(rev))
}
// For a given x,y value, returns the corresponding revolution from -0.5 to 0.5.
static atan(x,y){
return this.fromRadians(Math.atan2(y,x)) }
}
class TauComplex{
// Indicates the number of significant digits complex numbers are displayed using.
static SIGDIGITS = 5;
constructor(x,y){
this.x = x
this.y = y
return this
}
// toString() generates a complex number of the form “a+bi” for string output
toString(){
let minX = Math.abs(this.x)<1e-5?0:TauComplex.trim(this.x);
let minY = Math.abs(this.y)<1e-5?0:TauComplex.trim(this.y);
return `${minX} ${Math.sign(this.y)>=0?‘+’:‘-‘} ${Math.abs(minY)}i`
}
// generates the length of the complex number vector
get modulus(){
return Math.sqrt(this.x*this.x + this.y*this.y);
}
// generates the square of the length of the complex number vector. This avoids the need to take the square root
get modsquare(){
return this.x*this.x + this.y*this.y;
}
// retrieves the angle relative to the positive x axis of the complex number, in revolutions
get theta(){
let angle = Tau.atan(this.x,this.y);
let ySgn = Math.sign(this.y);
let adjAngle = ySgn<0?1+angle:angle;
return adjAngle;
}
// retrieves the complex conjugate (a-bi) of the complex number (a+bi)
get conjugate(){
return new TauComplex(this.x,-this.y)
}
// retrieves the complex inverse of the number (a+bi).
get inverse(){
return (this.conjugate).scale(1/this.modsquare)
}
// rotates the complex number through the angle, expressed in revolutions.
rotate(angle){
let newX = this.x * Tau.cos(angle) – this.y * Tau.sin(angle);
let newY = this.x * Tau.sin(angle) + this.y * Tau.cos(angle)
return new TauComplex(newX,newY)
}
// Multiplies the complex number by a scalar value (or values if two arguments are supplied)
scale(x,y=x){
let newX = this.x * x;
let newY = this.y * y;
return new TauComplex(newX,newY)
}
// translates the complex number by the given amount. Equivalent to adding two complex numbers
translate(x,y=x){
let newX = this.x + x;
let newY = this.y + y;
return new TauComplex(newX,newY)
}
// Adds two or more complex numbers together.
static sum(…c){
let reducer = (acc, cur) => new TauComplex(acc.x+cur.x,acc.y+cur.y)
return c.reduce(reducer)
}
// Multiples two or more complex numbers together.
static mult(…c){
let reducer = (acc, cur) => new TauComplex(acc.x*cur.x–acc.y*cur.y,acc.x*cur.y+acc.y*cur.x)
return c.reduce(reducer)
}
// Divides the first complex number by the second
static div(c1,c2){
return TauComplex.mult(c1,c2.inverse)
}
// Takes the complex number to the given power. Power MUST be a non-negative integer.
pow(power){
let arr = [];
for (var index=0;index!=power;index++){
arr.push(this);
}
if (arr.length>0) {
return TauComplex.mult(…arr)
}
else {
return new TauComplex(1,0);
}
}
// Returns the real portion of a complex number
get re(){
return this.x
}
// Returns the imaginary portion of a complex number
get im(){
return this.y
}
// Returns the complex number associated with a unit vector rotated by the revolution amount
static tau(rev){
return new TauComplex(Tau.cos(rev),Tau.sin(rev));
}
// Returns the complex exponent of the given complex number
get exp(){
return TauComplex.tau(this.y).scale(Math.exp(this.x))
}
// Creates a string representation of a number to the given significant digits, default being 5.
static trim(value,sigDigits=this.SIGDIGITS){
return value.toLocaleString(“en-us”,{maximumSignificantDigits:sigDigits})
}
static array(…arr){
return arr.map((subArr,index)=>new TauComplex(…subArr))
}
}
const _TauComplex = TauComplex;
exports.TauComplex = _TauComplex;
const _Tau = Tau;
exports.Tau = _Tau;
The complex class is reasonably complete for complex number manipulation, including handling addition and multiplication of complex numbers, creating complex conjugates, moduli, and equations for rotating, scaling and translating such numbers in the complex plane. A test script (TauTest.js) illustrates how these functions are invoked:
const { Tau, TauComplex } = require(‘./tau’);
TauComplex.SIGDIGITS = 3
const c1 = new TauComplex(1,2);
const c2 = c1.rotate(0.25);
const c3 = TauComplex.sum(c1,c2);
const c4 = new TauComplex(0,-1);
const c5 = new TauComplex(1,3/8);
const cArr = TauComplex.array([1,0],[0,1],[-1,0],[0,-1])
console.log(`c1: ${c1}`);
console.log(`c2: ${c2}`);
console.log(`c3: ${c3}`);
console.log(`c4: ${c4}`);
console.log(`modulus of c3: ${c3.modulus}`)
console.log(`modulus squared of c3: ${c3.modsquare}`)
console.log(`theta of c3: ${c3.theta}`)
console.log(`conjugate of c3: ${c3.conjugate}`)
console.log(‘c1 + c2: ‘+TauComplex.sum(c1,c2))
console.log(‘c1 * c2: ‘+TauComplex.mult(c1,c2))
console.log(‘c1 ^ 2: ‘+c1.pow(2))
console.log(‘c1 ^ 3: ‘+c1.pow(3))
console.log(‘1 / c1: ‘+c1.inverse)
console.log(`c1 / c3: ${TauComplex.div(c1,c3)}`)
console.log(`exp(c5): ${c5.exp}`)
console.log(‘c1 scale 2: ‘+c1.scale(2));
console.log(‘c1 translate 2,3: ‘+c1.translate(2,3));
for (index=0;index<=12;index++){
console.log(`c4 rotate ${index}/12 or ${Tau.toDegrees(index/12)}: ${c4.rotate(index/12)}`)
}
console.log(`Complex Array: ${cArr}`);
with this test script generating the following output :
c1: 1 + 2i
c2: -2 + 1i

c3: -1 + 3i

c4: 0 - 1i

modulus of c3: 3.1622776601683795

modulus squared of c3: 10

theta of c3: 0.30120819117478337

conjugate of c3: -1 - 3i

c1 + c2: -1 + 3i

c1 * c2: -4 - 3i

c1 ^ 2: -3 + 4i

c1 ^ 3: -11 - 2i

1 / c1: 0.2 - 0.4i

c1 / c3: 0.5 - 0.5i

exp(c5): -1.92 + 1.92i

c1 scale 2: 2 + 4i

c1 translate 2,3: 3 + 5i

c4 rotate 0/12 or 0: 0 - 1i

c4 rotate 1/12 or 30: 0.5 - 0.866i

c4 rotate 2/12 or 60: 0.866 - 0.5i

c4 rotate 3/12 or 90: 1 - 0i

c4 rotate 4/12 or 120: 0.866 + 0.5i

c4 rotate 5/12 or 150: 0.5 + 0.866i

c4 rotate 6/12 or 180: 0 + 1i

c4 rotate 7/12 or 210: -0.5 + 0.866i

c4 rotate 8/12 or 240: -0.866 + 0.5i

c4 rotate 9/12 or 270: -1 + 0i

c4 rotate 10/12 or 300: -0.866 - 0.5i

c4 rotate 11/12 or 330: -0.5 - 0.866i

c4 rotate 12/12 or 360: 0 - 1i

Complex Array: 1 + 0i,0 + 1i,-1 + 0i,0 - 1i
One of the critical points about this library is that the complex numbers are meant to be treated as immutable, with any operation on a complex number generating a new complex number. For instance, if you wanted to add three complex numbers, you’d create an expression such as:
const c6 = TauComplex.sum(c1,c2,c3) => c6 = Sum of (c1,c2,c3): -2 + 6i
Complex numbers factor heavily in both pure and applied mathematics, and can be proved to be the largest complete set of numbers – you cannot construct another space of numbers that cannot be decomposed into complex numbers. Additionally, the equations used to create approximations of surfaces, known as the Taylor Series, makes extensive use of complex numbers.
There is one final point to be made in this particular article. There is a tendency to look at either Python or R when dealing with mathematics, but it’s worth noting that it is perfectly possible to create mathematics libraries and classes in JavaScript as well. Indeed, Javascript contains its own equivalents of both Pandas (Danfo.js) and NumPy (nympy.js), two of the foundational classes, and Google’s TensorFlow library has been ported over to Javascript as well (primarily around the node.js version). In some cases, Javascript is even faster than Python in the analytics space, especially given recent optimizations for handling binary data types.
MMS • RSS
Article originally posted on Data Science Central. Visit Data Science Central

The telecom sector is no longer limited to delivering basic phone and internet service. In the Internet of Things (IoT) era, mobile and broadband services are driving technological innovation. Telcos are utilizing AI to handle and analyze these massive amounts of Big Data to extract meaningful insights and improve customer experience, operations, and revenue through new products and services. With Gartner predicting that 20.4 billion connected devices would be in use globally by 2020, more service providers can see the benefit of AI in the telecom industry, including optimization, maintenance, client targeting, and more.
1. Network Optimization
To strengthen their infrastructure, 63.5 percent of operators are investing in AI systems. In the telecom industry, artificial intelligence is critical for CSPs to develop self-optimizing networks (SONs), which allow operators to autonomously adjust network quality based on traffic data by region and time zone. Artificial intelligence in the telecom industry utilizes powerful algorithms to seek patterns in data. It allows telcos to discover, forecast network anomalies, and proactively address problems before customers are harmed.
2. Detecting and preventing fraud
ML algorithms cut down fraudulent activities happening in the telecom industry, such as fake profiles, illegal access, etc. With the aid of advanced ML algorithms, the system can detect the irregularities occurring on a real-time basis, which is more effective than what human analysts can perform.
3. Enabling predictive analytics
By combining data, complex algorithms, and machine learning approaches to anticipate future results based on historical data, AI-driven predictive analytics assists telcos in providing better services. It means that operators may use data-driven insights to track the health of equipment, predict failure based on patterns, and prevent problems with communications hardware like cell towers, power lines, data center servers, and even set-top boxes in consumers’ homes. Through the process of Predictive Analytics, CSPs can make efficient and effective business decisions. Technologies such as network automation and intelligence will allow for more accurate root cause investigation and issue prediction. With technologies such as AI/ML, it will support more strategic aims like creating new consumer experiences and efficiently dealing with evolving company needs.
4. Optimizing Service Quality
Machine learning and artificial intelligence in telecom can assist you in improving the quality of your service. You can apply Machine Learning techniques to forecast how your network’s consumption will change over time across the different geographies it serves. In order to improve optimization, a variety of criteria can be considered, including time zone, hour, weather, national or regional holidays, and more.
5. Improve Customer Service
Another advantage of AI in telecom is through the automation of the customer service mechanism. It can help telcos reinvent customer relationships through personalized, intelligent, and persistent two-way conversations at scale. Conversational AI systems are another use-case of AI in telecom. According to Juniper Research, virtual assistants have learned to automate and scale one-on-one conversations so effectively that they are expected to save businesses up to $8 billion annually by 2022. The large volume of support requests for installation, set up, troubleshooting, and maintenance, which often overwhelm customer service centers, has led telcos to turn to virtual assistants for assistance. Operators can add self-service capabilities that show customers how to install and run their own devices using data science, AI, and machine learning.
6. Preventing Malicious Activity
Machine Learning can effectively protect your network from dangerous behaviours such as DDoS attacks. Using AI in telecom, the network can be trained to recognize a large number of similar requests that are inundating it. At the same time, it lets them decide whether to deny these requests outright or shunt them to a less busy data center to be handled manually by your staff.
7. Foster innovation and drive new business
One of the promises of 5G is to bring Industry 4.0 use cases to fruition by enabling high speed, low latency, and dense deployment of endpoints such as sensors, robots, and video cameras. It opens up new business opportunities for telcos to not only outsourced IT services to the enterprises but also offer innovative services driven by AI at the Edge. New innovative AI-driven services are geared to address many new business segments, for which telecom operators will be one of the beneficiaries.
AI technology plays an essential role in digital transformation across all industries and verticals. The crucial integration of AI in the telecom industry will help assist and guide CSPs in delivering, managing, and optimizing the telecom infrastructure and networks.
Do you agree artificial intelligence is changing the telecom industry? If yes, how will it benefit an operator? Feel free to share your thoughts in the comments section.
Learn how augmented analytics can help transform your approach to enterprise AI
MMS • RSS
Posted on nosqlgooglealerts. Visit nosqlgooglealerts
executive summary:
Request a sample copy of this report- Request a free sample
Reports on the NoSQL software market help readers understand industry behavior by looking at past and present business scenarios and guessing the trajectory from 2020 to 2025. In addition, it details the size and share of markets and submarkets, focusing on key factors such as key drivers, obstacles and opportunities for expansion.
According to experts, the NoSQL software market is expected to accumulate significant profits over the forecast period and strengthen at a CAGR of XX% by 2025.
This document has another section detailing the competitiveness of the industry, revealing the strategies adopted by well-known companies to generate notable returns over the next few years. It also answers questions related to the uncertainty caused by the outbreak of the COVID-19 pandemic in this market.
Market snapshot:
Regional analysis:
- North America, Europe, Asia Pacific, South America, the Middle East and Africa, and Southeast Asia are key regional contributors to NoSQL software market valuations.
- This document contains the industry share of each region corresponding to the amount and amount of consumption.
- The role of the top regions in overall market growth is evaluated.
Product Landscape Overview:
- The product landscape of the NoSQL software market is divided into cloud-based and web-based.
- The market share of each product type is disclosed.
- It provides data on the revenue generated by each product segment and the total sales accumulated.
Application Scope Overview:
- The report branches the application spectrum of the NoSQL software market into e-commerce, social networking, data analytics, data storage and more.
- Estimates of consumption and value for all application segments are proven by statistics.
- You also need to forecast the market share of each application segment during the analysis period.
Overview of a competitive arena:
- The main competitors in the NoSQL software market are MongoDB, OrientDB, Amazon, Azure Cosmos DB, Couchbase, ArangoDB, CouchDB, MarkLogic, SQL-RD, RethinkDB, RavenDB, Microsoft and Redis.
- This document provides a detailed business overview of all cited companies.
- This includes records of each company’s net sales, sales, operating profit, pricing model, and other financial parameters.
- The manufacturing facilities and operating areas of major organizations are also illuminated.
- Recent investments, acquisitions, partnerships, mergers, and new entrants to the market are also documented.
Purpose of research:
- Focus on leading global NoSQL software market manufacturers to define, explain and analyze sales volume, value, market share, market competitiveness, SWOT analysis and development plans for the next few years.
- In addition, trade analysts throughout the value chain have made significant efforts to carry out this group action, adding hard work to create key players with useful primary and secondary data on the global NoSQL software market. To trade contributors
- Analyze competitive developments such as market expansions, agreements, new product launches and acquisitions.
- Strategically profile key players and comprehensively analyze their growth strategies.
Reasons to choose this report:
- It provides a complete analysis of market dynamics, market conditions, and competitive NoSQL software views.
- Forecast Global NoSQL software industry trends show market momentum, constraints and growth opportunities.
- The five-year forecast view shows how the market is expected to grow in the next few years.
- The survey shows all important global NoSQL software industry industries, including product types, applications, and geographic regions.
Important questions answered in the report:
- What is the market growth rate of the NoSQL software market?
- What are the main drivers of the global NoSQL software market?
- Who are the major manufacturers on the market?
- What are the market opportunities, market risks and market overviews?
- What are the sales, revenue and price analysis of the top manufacturers in the NoSQL software market?
- Who are the distributors, traders and dealers in the NoSQL software market?
- What are the opportunities and threats to the NoSQL software market facing vendors in the global NoSQL software industry?
- What are sales, revenue and price analysis by market type and application?
- What is sales, revenue and price analysis by industry region?
Request customization for this report- Request customization
Administrator
![]()
Marketprimes.com is a hub for market intelligence products and services.
Streamline market research reporting and service purchases through a single integrated platform by bringing all major publishers and their services together in one place.
Customers are affiliated with Maread more…
NoSQL Software Market Structure, Industry Inspection, and 2025 Forecast
Source link NoSQL Software Market Structure, Industry Inspection, and 2025 Forecast
MMS • RSS
Posted on nosqlgooglealerts. Visit nosqlgooglealerts

Apache Cassandra 4.0 is now officially released one year after the beta. Version 4 had been in development for three years, and since then the Cassandra team has fixed over 1000 bugs. The widespread NoSQL database management system is now scalable in the petabyte range. According to the publisher, it is the most stable and consistent release of the database software to date.
Accelerated scaling and faster release cycles
Fault Injections and Zero Copying Streaming should be highlighted in terms of new functions: With this, Cassandra 4.0 should stream the data between the nodes about five times faster than its predecessors during scaling (for example when adding a new data center). According to the release announcement, large versions should now appear annually and receive support for three years, but given the development times so far, this announcement seems a bit ambitious: The beta of the current version was one year ago, and the last major version was released six years ago. So far, the project, which is largely driven by DataStax, has been characterized by a more incremental release practice.
Clusters with up to 1000 nodes
According to the provider, the new main version can handle clusters of up to 1000 nodes. Companies like Amazon, DataStax, Iland and Instaclustr have apparently “donated” software and data that went into the development. The result should be a particularly robust version of the database system compared to the previous versions: According to the development team, Cassandra will no longer have any new functions or groundbreaking API changes in the house for future builds. Most recently, DataStax presented a Kubernetes operator for Apache Cassandra and introduced the NoSQL database system as Database as a Service with the fully managed Astra service.
Globally distributed systems have their potential weak point in terms of consistency. Cassandra counters this with an incremental repair process, with which she continuously synchronizes data replicas in different storage locations with one another. The Cassandra team has apparently fundamentally rewritten the algorithm for this repair function, as the process has previously consumed too many resources.
Real-time audit logging and system metrics in virtual tables
Cassandra 4.x provides users with real-time audit logs to keep track of what is going on in their clusters. Using logging, they should now be able to better monitor who is accessing data and when it is accessed. According to the provider, the logging should only have a minor impact on the workload performance. With the newly implemented fqltool the production utilization can obviously be recorded and analyzed. With the new one too CassandraNetworkAuthorizer Roles can be configured in such a way that, for example, users can only access a single data center, even if the company operates data centers in several locations.
The new version reveals system metrics and configuration settings via virtual tables that can be processed like any other Cassandra table. So far, the common way of monitoring has been through open source tools such as Cassandra Exporter from Instaclustr or the Metrics Collector from DataStax, with virtual tables, database operators should be more flexible in their choice of tools.
Z Java 11 garbage collector
Apache Cassandra 4.0 is supported by the Z Garbage Collector (ZGC) of Java 11, with which interruptions caused by “garbage collection” can be reduced to milliseconds in the future. This feature has been thoroughly tested since last year. Cassandra 4.x already supports a number of tools, including Spring Boot and Spring Data, Quarkus, the Kafka Connector from DataStax, Medusa for handling backups, and the Spark Apache Cassandra Connector.
About Apache Cassandra
Apache Cassandra is open source and is under the Apache License 2.0, behind the project is a team of voluntary contributors with a self-elected Project Management Committee (PMC) for the operational decisions in the area of community development and product release cycles. If you want to use Cassandra, you can Download the software from the Apache project website and yourself Keep up to date on the project via Twitter.
(yeah)
Big Data Software Market Size, Key Opportunities, Strategic Assessment, Strong Revenue …
MMS • RSS
Posted on mongodb google news. Visit mongodb google news

The documented report on Global Big Data Software Market by Reports Globe aims to offer an organized and methodical strategy for important aspects that have affected the market in recent years and future market opportunities that companies can trust. It gives readers clear market research for better judgment and better decision making on whether or not to invest. The report provides an analysis and overview of the future dynamics with an in-depth analysis of the most important players that are likely to contribute to the growth of the global Big Data Software market during the forecast period.
The market report also provides a correct assessment of the company strategies and business models that companies implement to stay in the market and lead. Some of the most important steps companies are taking are mergers and acquisitions, partnerships and collaborations to expand their regional and global reach. In addition, the players are also launching a new range of products to enrich their portfolio by using the latest technology and implementing them in their company.
Get FREE Sample copy of this Report with Graphs and Charts at: https://reportsglobe.com/download-sample/?rid=275484
The segmentation chapters enable readers to understand aspects of the market such as its products, available technology and applications. These chapters are written to describe their development over the years and the course they are likely to take in the coming years. The research report also provides detailed information on new trends that may define the development of these segments in the coming years.
Big Data Software Market Segmentation:
Big Data Software Market, By Application (2016-2027)
- Small and Medium Enterprises (SMEs)
- Large Enterprises
Big Data Software Market, By Product (2016-2027)
- On-premises
- Cloud-Based
Major Players Operating in the Big Data Software Market:
- FCS Computer Systems
- Qlik
- IBM
- Phocas Software
- Cyfe
- MongoDB
- Altair
- Elastic
- MicroStrategy
- Margasoft
- SAP
- Artelnics
- Informatica
- Radius
- Teradata
- Hitachi Vantara
- IQLECT
Company Profiles – This is a very important section of the report that contains accurate and detailed profiles for the major players in the global Big Data Software market. It provides information on the main business, markets, gross margin, revenue, price, production and other factors that define the market development of the players studied in the Big Data Software market report.
Global Big Data Software Market: Regional Segments
The different section on regional segmentation gives the regional aspects of the worldwide Big Data Software market. This chapter describes the regulatory structure that is likely to impact the complete market. It highlights the political landscape in the market and predicts its influence on the Big Data Software market globally.
- North America (US, Canada)
- Europe (Germany, UK, France, Rest of Europe)
- Asia Pacific (China, Japan, India, Rest of Asia Pacific)
- Latin America (Brazil, Mexico)
- Middle East and Africa
Get up to 50% discount on this report at: https://reportsglobe.com/ask-for-discount/?rid=275484
The Study Objectives are:
- To analyze global Big Data Software status, future forecast, growth opportunity, key market and key players.
- To present the Big Data Software development in North America, Europe, Asia Pacific, Latin America & Middle East and Africa.
- To strategically profile the key players and comprehensively analyze their development plan and strategies.
- To define, describe and forecast the market by product type, market applications and key regions.
This report includes the estimation of market size for value (million USD) and volume (K Units). Both top-down and bottom-up approaches have been used to estimate and validate the market size of Big Data Software market, to estimate the size of various other dependent submarkets in the overall market. Key players in the market have been identified through secondary research, and their market shares have been determined through primary and secondary research. All percentage shares, splits, and breakdowns have been determined using secondary sources and verified primary sources.
Some Major Points from Table of Contents:
Chapter 1. Research Methodology & Data Sources
Chapter 2. Executive Summary
Chapter 3. Big Data Software Market: Industry Analysis
Chapter 4. Big Data Software Market: Product Insights
Chapter 5. Big Data Software Market: Application Insights
Chapter 6. Big Data Software Market: Regional Insights
Chapter 7. Big Data Software Market: Competitive Landscape
Ask your queries regarding customization at: https://reportsglobe.com/need-customization/?rid=275484
How Reports Globe is different than other Market Research Providers:
The inception of Reports Globe has been backed by providing clients with a holistic view of market conditions and future possibilities/opportunities to reap maximum profits out of their businesses and assist in decision making. Our team of in-house analysts and consultants works tirelessly to understand your needs and suggest the best possible solutions to fulfill your research requirements.
Our team at Reports Globe follows a rigorous process of data validation, which allows us to publish reports from publishers with minimum or no deviations. Reports Globe collects, segregates, and publishes more than 500 reports annually that cater to products and services across numerous domains.
Contact us:
Mr. Mark Willams
Account Manager
US: +1-970-672-0390
Email: [email protected]
Website: Reportsglobe.com
Article originally posted on mongodb google news. Visit mongodb google news
Operational Database Management Market Size, Key Opportunities, Strategic Assessment, Strong …
MMS • RSS
Posted on mongodb google news. Visit mongodb google news
The documented report on Global Operational Database Management Market by Reports Globe aims to offer an organized and methodical strategy for important aspects that have affected the market in recent years and future market opportunities that companies can trust. It gives readers clear market research for better judgment and better decision making on whether or not to invest. The report provides an analysis and overview of the future dynamics with an in-depth analysis of the most important players that are likely to contribute to the growth of the global Operational Database Management market during the forecast period.
The market report also provides a correct assessment of the company strategies and business models that companies implement to stay in the market and lead. Some of the most important steps companies are taking are mergers and acquisitions, partnerships and collaborations to expand their regional and global reach. In addition, the players are also launching a new range of products to enrich their portfolio by using the latest technology and implementing them in their company.
Get FREE Sample copy of this Report with Graphs and Charts at: https://reportsglobe.com/download-sample/?rid=303270
The segmentation chapters enable readers to understand aspects of the market such as its products, available technology and applications. These chapters are written to describe their development over the years and the course they are likely to take in the coming years. The research report also provides detailed information on new trends that may define the development of these segments in the coming years.
Operational Database Management Market Segmentation:
Operational Database Management Market, By Application (2016-2027)
- Data Formatting
- Data Validation
- Error Tracking
Operational Database Management Market, By Product (2016-2027)
- Hardware
- Software
Major Players Operating in the Operational Database Management Market:
- Oracle
- Microsoft
- SAP
- IBM
- Intersystems Corporation
- Mongodb
- Marklogic
- Neo Technologies
- Mariadb Corporation
- Aerospike
- Datastax
Company Profiles – This is a very important section of the report that contains accurate and detailed profiles for the major players in the global Operational Database Management market. It provides information on the main business, markets, gross margin, revenue, price, production and other factors that define the market development of the players studied in the Operational Database Management market report.
Global Operational Database Management Market: Regional Segments
The different section on regional segmentation gives the regional aspects of the worldwide Operational Database Management market. This chapter describes the regulatory structure that is likely to impact the complete market. It highlights the political landscape in the market and predicts its influence on the Operational Database Management market globally.
- North America (US, Canada)
- Europe (Germany, UK, France, Rest of Europe)
- Asia Pacific (China, Japan, India, Rest of Asia Pacific)
- Latin America (Brazil, Mexico)
- Middle East and Africa
Get up to 50% discount on this report at: https://reportsglobe.com/ask-for-discount/?rid=303270
The Study Objectives are:
- To analyze global Operational Database Management status, future forecast, growth opportunity, key market and key players.
- To present the Operational Database Management development in North America, Europe, Asia Pacific, Latin America & Middle East and Africa.
- To strategically profile the key players and comprehensively analyze their development plan and strategies.
- To define, describe and forecast the market by product type, market applications and key regions.
This report includes the estimation of market size for value (million USD) and volume (K Units). Both top-down and bottom-up approaches have been used to estimate and validate the market size of Operational Database Management market, to estimate the size of various other dependent submarkets in the overall market. Key players in the market have been identified through secondary research, and their market shares have been determined through primary and secondary research. All percentage shares, splits, and breakdowns have been determined using secondary sources and verified primary sources.
Some Major Points from Table of Contents:
Chapter 1. Research Methodology & Data Sources
Chapter 2. Executive Summary
Chapter 3. Operational Database Management Market: Industry Analysis
Chapter 4. Operational Database Management Market: Product Insights
Chapter 5. Operational Database Management Market: Application Insights
Chapter 6. Operational Database Management Market: Regional Insights
Chapter 7. Operational Database Management Market: Competitive Landscape
Ask your queries regarding customization at: https://reportsglobe.com/need-customization/?rid=303270
How Reports Globe is different than other Market Research Providers:
The inception of Reports Globe has been backed by providing clients with a holistic view of market conditions and future possibilities/opportunities to reap maximum profits out of their businesses and assist in decision making. Our team of in-house analysts and consultants works tirelessly to understand your needs and suggest the best possible solutions to fulfill your research requirements.
Our team at Reports Globe follows a rigorous process of data validation, which allows us to publish reports from publishers with minimum or no deviations. Reports Globe collects, segregates, and publishes more than 500 reports annually that cater to products and services across numerous domains.
Contact us:
Mr. Mark Willams
Account Manager
US: +1-970-672-0390
Email: [email protected]
Website: Reportsglobe.com
Article originally posted on mongodb google news. Visit mongodb google news
MMS • RSS
Article originally posted on Data Science Central. Visit Data Science Central

Young and dynamic data science and machine learning enthusiasts are all are very interested in making a career transition by learning and doing as much hands-on learning as possible with these technologies and concepts as Data Scientists or Machine Learning Engineers or Data Engineers or Data Analytics Engineers. I believe they must have the Project Experience and a job-winning portfolio in hand before they hit the interview process.
Certainly, this interview process would be challenging, NOT only for the freshers, but also for experienced individuals since these are all new techniques, domain, process approach, and implementation methodologies that are totally different from traditional software development. Of course, we could adopt an agile mode of delivery and no excuse from modern cloud adoption techniques and state beyond all industries and domains, who are all looking and interested in artificial intelligence and machine learning (AI and ML) and its potential benefits.

In this article, let’s discuss how to choose the best data science and ML projects during the capstone stages of your schools, colleges, training institutions, and specific job-hunting perspective. You could map this effort with our journey towards getting your dream job in the data science and machine learning industry.
Without much ado, here are the top 20 machine learning projects that can help you get started in your career as a machine learning engineer or data scientist. Let us move into a curated list of data science and machine learning projects for practice that can be a great add-on to your portfolio –
1. Data Science Project – Ultrasound Nerve Segmentation
Problem Statement & Solution
In this project, you will be working on building a machine learning model that can identify nerve structures in a data set of ultrasound images of the neck. This will help enhance catheter placement and contribute to a more pain-free future.
Even the bravest patients cringe at the mention of a surgical procedure. Surgery inevitably brings discomfort, and oftentimes involves significant post-surgical pain. Currently, patient pain is frequently managed using narcotics that bring a number of unwanted side effects.
This data science project’s sponsor is working to improve the pain management system using indwelling catheters that block or mitigate pain at the source. These pain management catheters reduce dependence on narcotics and speed up patient recovery.
The project objective is to precisely identify the nerve structures in the given ultrasound images, and this is a critical step in effectively inserting a patient’s pain management catheter. This project has been developed in python language, so it is easy to understand the flow of the project and the objectives. They must build a model that can identify nerve structures in a dataset of given ultrasound images of the neck. Doing so would improve catheter placement and contribute to a more pain-free future.
Let see the simple workflow.

Certainly, this project would help us to understand the image classification and highly sensitive area of analysis in the medical domain.
Take away and outcome and of this project experience.
- Understanding what image segmentation is.
- Understanding of subjective segmentation and objective segmentation
- The idea of converting images into matrix format.
- How to calculate euclidean distance.
- Scope of what dendrogram are and what they represent.
- Overview of agglomerative clustering and its significance
- Knowledge of VQmeans clustering
- Experiencing grayscale conversion and reading image files.
- A practical way of converting masked images into suitable colours.
- How to extract the features from the images.
- Recursively splitting a tile of an image into different quadrants.
2. Machine Learning project for Retail Price Optimization
Problem Statement & Solution
In this machine learning pricing project, we must implement retail price optimization and apply a regression trees algorithm. This is one of the best ways to build a dynamic pricing model, so developers can understand how to build models dynamically with commercial data which is available from a nearby source and visualization of the solution is tangible.

In this competitive business world “PRICING A PRODUCT” is a crucial aspect. So, we must gather a lot of thought process into that solution approach. There are different strategies to optimize the pricing of products. And must take extra care during the pricing of the products due to their sensitive impact on the sales and forecast. While there are products whose sales are not very affected by their price changes, they could be luxury items or essentials products in the market. This machine learning retail price optimization project will focus on the former type of products.

This project clearly captures the data and aligns with the “Price Elasticity of Demand” phenomenon. This exposes the degree to which the effective desire for something changes as its price the customers desire could drop sharply even with a little price increase, I mean directly proportional relationship. Generally, economists use the term elasticity to denote this sensitivity to price increases.
In this Machine Learning Pricing Optimization project, we will take the data from the café shop and, based on their past sales, identify the optimal prices for their list of items, based on the price elasticity model of the items. For each café item, the “Price Elasticity” will be calculated from the available data and then the optimal price will be calculated. A similar kind of work can be extended to price any products in the market.
Take away and Outcome and of this project experience.
- Understanding the retail price optimization problem
- Understanding of price elasticity (Price Elasticity of Demand)
- Understanding the data and feature correlations with the help of visualizations
- Understanding real-time business context with EDA (Exploratory Data Analysis) process
- How to segregate data based on analysis.
- Coding techniques to identify price elasticity of items on the shelf and price optimization.
3. Demand prediction of driver availability using multistep Time Series Analysis

Problem Statement & Situation
In this supervised learning machine learning project, you will predict the availability of a driver in a specific area by using multi-step time series analysis. This project is an interesting one since it is based on a real-time scenario.
We all love to order food online and do not like to experience delivery fee price variation. Delivery charges are always highly dependent on the availability of drivers in your area in and around, so the demand of orders in your area, and distance covered would greatly impact the delivery charges. Due to driver unavailability, there is an impact in delivery pricing increasing and directly this will hit the many customers who have dropped off from ordering or moving into another food delivery provider, so at the end of the day food suppliers (Small/medium scale restaurants) are reducing their online orders.
To handle this situation, we must track the number of hours a particular delivery driver is active online and where he is working and delivering foods, and how many orders are in that area, so based on all these factors certainly, we can efficiently allocate a defined number of drivers to a particular area depending on demand as mentioned earlier.

Take away and Outcome and of this project experience.
- How to convert a Time Series problem to a Supervised Learning problem.
- What exactly is Multi-Step Time Series Forecast analysis?
- How does Data Pre-processing function in Time Series analysis?
- How to do Exploratory Data Analysis (EDA) on Time-Series?
- How to do Feature Engineering in Time Series by breaking Time Features to days of the week, weekends.
- Understand the concept of Lead-Lag and Rolling Mean.
- Clarity of Auto-Correlation Function (ACF) and Partial Auto-Correlation Function (PACF) in Time Series.
- Different strategic approaches to solving Multi-Step Time Series problem
- Solving Time-Series with a Regressor Model
- How to implement Online Hours Prediction with Ensemble Models (Random Forest and Xgboost)
4. Customer Market Basket Analysis using Apriori and FP- growth algorithms
Problem Statement & Solution
In this project, anyone can learn how to perform Market Basket Analysis (MBA) with the application of Apriori and FP growth algorithms based on the concept of association rule learning, one of my favourite topics in data science.
Mix and Match is a familiar term in the US, I remember I used to get the toys for my kid. It was the ultimate experience you know. Same time keeping things together nearby, like bread and jam–shaving razor and cream, these are the simple examples for MBA, and this is making the customer buy additional purchases more likely.

It is a widely used technique to identify the best possible mix of products or services that comes together commonly. This is also called “Product Association Analysis” or “Association Rules”. This approach is best fit physical retail stores and even online too. In other ways, it can help in floor planning and placement of products.

5. E-commerce product reviews – Pairwise ranking and sentiment analysis.
Problem Statement & Solution
Product recommendation systems for the products which are sold over the online-based pairwise ranking and sentiment analysis. So, we are going to perform sentiment analysis on product reviews given by the customers who are all purchased the items and ranking them based on weightage. Here, the reviews play a vital role in product recommendation systems.
Obviously, reviews from customers are very useful and impactful for customers who are going to buy the products. Generally, a huge number of reviews in the bucket would create unnecessary confusion in the selection and buying interest on a specific product. If we have appropriate filters from the collective informative reviews. This proportional issue has been attempted and addressed in this project solution.

This recommendation work has been done in four phases.
- Data pre-processing/filtering
- Which includes.
- Language Detection
- Gibberish Detection
- Profanity Detection
- Feature extraction,
- Pairwise Review Ranking,
- Which includes.
The outcome of the model will be a collection of the reviews for a particular product and its ranking based on relevance using a pairwise ranking approach method/model.

Take away and Outcome and of this project experience.
- EDA Process
- Over Textual Data
- Extracted Featured with Target Class
- Using Featuring Engineering and extracting relevance from data
- Reviews Text Data Pre-processing in terms of
- Language Detection
- Gibberish Detection
- Profanity Detection, and Spelling Correction
- Understand how to find gibberish by Markov Chain Concept
- Hands-On experience on Sentiment Analysis
- Finding Polarity and Subjectivity from Reviews
- Learning How to Rank – Like Pairwise Ranking
- How to convert Ranking into Classification Problem
- Pairwise Ranking reviews with Random Forest Classifier
- Understand the Evaluation Metrics concepts
- Classification Accuracy and Ranking Accuracy
6. Customer Churn Prediction Analysis using Ensemble Techniques
Problem Statement & Solution
In some situations, the customers are closing their accounts or switching to other competitor banks for too many reasons. This could cause a huge dip in their quarterly revenues and might significantly affect annual revenues for the enduring financial year, this would directly cause the stocks to plunge and the market cap to reduce considerably. Here, the idea is to be able to predict which customers are going to churn, and how to retain them, with necessary actions/steps/interventions by the bank proactively.
In this project, we must implement a churn prediction model using ensemble techniques.
Here we are collecting customer data about his/her past transactions details with the bank and statistical characteristics information for deep analysis of the customers. With help of these data points, we could establish relations and associations between data features and customer’s tendency to possible churn. Based on that, we will build a classification model to predict whether the specific set of customers(s) will indeed leave the bank or not. Clearly draw the insight and identify which factor(s) are accountable for the churn of the customers.

Take away and Outcome and of this project experience.
- Defining and deriving the relevant metrics
- Exploratory Data Analysis
- Univariate, Bivariate analysis,
- Outlier treatment
- Label Encoder/One Hot Encoder
- How to avoid data leakage during the data processing
- Understanding Feature transforms, engineering, and selection
- Hands-on Tree visualizations and SHAP and Class imbalance techniques
- Knowledge in Hyperparameter tuning
- Random Search
- Grid Search
- Assembling multiple models and error analysis.
7. Build a Music Recommendation Algorithm using KKBox’s Dataset.
Problem Statement & Solution
Music Recommendation Project using Machine Learning to predict the best chances of a user listening and loving a song again after their very first noticeable listening event. As we know, the most popular evergreen entertainment is music, no doubt about that. There might be a mode of listening on different platforms, but ultimately everyone will be listening to music with this well-developed digital world era. Nowadays, the accessibility of music services has been increasing exponentially ranging from classical, jazz, pop etc.,
Due to the increasing number of songs of all genres, it has become very difficult to recommend appropriate songs to music lovers. The question is that the music recommendation system should understand the music lover’s favourites and inclinations to other similar music lovers and offer the songs to them on the go, by reading their pulse.

In the digital market, we have excellent music streaming applications available like YouTube, Amazon Music, Spotify etc., All they have their own features to recommend music to music lovers based on their listening history and first and best choice. This plays a vital role in this business to catch the customers on the go. Those recommendations are used to predict and indicate an appropriate list of songs based on the characteristics of the music, which has been heard by music lovers over the period.
This project uses the KKBOX dataset and demonstrates the machine learning techniques that can be applied to recommend songs to music lovers based on their listening patterns which were created from their history.
Take away and Outcome and of this project experience.
- Understanding inferences about data and data visualization
- Gaining knowledge on Feature Engineering and Outlier treatment
- The reason behind Train and Test split for model validation
- Best Understanding and Building capabilities on the algorithm below
- Logistic Regression model
- Decision Tree classifier
- Random Forest Classifier
- XGBoost model
8.Image Segmentation using Masked R-CNN with TensorFlow
Problem Statement & Solution
Fire is one of the deadliest risk situations. Generally, fire can destroy an area completely in a very short span of time. Another end this leads to an increase in air pollution and directly affects the environment and an increase in global warming. This leads to the loss of expensive property. Hence early fire detection is very important.
The Object of this project is to build a deep neural network model that will give precise accuracy in the detection of fire in the given set of images. In this Deep Learning-based project on Image Segmentation using Python language, we are going to implement the Mask R-CNN model for early fire detection.

In this project, we are going to build early fire detection using the image segmentation technique with the help of the MRCNN model. Here, fire detection by adopting the RGB model (Color: Red, Green, Blue), which is based on chromatic and disorder measurement for extracting fire pixels and smoke pixels from the image. With the help of this model, we can locate the position where the fire is present, and which will help the fire authorities to take appropriate actions to prevent any kind of loss.

Take away and Outcome and of this project experience.
- Understanding the concepts
- Image detection
- Image localization
- Image segmentation
- Backbone
- Role of the backbone (restnet101) in Mask RCNN model
- MS COCO
- Understanding the concepts
- Region Proposal Network (RPN)
- ROI Classifier and bounding box Regressor.
- Distinguishing between Transfer Learning and Machine Learning.
- Demonstrating image annotation using VGG Annotator.
- The best understanding of how to create and store the log files per epoch.
9. Loan Eligibility Prediction using Gradient Boosting Classifier
Problem Statement & Solution
In this project, we are predicting if a loan should be given to an applicant or not for the given data of various customers who are all seeking the loan based on several factors like their credit score and history. The ultimate aim is to avoid manual efforts and give approval with the help of a machine learning model, after analyzing the data and processing for machine learning operations. On the top of the machine, the learning solution will look at different factors based on testing the dataset and decide whether to grant a loan or not to the respective individual.

In this ML problem, we use to cleanse the data and fill in the missing values and bringing various factors of the applicant like credit score, history and from those we will try to predict the loan granting by building a classification model and the output will be giving output in the form of probability score along with Loan Granted or Refused as output from the model.
Take away and Outcome and of this project experience.
- Understanding in-depth:
- Data preparation
- Data Cleansing and Preparation
- Exploratory Data Analysis
- Feature engineering
- Cross-Validation
- ROC Curve, MCC scorer etc
- Data Balancing using SMOTE.
- Scheduling ML jobs for automation
- How to create custom functions for machine learning models
- Defining an approach to solve
- ML Classification problems
- Gradient Boosting, XGBoost etc
10.Human Activity Recognition Using Multiclass Classification
Problem Statement & Solution
In this project we are going to classify human activity, we use multiclass classification machine learning techniques and analyze the fitness dataset from a smartphone tracker. 30 activities of daily participants have been recorded through a smartphone with embedded inertial sensors and build a strong dataset for activity recognition point of view. Target activities are WALKING, WALKING UPSTAIRS, WALKING DOWNSTAIRS, SITTING, STANDING, LAYING, by capturing 3-axial linear acceleration and 3-axial angular velocity at a constant rate of 50Hz. The objective is to classify activities mentioned above among 6 and 2 different axials. This was captured by an embedded accelerometer and gyroscope in the smartphone. The experiments have been video-recorded to label the data manually. The obtained dataset has been randomly partitioned into two sets as 70% for training and 30% for test data.

Take away and Outcome and of this project experience.
- Understanding
- Data Science Life Cycle
- EDA
- Univariate and Bivariate analysis
- Data visualizations using various charts.
- Cleaning and preparing the data for modelling.
- Standard Scaling and normalizing the dataset.
- Selecting the best model and making predictions
- How to perform PCA to reduce the number of features
- Understanding how to apply
- Logistic Regression & SVM
- Random Forest Regressor, XGBoost and KNN
- Deep Neural Networks
- Deep knowledge in Hyper Parameter tuning for ANN and SVM.
- How to plot the confusion matrix for visualizing the result
- Develop the Flask API for the selected model.
Project Idea Credits – ProjectPro helps professionals get their work done faster and with practical experience with verified reusable solution code, real-world project problem statements, and solutions from various industry experts.

So far, We have discussed 10 different projects, Hope you could feel each one of them at least high level and clear goal of what is the objective of the project and learning take away While doing the projects as hands-on.
I am sure you could feel the essence of those and digesting each concept in Data Science and Machine Learning. Learn More always!
Will discuss 10 more projects in a short while, Until then, Bye! See you!
MMS • RSS
Article originally posted on Data Science Central. Visit Data Science Central

Among the various industries, the retail sector is massively implementing AI and data analytics solutions. The industry is witnessing this accelerated growth in implementing these technologies due to reduced customer churn, improvement of customer retention rate, and, most importantly, to offer a better customer experience.
Retailers across the globe have now understood that customer insights can not just add profit to their business, but they can also help them add value to their business in terms of customer satisfaction, higher retention, and improved customer acquisition. As a result, the retailers implement technologies and services such as AI, advanced data analytics, and machine learning to their businesses to collect, process, and visualize data to generate actionable insights.
According to a report by Research and Market, the global retail analytics market is projected to grow with a 19.4% CAGR. The report also states that the retail analytics market shall reach a value of US$ 10.4 billion by the end of 2023.
Now that the rate at which retailers are implementing technologies like data analytics and artificial intelligence into their business is known let’s figure out the impact of these technologies in developing actionable customer insights.
1. Strategy
The first and foremost step to generate the insight is to develop an effective strategy to collect the data from sources such as comments, reviews, shopping patterns, and products purchased. It is highly recommended to create a roadmap that will allow the retailers to collect, process, and use the data to develop personalized experiences. With the help of data analytics assessment and strategy services, retailers can develop a plan of action that shall help them attract new customers while retaining the existing ones.
2. Marketing
To improve the reach of the business, effective marketing plans are a mandatory asset for any retailer. Data analytics solutions such as customer segmentation, data mining, and customer value analysis allow retailers to understand their customers’ preferences, frequent purchases, and purchases. This will enable them to provide preference-based offers and schemes, improving the customers’ overall shopping experience.
3. Customer Relationship
Retaining customers purely depends on the relationship a retailer has with its visitors. Providing appealing offers and personalized discounts may be one of the parameters in strengthening the relationship. However, the majority of customer relationships happen with after-sales services. How well a retailer provides maintenance of the product? And, How quickly the customer receives support from the retailer? Nevertheless, the major challenge associated with customer relationships is the retailers’ lack of maintenance and support. As a result, the retailer has to face customer complaints, churns, and loss of prospects.
Technologies such as AI-powered chatbots allow the businesses to mend the gap between customers and the retailer. With embedded technologies such as natural language processing and machine learning, AI-powered chatbots provide an interactive atmosphere to the customer, which helps them to get suitable solutions to their problems.
Now let’s look at the role of artificial intelligence and data analytics in the enhancement of customer experience.
According to a survey conducted by Salesforce, 80% of customers believe that company experience is as essential to them as a brand’s products or services. Over the period, capturing, analyzing, and processing the data has become a daunting challenge for retailers. However, with the digitization of the retail sector, the incorporation of smart devices has increased exponentially. These devices can leverage the technologies such as AI and data analytics in the following ways:
1. Price Optimization
Price optimization is one of the major concerns that every retailer has to consider when delivering a better customer experience. The reason being, that a customer will always opt for options that provide a reasonable price. This is where advanced data analytics services such as data strategy and assessment come in handy. These services offer a practical roadmap that can help retailers to provide a personalized experience to their customers.
2. Personalized Marketing
Attracting customers with unique and personalized offers is also one of the significant factors that require data analytics solutions in the retail industry. Retailers know that every customer has different preferences, and developing an offer matching their offer is the major challenge for retailers today. With the help of cutting technologies such as AI, retailers can understand the preferences and requirements of the customers.
3. Customer Analytics
Optimal customer experience is achieved when a retailer remembers its customers and offers them the attention they seek. AI-enabled customer analytics tools allow retailers to access larger and complex data spaces and unveil new business opportunities. As a result, the retailers can focus more on prioritizing these insights instead of hammering away at the underlying data.
Moreover, the AI-powered customer analytics tools can pinpoint every relationship data that retailer has collected. With the help of this data, the tools can help the retailers to predict the future behavior of their customers allowing them to create a personalized marketing strategy improving the customer experience and customer retention rate.
Author’s Pick
The retail landscape has changed entirely over the period. The implementation of digital technologies such as IoT, artificial intelligence, augmented reality, and virtual reality allows retailers to understand the market dynamics and how these technologies can help them in gaining a competitive advantage over their rivals.
Acquiring actionable customer insights can help the retail business to grow exponentially in the coming days. Moreover, a strategic plan of action to acquire these insights can help businesses to smoothen their operations. Connect with us and tell us your business vision with data analytics.
MMS • RSS
Posted on nosqlgooglealerts. Visit nosqlgooglealerts
It took much longer than expected but the queen of NoSQL DBMS’ latest version, Cassandra 4.0, is finally here.
Well, that took a while. Well over a year ago the Apache Software Foundation announced the beta of Cassandra 4.0. Developers were eager to get their hands on this, the most popular of the NoSQL databases. Alas, it took longer than many had hoped. Then at the 11th hour, a nasty bug was found, which further delayed Cassandra’s release for a few days. But, at long last Apache Cassandra 4.0 is here and ready to tear into your petabytes of data.
SEE: Electronic Data Disposal Policy (TechRepublic Premium)
If you haven’t met this open-source, NoSQL database it’s high time you did. Like all NoSQL databases, Cassandra’s designed to analyze huge—I opened by saying petabytes remembe—amounts of semi-structured data. The name of Cassandra’s game is storing massive amounts of incoming data with over a million writes per second and being able to quickly access this data in a scalable and reliable manner.
Because of that, Cassandra is used as the database of record for some of the world’s most critical applications by companies such as Apple, DataStax, Netflix and Yelp. Because it stores viable data from everything from finance to healthcare and everything in between, its data must have the highest guarantees of correctness and quality. So the Cassandra Project Management Committee decided: “The overarching goal of the 4.0 release is that Cassandra 4.0 should be at a state where major users would run it in production when it is cut.”
To make that happen, the Cassandra crew custom-built new data correctness tools. These covered:
- Property-based/fuzz testing
- Replay testing
- Upgrade/diff testing
- Performance testing
- Fault injection
- Unit/test coverage expansion
This wasn’t easy, and it took more time than expected. The developers also ran into numerous hiccups along the way. But, now they believe the code is fully baked and ready to be served. Indeed, Cassandra 4.0 is already being used in many major businesses. This was, after all, the idea in the first place.
Looking ahead, Cassandra won’t be taking so long with its next release. It may have taken six years to go from Cassandra 3.0 to 4.0, and the 4.0 beta took more than 13 months, but the plan is for Cassandra to move to a six-month release cycle. There will be six months between dot releases, and 12 months between major releases.
SEE: Snowflake data warehouse platform: A cheat sheet (free PDF) (TechRepublic)
Cassandra 4 brings to the table many improvements. This starts with supporting Java 11, long term support, in addition to Java 8. However, Java Development Kit 11 is only supported as an experimental feature, so you should not use it for production.
Cassandra also finally includes Audit Logging. With this, you can set configurable limits to heap memory and disk space to prevent out-of-memory errors. All database activity is logged per node as file-based records to a specified local filesystem directory.
In a related development, Cassandra now supports live full query logging. Once again you can set configurable limits to heap memory and disk space to prevent out-of-memory errors. Besides being helpful for live traffic capture and traffic replay, you can also use it for debugging query traffic and migration.
Cassandra’s new Zero Copy streaming, enables you to have five times faster data streaming between clusters. For users in the real world, that means five times faster mean time to recovery when there are problems. This, in turn, means it will reduce your total cost of ownership because you’ll need less cloud, server and network resources.
Finally, Cassandra’s programmers promise that it will be the most stable version of the program ever. I’m inclined to believe them. They take a lot of time and trouble to not just improve Cassandra’s performance but its stability as well. We’ll soon see if my faith in them has been justified. With the kinds of loads Cassandra deals with every day for every one of its customers, there’s no place to hide problems.

Also see
HTAP-Enabling In-Memory Computing Technologies Market Size, Key Opportunities, Strategic …
MMS • RSS
Posted on mongodb google news. Visit mongodb google news
The documented report on Global HTAP-Enabling In-Memory Computing Technologies Market by Reports Globe aims to offer an organized and methodical strategy for important aspects that have affected the market in recent years and future market opportunities that companies can trust. It gives readers clear market research for better judgment and better decision making on whether or not to invest. The report provides an analysis and overview of the future dynamics with an in-depth analysis of the most important players that are likely to contribute to the growth of the global HTAP-Enabling In-Memory Computing Technologies market during the forecast period.
The market report also provides a correct assessment of the company strategies and business models that companies implement to stay in the market and lead. Some of the most important steps companies are taking are mergers and acquisitions, partnerships and collaborations to expand their regional and global reach. In addition, the players are also launching a new range of products to enrich their portfolio by using the latest technology and implementing them in their company.
Get FREE Sample copy of this Report with Graphs and Charts at: https://reportsglobe.com/download-sample/?rid=292827
The segmentation chapters enable readers to understand aspects of the market such as its products, available technology and applications. These chapters are written to describe their development over the years and the course they are likely to take in the coming years. The research report also provides detailed information on new trends that may define the development of these segments in the coming years.
HTAP-Enabling In-Memory Computing Technologies Market Segmentation:
HTAP-Enabling In-Memory Computing Technologies Market, By Application (2016-2027)
- Retail
- Banks
- Logistics
- Ot
HTAP-Enabling In-Memory Computing Technologies Market, By Product (2016-2027)
- Single Node Based
- Distributed Systems Based
- Hybrid Memory Structure B
Major Players Operating in the HTAP-Enabling In-Memory Computing Technologies Market:
- Microsoft
- IBM
- MongoDB
- SAP
- Aerospike
- DataStax
- Grid
Company Profiles – This is a very important section of the report that contains accurate and detailed profiles for the major players in the global HTAP-Enabling In-Memory Computing Technologies market. It provides information on the main business, markets, gross margin, revenue, price, production and other factors that define the market development of the players studied in the HTAP-Enabling In-Memory Computing Technologies market report.
Global HTAP-Enabling In-Memory Computing Technologies Market: Regional Segments
The different section on regional segmentation gives the regional aspects of the worldwide HTAP-Enabling In-Memory Computing Technologies market. This chapter describes the regulatory structure that is likely to impact the complete market. It highlights the political landscape in the market and predicts its influence on the HTAP-Enabling In-Memory Computing Technologies market globally.
- North America (US, Canada)
- Europe (Germany, UK, France, Rest of Europe)
- Asia Pacific (China, Japan, India, Rest of Asia Pacific)
- Latin America (Brazil, Mexico)
- Middle East and Africa
Get up to 50% discount on this report at: https://reportsglobe.com/ask-for-discount/?rid=292827
The Study Objectives are:
- To analyze global HTAP-Enabling In-Memory Computing Technologies status, future forecast, growth opportunity, key market and key players.
- To present the HTAP-Enabling In-Memory Computing Technologies development in North America, Europe, Asia Pacific, Latin America & Middle East and Africa.
- To strategically profile the key players and comprehensively analyze their development plan and strategies.
- To define, describe and forecast the market by product type, market applications and key regions.
This report includes the estimation of market size for value (million USD) and volume (K Units). Both top-down and bottom-up approaches have been used to estimate and validate the market size of HTAP-Enabling In-Memory Computing Technologies market, to estimate the size of various other dependent submarkets in the overall market. Key players in the market have been identified through secondary research, and their market shares have been determined through primary and secondary research. All percentage shares, splits, and breakdowns have been determined using secondary sources and verified primary sources.
Some Major Points from Table of Contents:
Chapter 1. Research Methodology & Data Sources
Chapter 2. Executive Summary
Chapter 3. HTAP-Enabling In-Memory Computing Technologies Market: Industry Analysis
Chapter 4. HTAP-Enabling In-Memory Computing Technologies Market: Product Insights
Chapter 5. HTAP-Enabling In-Memory Computing Technologies Market: Application Insights
Chapter 6. HTAP-Enabling In-Memory Computing Technologies Market: Regional Insights
Chapter 7. HTAP-Enabling In-Memory Computing Technologies Market: Competitive Landscape
Ask your queries regarding customization at: https://reportsglobe.com/need-customization/?rid=292827
How Reports Globe is different than other Market Research Providers:
The inception of Reports Globe has been backed by providing clients with a holistic view of market conditions and future possibilities/opportunities to reap maximum profits out of their businesses and assist in decision making. Our team of in-house analysts and consultants works tirelessly to understand your needs and suggest the best possible solutions to fulfill your research requirements.
Our team at Reports Globe follows a rigorous process of data validation, which allows us to publish reports from publishers with minimum or no deviations. Reports Globe collects, segregates, and publishes more than 500 reports annually that cater to products and services across numerous domains.
Contact us:
Mr. Mark Willams
Account Manager
US: +1-970-672-0390
Email: [email protected]
Website: Reportsglobe.com
Article originally posted on mongodb google news. Visit mongodb google news