Month: March 2019

MMS • RSS
Article originally posted on Data Science Central. Visit Data Science Central

A recent visit to a local hospital provided some insight on a particular problem in health care. After speaking to a few healthcare professionals, it was revealed that patients who have surgery are at a significantly higher risk at developing a Pulmonary Embolism (PE) as a result of a Deep Vein Thrombosis (DVT) or blood clot. Clots are also referred to as a thrombus. However, once a clot begins to travel it is called an embolus. You may have heard of these terms in the context of the myriad of commercials about blood-thinning medications. DVTs typically originate in the legs or arms and are associated with clots that are formed in the venous system. These clots are associated with either a genetic disorder, surgery or pre-disposition as a result of the nature of a disease. In particular, cancer patients are at higher risk for developing PEs.
Effects: The effects of these clots can be devastating to patients depending on their size. In theory, if the patient experiences a DVT in a leg or arm, the clot then travels through their veins, passing through the right side of the heart and lodges itself into their lungs. We won’t get into the details of the physiology of the lungs but suffice it to say that if the clot is large enough, it can shut down an entire lung and lead to death due to other complications. The other cases generally involve clots that are small enough to only effect smaller branches of the bronchioles. In this case, blocking smaller portions of the lung from oxygenating blood via the alveoli can result in problems breathing. In summary, clots can lead to death, quickly. In less severe cases, patients can have trouble breathing beyond what is considered normal variances. Having a pulse oximeter on-hand is great for detecting sustained oxygen levels below 90% saturation levels.
Diagnosis : Diagnosis of a DVT or PE can be performed via a Computer Tomography (CT) scan. These scans are typically the result of a patient complaining about a challenge with breathing, recent surgery, and/or a pulse oximeter reading that is consistently below 90%. These factors are not meant to be an exhaustive list, but rather an example of the types of cases that lead to indications of a deeper problem. In order to identify whether the PE resulted from a DVT, an ultrasound examination can be performed to determine the precise location of a clot.
Treatment : So how do medical professionals deal with patients with DVTs and PEs? The standard procedure is to immediately place the patient on a Heparin drip intravenously (IV) in order to reduce the risk of the clotting by monitoring various parameters. Heparin is used in this manner due to its fast-acting properties of blood-thinning. In more severe cases, lovinox shots are administered subcutaneously in the midsection when time is of the essence. Once a patient has achieved a status of therapeutic in both the International Normalized Time (INR) or Prothrombin Time (PT) and the Partial Thromboplastin Time (PTT), a transition to Warfarin (Coumadin) can occur. An INR reading of 1 indicates an average person‘s clotting time. An ideal INR value for patients who have experienced a PE is between 2 and 3. One can think of this as a patient taking 2–3 times longer for their blood to clot.
Physiology of Clotting : Blood consist of red blood cells (RBCs), white blood cells (WBCs), plasma and platelets. Over half of the total content of blood is plasma. RBCs make up 40–45% volume of blood. One measure of this volume is called the haematocrit count. Blood coagulation begins when the blood platelets are activated. Activation of platelets can happen by breaking the walls of a blood vessel, which releases specific chemicals in the endothelium layer. Another alternative for activation to occur is by prolonged exposure to a rapid increase in shear stress that leads to platelets being damaged. The release of these chemicals into the endothelium layer triggers what’s known as the Coagulation Cascade. The cascade can be best described as a series of positive and negative feedback reactions. The ending result of these reactions is the conversion of fibrinogen to fibrin. Fibrin strands then link together with the activated platelets to form a cross-linked fibrin clot. The details of this process including clotting factors is shown below.
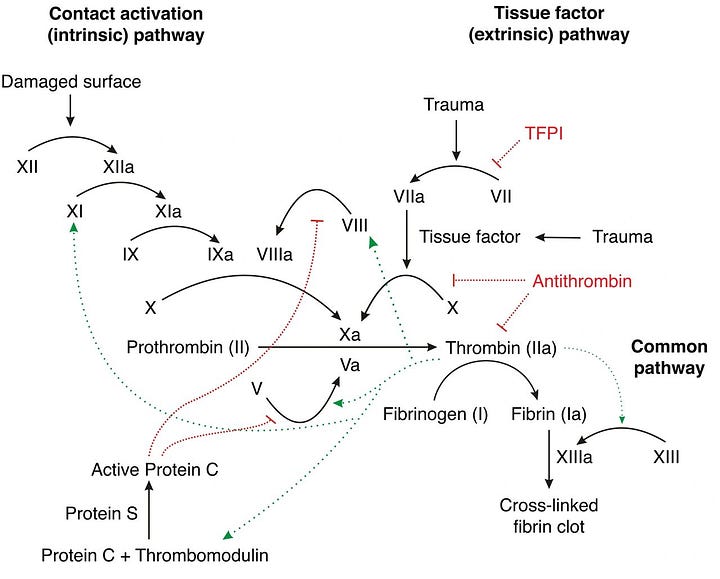
There are over 20 clotting factors involved in the process of blood clotting. Our liver is responsible for the production of various proteins which are involved with the clotting process. Vitamin K is an essential element in the clotting factors II, VII, IX, and X and anti-coagulant proteins C&S. Of the 20 or so clotting factors, the PTT and the INR are the two blood tests which indicate the presence of certain clotting factors. Normal PTT times range from 30 to 50 seconds and indicate the presence of the following coagulation factors: I, II, V, VIII, IX, X, XI and XII. Factors VII and XIII cannot be detected with the PTT test.
The Challenge: The rate at which the body metabolizes various foods containing vitamin K determines the INR readings. Foods that are high in vitamin K reverse the effect of warfarin, thus reducing the INR readings. As a result, being consistent with your intake of vitamin K is crucial in stabilizing the INR readings. Stability of the INR is achieved when subsequent blood tests are consistently in range. If INR readings are out of range, an anti-coagulation pharmacist then has the responsibility of immediately recommending a dosage adjustment based upon a dosage chart.
Anti-biotics also have an affect on INR readings. The website: Contemporary Clinic states that Warfarin is metabolized by the cytochrome (CYP) P450 enzyme system, specifically, CYPs 1A2, 3A4, and 2C9.2. Medications that inhibit these CYP enzymes reduce warfarin’s metabolism, increasing its effect, and increase INR. Medications that induce these CYP enzymes increase warfarin’s metabolism, decreasing its therapeutic effect, and decrease INR. Medications can also directly affect the clotting cascade, induce warfarin’s metabolism, or affect its protein binding. Warfarin is highly protein bound. If other medications displace warfarin on protein-binding sites, the free concentration will increase, creating a bleeding risk.
Antibiotics in the same class have similar effects on INR:
- Cephalosporins may increase INR by inhibiting production of vitamin K-dependent clotting factors.6,13
- Fluoroquinolones may increase INR by inhibiting warfarin metabolism, displacing warfarin from protein-binding sites, or disturbing intestinal flora that synthesizes vitamin K.7,13
- Isoniazid may increase INR by inhibiting warfarin’s metabolism.9,13
- Macrolides and metronidazole may increase INR by inhibiting warfarin’s metabolism.4,8,13
- Penicillin may increase bleeding risk by inhibiting platelet function.12,13
- Rifampin may decrease INR by inducing warfarin’s metabolism.10,13
- Sulfonamides may increase INR by inhibiting warfarin metabolism, displacing warfarin from protein-binding sites, or disturbing intestinal flora that synthesizes vitamin K.5,13
- Tetracyclines increase INR by an unknown mechanism, potentially inhibiting warfarin metabolism and plasma prothrombin activity.11,13
Conclusion: Blood clots are an extremely dangerous medical condition requiring a rapid response, blood thinning medication and constant monitoring by medical professionals. The patient’s role and responsibility in keeping their diet consistent, monitoring anti-biotic intake, taking blood-thinning medication on a timely basis, being regularly tested for their INR ranges, communicating with anti-coagulations pharmacists and subsequently adjusting their dosages is a tall order. Patients are required to be very organized in monitoring their own care. Clearly, those patients who lack organizational ability are at a disadvantage. Framing this problem as a positive feedback control system for INR values below 3.5 and as a negative feedback system for INR values greater than or equal to 3.5 makes sense. The only limitation is that there is currently no portable test for the INR and PTT measures akin to the blood-glucose monitors for diabetes patients that are available over the counter.
MMS • RSS
Article originally posted on InfoQ. Visit InfoQ
Transcript
Fong-Jones : Thank you so much for being here. I know that this is a late slot, so I’m going to be as punctual as I can be and as economical with my words. I’m Liz Fong Jones and I am indeed a Developer Advocate and a Site Reliability Engineer. I work at Honeycomb. But this talk is about lessons that I learned throughout my time as a site reliability engineer at Google, working across about 10 teams and working across many of our customers of Google Cloud. And things that I saw that made for really great experiences for the people that were on call looking after systems, and things I thought were kind of problems. So we’re going to go through a fictional case study today that explains how you can get from a team that’s dysfunctional to a team that’s working well. And of course, these slides are illustrated because an illustrated slide is worth 1,000 words. So make sure to give the artists props as well in doing this.
QCorp ‘bought’ DevOps – Fictional Case Study
A hypothetical corporation called QCorp bought DevOps. They went to a vendor who said, “Yes, we will sell you DevOps in a box.” And unfortunately, QCorp is finding that the results are not what they anticipated. Because they said, “Give us all of the alphabet soup. I want to order the alphabet soup.
Give me Kubernetes, because I want to orchestrate my containers. Wait a second, what is a container? Well, you know, we’ll have to figure that out.” Or “Let’s go ahead and deploy continuous testing. Let’s do continuous integration and deployment. Let’s set up Pedro duty. Let’s put all of our engineers on call. Hey, I heard that this full production ownership thing is a great thing. Let’s put all of the engineers on call and let’s go ahead and standardize everything and put it into code so that we have infrastructure as code. Great, right? Like we solved our problem.”
Well, not so fast I would argue. This isn’t working quite as we expected. For one, when we turned on the vendor monitoring solutions, we got walls, and walls, and walls of dashboards. The vendor sold us on, “Hey, we can monitor all of your existing infrastructure and you don’t have to write a single line of code. We’ll just do it for you.” But now I have a new problem. Which dashboard do I look at? How do I tell if something is wrong? And how do I tell all of these dashboards that are provided to me, and the dashboards that everyone who came before me thought were useful, how do I know which one of these to look at?
But it gets even worse because now I’ve put my engineers on call and they’re really, really grumpy because I haven’t done anything to address the noisy alerting problem. And my engineers are getting constantly woken up and they’re getting really unhappy both at the system, at me, and at each other.
And incidents are taking a long time to fix because of the fact that engineers don’t have the appropriate visibility into what’s going on in their systems. And while they’re sitting there trying to understand what’s going wrong, users are sitting there wondering “Why isn’t the app working?” And they’re getting even more unhappy.
The other problem that happens is that my senior sysadmins are the experts on how the system works. And everyone on the team winds up escalating issues to them when they can’t figure it out. And the system admins just say, “Oh, go run this command”. They’re not actually explaining to the people so they just have to keep coming back over, and over, and over again for more and more advice. And the experts thinking like I don’t have time to document this and write it down. Like “I’m just going to give you my answer and then hopefully get back to work”. But unfortunately, they never get back to work.
There’s also the problem that our deploys are unpredictable. That what we thought we were getting when we said that we were going to do continuous integration wound up not catching the problems that we were expecting that it would catch for us. All our builds were green, and we pushed out the code. But because of interactions between our microservices and our monolith, we wound up having the code not work in production, Q breakage, Q unhappy customers, Q rollbacks, and Q developers who are not happy to see their production code not actually running in production. And the team is constantly fighting fires still. All this tooling has, in fact, made their lives worse. They have a new set of things to learn, a new set of things to adapt, and yet they’re still getting paged all the time “Production’s on fire, users are unhappy”. And they feel like they’re juggling giant flaming bowls. That’s not a good state for a team to feel like they’re in.
And even when people do find a spare hour that they’re not being interrupted, they don’t know what to work on. They don’t know how can we get ourselves out of this mess? They’re lost in the woods without a map because all of these tool vendors have come in but none of them have offered any kind of advice on the strategy on where the team is going and how they should approach things.
So the team feels like they’re holding on the edge of a cliff. They’re struggling to hold on. And it’s true, they’re drowning in operational overload, and no amount of tooling is going to solve this problem. So I ask you, this is kind of rhetorical question, what should QCorp do next? Okay, my clicker has stopped working for some reason. So what should QCorp do next?
I think the problem here that we have to recognize is that QCorp has adopted a tools first approach instead of a people first approach. They’ve forgotten that people are the ones who operate systems and that we’re operating systems for people. We don’t operate services just because we think it would be funny. We don’t operate services in order to cause pain to each other. That’s not the right approach. So we have to really think and look back at the broader picture, the people. Our tools can’t perform magic for us. Our tools can make our lives easier if we have a plan, if we know what we’re going to do, the tools can help us achieve that faster. But if we don’t have the right culture, if we don’t know what we want the tools to do for us, then the tools are going to behave more like the drums in the movie Fantasia, they just multiply and grow out of control and create worse problems for you to mop up afterwards.
So what we need to do – and this is taking a leaf out of Randy Shoup’s playbook, he said upstairs a few minutes ago that culture trumps everything, that culture trumps technology. And that culture, bad culture can in fact, even overwhelm the best-intentioned people, the best-intentioned processes. So we have to look at all of these things but especially the culture and the people. And that’s how we’re going to get ourselves out of this situation.
Production Excellence
And this is where I think I want to introduce the word production excellence. I think that production excellence is both a set of skills that’s learnable, that anyone can work on, but especially that any organization can focus on improving. And that it’s a method to obtain better systems that are more sustainable, that are appropriately reliable and scalable, but also that don’t burn the humans out. And that’s what we need to be working towards, even before we think about choosing a single tool.
So our goal here is to make our systems much more reliable and friendly. It’s not okay to feed the machines, the gears of the machines, with the blood of human beings. You only have so many human beings and if you have vampire machines, they’re eventually going to cause all of your people to quit. And then your system won’t work at all. So that’s not a good place to be. But you don’t get production excellence by accident. You have to plan for it. You have to be really intentional. You need to figure out where are we? And take an honest look, don’t lie to yourself about it, right? Don’t say, “Oh, we’re going to score five on all these metrics, my team is perfectly safe. We are using all of the code in the appropriate ways.” No, you have to say, “You know what, I recognize I’m not measuring the things I should. Let’s start off by taking that first step, rather than jumping to running.”
We have to develop that roadmap and think about where are we going in order to accomplish the production excellence state of having services that are sustainable and reliable. We have to also think not just about short term results but instead about long term results. We have to act on what matters in the long term, not necessarily in the short term. Again, Randy said in his talk a few minutes ago that, if you run into this cycle where you feel you don’t have enough time to do the things right, so you shortcut them and generate technical debt, and then you’re even more out of time, we’re trying to get you out of that. But in order to get you out of that, you have to have air cover. You have to have people that are willing to stick up for taking the time to do things right in order to foster the long term health of the team.
And you can’t just approach this by yourself, even if you’re an executive. But most of us in this room aren’t executives, right? You can’t do this by yourself. Changing the culture of a team is an intentional effort that involves everyone on the team. And not just everyone on the immediate team, it also has to involve the people that are adjacent to your team. Most of us in the room here are engineers but when was the last time that you invited marketing to your meetings? When was the last time that you invited sales to your meetings? Your executives, finance? What about your customer support team or in the cases that you’re not already trying to support your infrastructure itself, do you meet with the people operating your service? Cultivating production excellence has to involve all of these stakeholders or else you’re going to have a really segmented effort that doesn’t actually deliver what people need to have their jobs be sustainable.
So we also have to think about on each team, how do we make people more successful? How can we build them up? And part of that involves thinking about how do we increase people’s confidence in their ability to touch production, in their ability to investigate things? And this involves, as Andrea said in her talk yesterday about psychological safety, this involves people feeling like they’re in that mode of thinking where they can take their time and think rather than instinctively reacting with fight-or-flight reactions. And you have to make sure that people feel safe to ask questions, and that people feel safe to try things out and potentially fail. If you remember Sarah’s [Wells] keynote from yesterday, Sarah was telling the story of the product developers being too afraid to touch production and restart the MySQL database for 20 minutes because they didn’t know what was going to happen. An outage was continuing that whole time, right? We have to be safe to take risks in order to have production excellence.
How do we get started here? What’s the first thing that I should do? Well, I’m going to tell you today the four things that you need to do in order to get started. They’re not necessarily in any particular priority order but this just seemed to be the logical way to introduce them to you. The reason that we’re here operating our services is that we need to know when our service is too broken. And when they are too broken, can we figure out what’s gone wrong with them? And can we work with other people? Remember, these are microservices, they span multiple teams generally. Can we work together and debug together when things are too broken?
And once we’ve resolved the immediate crisis, not just are we patching things and restoring things to a shoddy state, but instead are we able to eliminate the complexity? Are we able to get things to a more mature state in the longer term such that people can have a smoother experience, that people can not spend their time fixing the same bugs or patching them over, and over again?
Our systems, I would argue, are always failing. When you look at your lawn, do you look and say that individual great blade of grass is brown, therefore, I need to throw out the whole lawn? Do you try and make sure every single blade of grass in your lawn is green? No, you don’t do that. We’re much more interested in the aggregate state of affairs than we are in any one particular small failure that doesn’t impact the end user experience. If your kids can play on it, if your dog can play on it, it’s probably a perfectly fine lawn.
Service Level Indicators and Service Level Objectives
That means that we need to take a different approach and instead of trying to make everything perfect 100% of the time, we want to measure that concept I talked about earlier of are things too broken? So that’s where Service Level Indicators come into play. Service Level Indicators and Service Level Objectives, their close cousin, are how we measure whether our quality of service is good enough, aka not too broken. So we have to think in terms of every event that happens in our system in its context to evaluate are things in a good state or not?
And we have to have not just humans looking at every single user transaction to figure out did it make the users happy? But instead, we need to be able to teach machines to evaluate this for us, to tell us is this good enough or not? So one way of doing this is to figure out what makes users grumpy? What would cause a user to be unhappy? What would damage your company’s bottom line? This is where collaborating with people can help. Ask your product manager. Your product manager probably has a pretty good idea of what users will and won’t tolerate. What really delights users? Those are questions that a product manager is definitely well-equipped to answer. So one possible approach to this if you have a request-response service is to look at did the request return an error or was it a success? Did it return quickly enough?
And as long as both of those things are true, then that is probably a good event that satisfied the user on the other end. Or maybe this is a batch request. I was particularly fascinated by Collins’ talk earlier in this track, where he talked about the fact that we don’t only have request-response services, we have to be able to understand and examine the reliability of batch processes. For instance, are we sending out people’s credit card bills on time? Are we in fact, deleting users’ data when we’re supposed to? This is super important because of GDPR, right? So we need to look at things like is this row of data fresher than 24 hours? If so, that’s a good row of data because we know that we’ve done what we are supposed to do every single day. And if not, then that row of data gets marked as bad, that it counts as an error that we may need to investigate.
So the bottom line for both request-response based and for batch jobs is that we have to think about what threshold buckets these events? What are the discrete events that we’re tracking and what lets us sort them into good or bad? Once we have that, that enables us to do some pretty nice things. For instance, we can also think about what’s the denominator, right? Like how many total eligible events were there? There might be a condition where, for instance, if you get attacked by a botnet and you send it a flood of 403, do those requests count as good? Do they count as bad? I argue they’re not even eligible. They’re not in scope. This is not user traffic. So you need to exclude the events that you don’t think matter to your end users from your calculations.
Once you have this, then we can compute the availability. You can compute the percentage of good events divided by that number of eligible events. And we can set a target on it. We can set a target service level objective that aggregates all of this data over a period of time. So we need the window, for instance, a month, two months, three months, and the target percentage that we’re trying to reach. Why do I say a month to three months and not say a day? The reason is that if you reset that target every single day, you’re ignoring the fact that users and customers have memories and you can’t say I was 100% down yesterday, but I’m 100% available today. Therefore, I’m going to ignore your complaints. People care about your quality of service measured over months or years.
So for instance, I might pick a service level objective that says that 99.9% of my events will be good measured over the past 30 days using the definition of good from earlier that they have to HTTP 200 served in less than 300 milliseconds of latency. So that’s one example surface level objective. But yours may or may not look like that. The important thing about what your SLOs should look like is that a good SLO barely keeps users happy. That should be enough that if a user encounters an error instead of saying, “Oh, my goodness. Google’s always down,” they say, “Oh, well, I guess I’m going to press refresh”. If someone says “Meh” when they see an error that’s probably about the right threshold too, to set your availability target for.
How Can You Use Service Level Objectives?
And you can use SLOs for two things. First of all, you can use SLOs to drive alerting but secondly, which I’ll get to later, you can use SLOs to drive your business decision-making.
Let’s talk about the first case of how we drive our alerting with SLOs and how we clean up this problem of everything alerting us all the time. Now that we’ve decided what good means and what makes users happy, instead of looking at our individual hard disks filling up on an individual machine, we can look at the trend in our service level indicators. We can ask questions like are things running in a bad direction? Is my service on fire and requiring my immediate intervention? And we can quantify that using math. So the way that we do that is that we set our error budget to be one minus our service level objective. If my service level objective says 99.9% of events must succeed, and I have a million events in the past month, that means that mathematically, a thousand events out of my million are allowed to be bad. And I can use that as a budget. I can be thoughtful about how I spend it and if it looks like I’m going to run out of budget or run out of money, kind of using a more mundane analogy, then I might want to do something about it.
And I can compute things like how long has it been until I run out? Or is the money flying out of my bank account, or is it just like a slow drip? And based on that I can decide, I don’t have to make everything an emergency. And if it’s urgent and I’m going to run out within hours, then maybe I need to wake someone up and they need to fix the problem right away. But if I’m not going to run out of error budget for days, maybe it can wait in line and someone can look at it during the next working day. And this, as I said earlier, lets us make data-driven business decisions. And this is really cool to see this featured in Sarah’s talk, featuring Cherrie, my boss, that this lets us make a trade-off. This lets us set a budget of how much error are we allowed to have and spend it either on increased velocity or in the natural errors that happen inside of our systems.
For instance, I can ask questions now and get definitive answers. Is it safe to push this risky experiment? Well, maybe if you use a flag flip, so you can revert it fast enough and you’re doing it on a small enough percentage of users. We can figure out what the maximum fallout would be and say you know what, that’s tolerable within our budget, we’ve got plenty left to spend. Or we can ask questions like, do I need to stand up a second or third region in my cloud provider? Do I need to go multi-region right now? Well, maybe the answer is yes, if you’re bleeding our budget, and it’s because of your underlying provider. But maybe the answer is no, if you have enough reliability for now.
I’m talking about this abstract SLO concept and some of you may be saying, “Okay, let’s try to get it right.” But I’d argue here that you can’t act on what you don’t measure. So start by measuring something, anything. If you have a load balancer, take the logs from that, use that to drive your service level objective. You don’t have to get super fancy, you don’t have to come right out of the gate and expect to be like the “Financial Times” with synthetic user monitoring and all of these awesome things that they built.
Just start with the basics and then iterate over time. You’ll get most of the benefits early on. And if you see problems, well, then you can, in fact, iterate from there. You can, in fact, say I had an outage that was not caught by my SLO. Let’s change the monitoring of how we measure the SLI. Or you might even have situations in which it’s not the measurement that’s wrong but instead, it’s the overarching nature of your service level objective that’s not meeting user needs. For instance, if users expect to see four nines and your SLO is three nines, you probably have a lot of rearchitecting you need to do in order to make them happy. And you can, in fact, creep that service level objective upwards over the span of multiple months, rather than alerting yourself every time you do not meet four nines. Or if you have a significant outage and users don’t complain, maybe that’s a sign that your service level objective is set too high and you can relax your SLO.
Settling on an SLO is never a one-and-done process. You have to iterate on it to meet your users’ needs. So check in maybe every three months, maybe every six months, with your product managers and with the business and figure out what’s the right thing to make our users happy. And this, when you implement it, means that your product developers will finally sleep through the night because they’re no longer being woken up by random alerts that the hard disk is full, or one server is seeing an anomalously high error rate. But SLIs and SLOs, I would say are only half of the picture because SLIs and SLOs will tell you when something’s wrong, but they won’t tell you how to fix it or how to mitigate it.
Complex Systems Failures
So you need to think about how do we understand complex systems failures? And the one thing that I’ve realized is that outages and complex systems are never the same. They may rhyme but they’re not identical and you can’t take the same thing that you’ve used to solve this outage last week and apply it to today. Every outage is unique.
That means that we also can’t predict what is going to fail. We may have some good ideas but those good ideas will only take us so far. It doesn’t make sense to focus on the tiny bugs with a magnifying glass in front of us and then realize that there’s a giant bug behind me. Oh, no. So we have to instead think about the more general cases. How do we make our systems easier to understand without pre-supposing how they’re going to fail? If you have N services that are all talking to each other, that’s N squared possible failure modes. You can’t possibly instrument each of these N squared cases. I would argue don’t bother trying to do that. So we have to make sure that our engineers are empowered to debug novel cases in production. In production is super important.
Staging is a useful tool sometimes, for instance, for trying out new things that you are never intending to deploy. But all of our users’ pain comes from our actual production environments. So if you can’t understand what’s going on with the user in production, you’re going to have a lot harder time reproducing that bug in your staging environment. This means that we need to collect a lot of data about the internal state of our system that our systems are reporting back to us, and we also have to feel like we can explore that data without being constrained by what we originally thought we are going to need to ask from that data.
And all of this boils down to the statement that our services have to be observable. And I am going to use Colin’s correct definition of observability, which is that it’s information that our system provides to us in order to help us understand the inner state. The system is not observable if you have to push new code out to production or refactor your database schema to answer a question that you have about the inner workings of your service.
Can we explain events in context? We’re collecting these individual events due to our service level indicators, but can we actually understand the full execution path? Do we understand why that individual RPC returned failure? Where in the 10 deep stack did it go wrong? And can we explain what’s different between the ones that failed and the ones that succeeded? And this is something that I borrowed from Ben’s talk yesterday as well, which is that we have to think about explaining the variants, explaining the differences in order to form hypotheses about what has gone wrong so we can go fix it. But even better than fixing it right now, maybe we need to think about how we mitigate our impacts.
Going to the talk from Edith earlier today about why do we do feature flagging, the answer to why we do feature flagging and rollbacks is that feature flagging and rollbacks let us mitigate the impact right away. Roll back whatever is problematic and then debug later. A well-designed automated system that has an appropriate reliability and observability, it will fail, it will correct itself, and someone the next business day can look at the telemetry and figure out what went wrong. You no longer even have to wake people up at night in a system that is appropriately designed to be self-healing.
So SLOs and observability work really well together. You need one in order to tell you when things are wrong and you need the other to debug. But I think just focusing on those two isn’t enough to achieve production excellence. Here’s why: they don’t give you collaboration. They don’t give you the changes to your culture to support people in working together and developing those skills, in working together to analyze incidents.
Debugging doesn’t happen alone. As I said at the start of the talk, when you work in a microservice environment, when you work in a full ownership environment, your team has dependencies upon other services. And your team has other services, other teams depending upon it. So even if your outage is so small that only one person has to be debugging your own service, you have to work with other people to solve it. And we also have to think about all the various roles of the people that are involved in collaborating to debug an outage. The customer support team needs to know what’s going on. The customer support team might even, if you have the right tools, be able to look at production themselves and solve or understand the customer’s problem without even escalating it.
Debugging is for everyone. And the way that we get there is by encouraging people to cultivate the skill of debugging and giving them access to these tools instead of withholding them and hoarding them to ourselves. Debugging works a lot better when we all work together and put our brains together, right? We get better ideas about what may possibly be going wrong and what we can do to fix it.
And it’s also an interpersonal skill. If you have teams that are not getting along with each other, do you think that they’re going to have an easy time during an outage working together to solve it? Probably not. If you have finger-pointing, it makes solving outages a lot harder. People don’t admit, “Hey, my service had a hiccup”. We have to be able to work together both when things are calm as well as under pressure. And this goes back to Andrea’s point again about psychological safety, and about type one versus type two thinking and also about growth versus growth mindsets, thinking that we can learn the skills that we need to learn rather than assuming that everyone has a fixed set of skills that they have.
We also have to think about the sustainability of our operations and not burn people out. Many of us here work in the EU. There is the working time directive, and it says that you have to structure your business so you are not relying on waking up people at all hours, that there are limits to how much you can put people on call. Even if you were to pay them extra, the EU doesn’t let you put them on call past a certain amount. And it turns out that giving people flexibility with regard to their involvement in production is a really powerful tool because what that enables you to do is that enables you as a busy manager to not have on call during the day.
How often have you been a manager and had a meeting interrupted by a page? It sucks, right? Like you’re having a one-on-one and then you get paged. That’s a really awful experience for you and the person you’re having a one-on-one with. So trade places, take the nighttime on call away from the person who has a small child, take the nighttime on call for yourself and give your daytime on calls to the person with a small child. Flexibility lets us do a better job of not burning out.
And it’s not just on call, there’s ticket load of responding to non-urgent events. There’s doing customer support work of responding to customer queries. There’s a lot of things that are production involvement but not necessarily on call. I think it’s important for everyone to be involved in production to a degree but I don’t think it has to look like on call. And not all on call has to look like 7 days a week, 168 hours straight at a time. At the end of the day, if you don’t sleep, you can’t be creative and creativity is essential to engineering. So we also have to think about documentation as part of our collaborative process, that we have to leave ourselves cookies, not traps. That’s a quote from Tanya Riley, I encourage you to look at her talks.
When you write down the right amount and keep it organized, it can help your team. But don’t brain dump. Don’t brain dump things that are going to become out of date. If you commit to writing down documentation, commit to maintaining it as well. And that will enable you to fix your hero culture. If people are sharing knowledge, that means that you no longer have that one person who’s acting as the bottleneck. You no longer have that one person burning themselves out because they keep on getting pure bonuses and praise whenever they take one for the team.
So share that knowledge, fix your hero culture, and really don’t over-laud people for solving the problem themselves, or shame people when they have to ask for help and escalate. And that goes to the point of rewarding curiosity and teamwork. We have to make sure that people want to ask questions and understand how the service works. We have to have the growth mindset, and we have to practice. We have to give people opportunities to exercise their curiosity to work together with others in terms of game days or wheels of misfortune in order to make sure that people are exercising these skills before it’s a real incident.
And we also have to make sure that we’re not repeating the same problems over and over again. We have to learn from the past and reward our future selves. So outages don’t repeat, as I said earlier, but they definitely rhyme. We can identify the common patterns and see what we can do to mitigate those failure modes.
Risk Analysis
And risk analysis, a real structured risk analysis, done with type two thinking rather than type one thinking, done by deliberately thinking about it rather than letting our gut guide us, lets us really decide what’s important to fix right now. For instance, if you have a bridge and maybe the depth of the bridge is letting cars fall through. You know, maybe an earthquake is going to come in 30 years that might cause the columns to collapse but not right now. Maybe you should think about what is urgent to fix right now and what can I plan to fix later if it becomes important enough?
We have to quantify our risks by frequency and impact. How often do they happen? And sometimes we don’t have a lot of control over that. So that’s sometimes known as the time between failures. Well, we have to also think about what percentage of users do they affect? Because sometimes you can control it. If you only push code to 1% of your servers at a time, that means that potentially you’re only impacting 1% of users at a time rather than 100%. You have control over blast radius. You also have some degree of control over how long does it take to detect failures, and how long does it take in order to restore service? Instead of deep diving to try to understand what’s going on in the moment, can we do a quick mitigation like draining a data center? Maybe that’s the right thing to do to reduce the impact and severity of an outage.
Once we figure out which risks are the most significant, that’s the point at which we can prioritize our engineering work. We can figure out what do we need to work on today, and what can we put off till until later? And fundamentally, the SLO here is, again, useful because we can address the primary risks that threaten the SLO. If you multiply that out and you say, you know what, I’m going to get 500 bad events out of every single month when my error budget is 1,000 bad events, that sounds like something that’s worth fixing because if that happens more than twice in a month, you’re going to have a problem, right? So that lets us prioritize where we make our improvements. And that also gives you really excellent data for the business case to fix them. Because if we agreed that the right threshold for a service level objective was 99.9%, or say 1,000 bad events per month, then that lets us go back and say this is going to significantly increase the risk of us exceeding that threshold. We need to stop working on new features in order to fix this bug.
But you need to actually complete the work. It doesn’t do anyone any good if you write a beautiful post mortem, and you put the action items on a board somewhere, and they never get dealt with. So actually make sure that you do the work. But I think that we also have to think about the broader cultural risks. We have to think about the broader picture of what can contribute to us exceeding our error budget. And I think that a lack of observability is fundamentally a systemic risk. If you can’t understand what’s happening inside of your systems, that’s going to magnify your time to recover. It’s going to dramatically magnify your time to recover. So we have to think about, as our systems become more complex, how do we tame that complexity by making them more observable. And if not, you’re going to have a situation of operational overload and you’re going to have a situation of unhappy customers.
I also think that lack of collaboration is a systemic risk. If your engineers cannot work together with each other, and with support, and with every single other department of your organization, outages are going to last longer, or people are not going to find out about outages, that time to detect. If you have a lack of collaboration between your support team and your engineering team, because every time the support team reports an issue to engineering, they get told, “Oh, that’s a problem between keyboard and chair. Why did you even bother us with this silly thing,” they’re going to not report a real incident.
Conclusion
Collaboration really matters and does have an impact on your bottom line and the happiness of your users. So I argue that in addition to buying the alphabet soup, you also need to season the alphabet soup with production excellence. But together, we can bring our teams closer together and tame the complexity of our distributed systems by using production excellence, by measuring “Are we achieving a high enough reliability?” Debugging, when that reliability is at risk. Collaborating together, both on debugging and on identifying problems, and figuring out, what are we going to fix? What is the right thing to fix that’s in the critical path rather than wasting our time on things that are not going to meaningfully impact the happiness of the humans running the system or the happiness of the humans using the system? That’s all that I have. Thank you.
Questions and Answers
Fong-Jones: There’s one question back there. Also, while he’s running the microphone over, Charity and I will both be right in front of the podium after this talk. So if you want some stickers, if you want to chat about this, I know that asking public questions is not everyone’s jam. Please don’t be shy and talk to us privately afterwards.
Participant 1: You talked in particular, you noted at one point saying about disks filling up. The system we’re building at the moment we’re taking the approach that you suggest using SLIs and SLOs to base our alerting. But I have to say that disks filling up terrifies me because the SLOs are a trailing indicator of the problem. We don’t have a leading indicator of the disks filling up and our whole system exploding. Is that a problem or can you base SLOs on leading indicators of problems like that?
Fong-Jones: Yes, I think that there are two answers to this. First of all, that if you have a predictable leading indicator, for instance, if your disks are filling up at a rate that will lead to exhaustion within a certain amount of time which you know always is correlated with your system crashing, sure. Go ahead and set up an alert on it in the short term. But keep a close eye on the operational load that generates. We had a rule when I was working at a large cloud company that you are not allowed to have more than two incidents per shift, because you could really only investigate and fix thoroughly two incidents per shift.
So if that starts eating into your budget and causing too many people to get woken up all the time, maybe fix it and come up with a better solution. Which leads to my part two, which is maybe your systems should be resilient to disks filling up. Maybe if a disk fills up, you just restart that individual VM rather than allow data to accumulate on the disks that is no longer being backed up or stored because we’re out of room, right? It’s always easier to clean up an old replica and start a new replica than it is to try to clean up a disk that’s been filled up.
One question down here in the front. And I think there will be time for one more question after that. And you can definitely find Charity or me in front afterwards.
Participant 2: First of all, thanks a lot. Great talk. Speaking about production excellence and speaking about collaboration, does it require pair programming or it’s optional?
Fong-Jones: I do not think it’s specifically requires pair programming. What it does require is that during an outage, people feel comfortable working with each other. For instance, looking over each other’s shoulders, sending graphs back and forth, like bouncing ideas off of each other. Whether you do pair programming, whether you do code reviews, those are all good software development practices, but I don’t think they have a direct bearing on operations necessarily.
Well, we’ll be down there and I so appreciate that so many of you will turn out for a culture talk in the last slot of the day, so thank you again.
See more presentations with transcripts
MMS • RSS
Article originally posted on InfoQ. Visit InfoQ
Transcript
Wells: I’m going to talk today about microservice to architectures, about why we’ve adopted them at the “Financial Times,” the impact it’s had on the way we work, and the things we’ve learned about how to operate them that make it, that are basically essential to building it if you’re going to do it successfully. And we’ve got five years experience of building microservices. I think I worked on the first system at the FT that was built using microservices, which was the content platform, [inaudible 00:00:29] and publishing platform, and I was the principal engineer on that. But we now use it pretty much everywhere.
Things That Can Go Wrong When You’re Operating Microservices
I want to start by just talking about some of the things that can go wrong when you’re operating microservices. In December last year, we got reports that a lot of people were visiting the FT and seeing the sorry page, so 404. And we thought, “Oh, this isn’t good.” So we started looking into it. And very quickly we realized that the problem was with one of the redirects that we’d set up. And we have a lot of redirects on ft.com. And that’s because we have a particular format for our pages. So you have pages that are streams of articles.
We have stream pages that basically have ask us all a particular topic, and they have a particular UUID for the topic, but this isn’t very friendly. It’s not easy to remember this. So you need to have something that’s a bit more memorable which is we normally set up a vanity that is much more easy to remember. All this is managed by a URL management tool which is the microservice that we wrote. But the problem was that we had set up a redirect to a page that didn’t exist.
And what was worse was the page that it came from had many redirects going to it as well. And what that meant was people were being funneled into our 404 page. So we started thinking, “Oh, we need to fix it.” And we started looking into how we would fix the data via our URL management tool, but it turns out that we actually couldn’t work out how to do that. We tried a few things, we got errors. It just wasn’t working. And then we realized, “Oh, we’re going to maybe do a restore from backup,” and found out that, we had some very experienced developers working on this, none of them knew how to do a restore from backup on this tool because no one had touched it in two years. We weren’t even sure how we did the backup. And the interesting thing that then came up is once you’re not very sure about things, you become very hesitant. So someone suggested an approach which turned out to be the thing that fixed it, but it took us 20 minutes to get to the point of deciding that we were confident that this was the right way to approach it.
So we did get this fixed, but we really realized that when you have a microservice, it’s quite possible that you haven’t touched it for several years. No one helping us with this instant had any idea how it worked. And when that happens, you’re really relying on two things. Does the monitoring tell you there’s a problem and does the documentation give you what you need? Monitoring told us, basically, that we had a problem, but our documentation didn’t include anything about restoring from backup.
The interesting thing is with microservices, you quite easily have a polyglot architecture. You can use lots of different data stores, different programming languages, and that’s great. But what it means is when you need to work out exactly how this data still gets backed up, you may have a problem. The interesting thing about this particular issue is we were able to identify very quickly which microservice was involved. That’s not my experience. Normally when things go wrong, even working out where the problem is, is a big part of solving the problem.
So another issue we had, we got told that editors were publishing updates to the lists on our homepage. This is a very important part of the “Financial Times” site because it’s how people find the news, it’s how we break new stories, and they weren’t getting updated. And between the editor clicking a button to say, “I’m publishing the list,” and it appearing on the website, there’s probably 10 or more microservices. So our first problem is, where is the problem? What’s going wrong here? Luckily, we had some monitoring. We were able to see, this is monitoring an API endpoint. We were able to see that the problem was with one of our content API’s. So at least we knew which team to do it, because there were three different teams involved in this. You can see that we were starting to get increased latency errors. So we started looking at this. And this happened at 5:45. You’re just thinking about going home and then suddenly everything is wrong and you have to stay. And we quickly realized the problem was that our graph database, Neo4j, was using a lot of CPU, and we were running our microservices in containers, on a cluster, and we didn’t have a lot of limits on CPU memory so it was basically starving everything off resources. It wasn’t just the List API that was broken.
We worked quite hard and we managed to find a mitigation for this, but we still didn’t really understand what the problem was. It took 24 hours for us to work out what had gone wrong. And this graph, and that’s not easy to read, but it’s basically showing that there were a couple of 503s, 504s, maybe 10 in the space of 15 minutes. What we’d managed to do was an update to the graph that had caused certain queries to be incredibly inefficient and brought down our entire cluster. And the thing about a graph database is, it’s not a schema update, is just loading data. So even though we knew that we’d made some changes, we actually didn’t know what the impact was that that would have. Microservice architectures are more complicated to operate and maintain than a monolith. So why bother doing them? I mean, if they’re more difficult, why not just stick with the monolith? And the answer for that is, business reasons. And actually, all of your technical decisions really should come down to business reasons. And to do that, I need to tell you a little bit about the business of “Financial Times.”
The Business of “Financial Times”
This is the picture I took of our paper being printed at our print site in Bo. But nowadays, we don’t describe ourselves as a newspaper. We describe ourselves as one of the world’s leading business and financial news organizations, and that’s because most people don’t read the FT on print, they read it online, on the phone, on a tablet, on computer. We have a paywall, and that’s where we make most of our money. If you know anything about print advertising or digital advertising, you realize this is a good thing because both of them are tanking. So news isn’t an interesting place right now. Local news organizations are really struggling and any news organization that doesn’t have a paywall is starting to think, “How do I actually make money?” What’s clear is that in the near future it’s going to be really important for us to be able to experiment and try things out and see what’s going to work for us.
And I saw a really interesting talk from Linda Rising last year that said, “It isn’t an experiment if there’s no hypothesis and if you can’t fail.” What she said is the experiment for most organizations actually just means try. They’re going to try something out. And this is because if an organization invests quite a bit of money in a product or feature, it is really unlikely that they’re going to decide that it wasn’t worth doing and get rid of it. And the only way you get a culture of experimentation is if you basically can do experiments quickly and cheaply, because then you have a chance that someone will say, “This is what constitutes success,” and you’ll be able to say, “Oh, we didn’t meet it, we’re not going to roll it out.”
A/B testing is built into ft.com and we do hundreds of experiments a year. And we start by saying, “What are we measuring? And what would be the criteria for its success?” And there are plenty of things that don’t go live because we’ve decided that they didn’t give us enough benefit. We have this A/B testing built in, but you still need to release code to do any kind of tests. To show the blurb on the right and not on the left, you need to have some conditional statement in your code. So we need to be able to release code. We need to be able to do it very quickly. And we do, we release code to ft.com thousands of times a year. And this means that we do have a culture of experimentation. But releasing changes that frequently doesn’t just happen. You have to do a lot of work and it had a massive impact on the way we work and culture of our company. Microservices has been a thing that has enabled it for us, a combination of continuous delivery in microservices and DevOps. Together, they’ve been the foundation for being able to release things quickly. What they mean, though, is that the team that builds the system has to operate it too.
If it took the developers who built the List API 24 hours to work out what went wrong, there’s no chance that some other team is going to be able to do that more quickly. So you have to operate it. But we’ve now been doing microservices for five years, so teams are starting to get smaller, they’re moving on to new projects. The people who currently work on the website or on the content platform aren’t the same people who made a lot of these decisions. What do you do when teams move on? How do you make sure that systems don’t become unmaintained, unloved and risky? Because your next legacy system is going to be made of microservices not a monolith. And the one thing we know about every bit of software is eventually it becomes legacy.
I’m going to talk about three things. I’m going to talk about optimizing for speed, why we’ve done it, how we’ve done it, then the things that we’ve found essential to build in to operate microservices, and finally some of the ways we’re attempting to make sure that when people move on we still have systems that work.
Optimizing for Speed
Optimizing for speed. I’ve just said it’s really essential for us because it’s part of the ability to let us experiment. And this is what we’ve believed for quite a long time. I was really happy when this book came out, “Accelerate” Nicole Forsgren, Jez Humble, Gene Kim. If you haven’t read it you really ought to, I expect it’s going to get mentioned in a lot of talks at QCon this year. And it is about how you build high-performing software development organizations. And high-performing software development organizations have an impact on organization performance. So effectively they can increase the market share, the productivity, the profitability of an organization. And there is evidence for this. They’ve done surveys, done a lot of research. What they found is that there are four measures that are strongly correlated together and correlated with high-performing teams, the ones who have the most impact on the business.
The first one is about delivery lead time. How long does it take you to get from committing code to getting it live? And often when we talk about cycle time, we talk about from idea to life, but there’s a lot of variability in that. Actually, what the “Accelerate” authors found is that commit to live gives you a very good accurate measure of performance. And generally, high-performers do it in less than an hour. That is going through the whole build and deployment cycle. So you can’t be waiting for someone to sign it off in a staging environment if you’re going to do it in an hour.
Second measure, deployment frequency. And really, this is a proxy for batch size because if you’re deploying things frequently, you’re doing things in small batches. So the hypothesis is if it’s small, it’s going to be easy to understand. On Demand. You’re not waiting to release once a week, once a month. You’re just doing it when it’s ready.
The third one is time to restore service. Is all of this moving fast? Aren’t you just leaving you something that’s really unstable? How quickly can you restore service if something goes wrong? Generally, again, less than one hour. And actually, that’s linked because often you’re restoring service by putting things through the same pipeline as when you release new features.
And finally, change fail rate. Are you basically compromising on quality to move this quickly? Well, high-performing organizations do changes with a failure rate of 0% to 15%. By contrast, low and medium-performance organizations have up to a 45% failure rate, which is pretty shocking actually to release that often and have to actually do a pact to move it afterwards. So what this tells me is that high-performing organizations release changes frequently, they’re small changes, they fix things quickly, and they have a low change fail rate.
Continuous Delivery Is the Foundation
Continuous delivery is the foundation of this. The thing I take from the “Continuous Delivery” book, Jez Humble, David Farley, is if it hurts, do it more frequently. Basically, the whole point of continuous delivery is releases used to be really painful. And as an example, our old build and deployment process was very manual. We could only release maximum of 12 times a year because we had to freeze the website and we couldn’t publish new stories while we were doing a release, so we had to negotiate with the editorial department to say, “Can you stop publishing news for a bit?” So we do it on a Saturday once a month. And it was a manual process. This is an extract from an Excel spreadsheet where it was all documented. This just shows 6 lines out of 54. They were never correct because you clearly aren’t going to have 54 lines in a spreadsheet without some kind of typo, and they often went wrong. This was really painful for us, so we totally went, “Oh, yes. This is painful. We should fix it.” and we adopted continuous delivery.
Also, you can’t experiment when you’re only doing 12 releases a year, because by the time you get feedback, you do some changes, you put it out, it’s six weeks before you even find out whether it’s a tool worth doing. And even then it’s difficult because maybe you’ve put so many changes together, you can’t tell the impact of one thing or another.
So we went to continuous delivery, and the first thing we did, automated build and release pipeline. It needs to be basic source code, it needs to be version controlled. You need to able to recreate your pipeline from scratch, if you have to. And effectively, your aim is to make it so incredibly easy to release code that anyone can do it at any time. In our previous process, people were scared to do releases. Now, no one at FT is scared to do a release. It doesn’t mean you don’t evaluate the risk. We don’t necessarily release code at 5:00 on Friday. We probably won’t do a lot of releases on a day where there’s a Brexit vote happening because we really want to be aware of our risk, but you know that the release is going to work and you know that you can fail back to the previous version easily if it goes wrong, and that is not something we used to have.
The second thing is you can’t stop to do manual regression testing if you want to move fast. It just takes too long. You can’t regression test against your entire system, so you need automated testing built into the pipeline. And when you do do manual testing, you need to target it so that it’s focused on the change you’ve just made. So keep that scope really local to that change. It should be fairly independent.
And finally, continuous integration. And I think this is the thing where people sometimes miss with continuous deployment. You need to be putting changes out regularly. It’s good to have an automated pipeline, but if you’re still only releasing once a week, you’re not benefiting from it. And continuous integration means that your master branch is always really simple and you release from it. Now, we use GitHub so it kind of pushes you towards branching and pull requests, but we don’t let them live for very long. A branch is there for less than a day and then it is merged. And I think if you aren’t releasing multiple times a day, you need to work out what’s stopping you and you need to decide whether it’s worth adopting a microservice architecture, because, it’s going to cost you, so you need to make sure you get what you need.
Often, the architecture is the thing that’s stopping you. For us, the 12 releases a year were because we couldn’t do zero downtime deployments. We had a SQL database that had schema changes, it could take quite a long time to do it. So from the beginning our new systems were built for zero downtime deployments. That was mostly done through sequential deployment. So we’d have multiple instances and we will deploy to each of them in turn. We also tended to move to schema-less databases. So in microservices you can have a lot of different data stores, most of ours are now schema-less, document stores, graph databases. And that tends to mean that you don’t have to stop and do some big upgrades. And if we do, we can fail over to a region, upgrade the other region and fail back.
The great benefit of zero downtime releases is that in-hours releases becomes the normal thing that you do. And when something goes wrong, anyone that you need to help you is going to be there. If you want to move fast, you need to be able to test and deploy your changes independently. You don’t want to have to rely on anyone else. So what this means is you can’t have to wait for another team to do some code changes and you can’t queue up for an integration testing environment. You need to be able to control your own release cycle otherwise you get slowed down. And what that means, and this is borne out by the research in “Accelerate” is that your systems and your teams needs to be loosely coupled. And “Accelerate,” they sort of talk about architecture, and they say, “It actually doesn’t really matter what your architectures are as long as they are loosely coupled.” So for us, microservices are loosely coupled. You can keep your monolith loosely coupled. It’s much harder work because it’s much easier to get things dependent on each other without you realizing.
“Process Theater”
It isn’t enough to change your architecture and to build a continuous delivery pipeline. You need to look at your other processes as well. When I joined FT, we had a change approval board, and you would go to the board on a Tuesday to release to test on a Thursday, for example. And we also created change requests. We’d fill out a form to say, “We’re going to do this change.” And you’d have to get someone senior to say, “Yep, I have approved these changes.” I mean, clearly, that’s not actually valid because you’re putting four weeks’ worth of work out, no one is going to have reviewed every single part of that. So it’s really about process theater. It’s theater because it’s pretending to be making things less risky, but really, it’s not. It’s not having that impact.
And you can remove this stuff. So change approval boards don’t reduce the risk of failure. There’s research in “Accelerate” on this which says that they actually have no impact on the change failure rate, but what they do is slow down everything else. Your change failure rate is similar, but you deploy less frequency, it takes longer, less frequently. It takes you longer to fix stuff and generally you tend to do bigger releases. So it’s not a good thing and we don’t have change approval boards anymore. Our theory is, if you’re doing small changes, the best person to make the decision about whether this change should go, is the person who just made that development change. And if you’re filling out a form for every change and you’re doing 10 releases a day, that just takes too long. It can double the time for you to do a release. So we’ve change this process as well. We rely on the peer review, the pull request, as the approval, and we just log that we’ve made a change. So we call an API to say, “We released this system. This git commit, this person.” And that’s all we need, the ability to go, “What has changed when something goes wrong?”
Speed and Benefits
How fast are we moving at the FT? Well, this is from the content delivery platform, so this is just one group within the FT. In 2017 we did 2,500 releases and it works out about 10 releases per working day. And just for fun I created an equivalent scale graph for the monolith. And then it does have data on it. We’re releasing about 250 times as often which is a massive difference. But what about the failure rate? Are we seeing a difference in the change failure rate? Well, our changes are small, which means they’re easy to understand. They’re independent, so the blast radius is greatly reduced. When something does go wrong it tends to be only affecting a small part of our website, a small part of our API’s. And they’re easy to reverse because we’ve got this automated pipeline.
When we did 12 releases a year, one or two of them would fail and when they failed they were incredibly painful. It’s about a 16% failure rate. I’m pretty confident in 2017 we had less than 25 releases fail. So that’s less than 1% failure rate. And the kinds of failures we got were much less significant because when you fail with one of those big bang releases, you’ve lost any chance of trying any of the new functionality. You have to roll the whole thing back.
The Cost of Operating Microservices
So that was about speed and the benefits, but there is a cost and operating microservices is harder. They are an efficient device for transforming business problems into distributed transaction problems. This is actually quite an old tweet now, but I think it’s just totally true. Everything’s over network traffic now and things are unreliable. And all your transactions being distributed means that things can partially fail or partially succeed. You’re hoping for eventual consistency, but quite often you end up with just inconsistency that you have to fix up somehow. But luckily there are patterns and approaches that can help.
I think DevOps is a good thing to do regardless of your architecture because you want your team to all have the same goal. You want all your teams to be focused on the value you can give your customers. If you have separate development operations, you’ve got one team that wants to keep things stable and one team that wants to get changes out there. So DevOps is great, but you absolutely have to do it for microservices. The example I have with the lists earlier, that team had to be the one that did the investigation. And you can’t hand things off to another team if they’re changing multiple times a day. This is that whole thing where you’re basically depending on – as soon as you are coupled to another team, you slow down.
Decisions about Tools and Technology
High-performing teams get to make their own decisions about tools and technology. And there’s two things behind that. The first thing is, actually, empowering your teams makes people happy. That’s not a bad thing. But the second thing about it is it speeds you up again. You can’t be waiting for the result of an architecture review board to decide what queue it is that you’re going to use. You need to make that decision. But the effect of that is that teams will make different decisions and it actually makes it extremely hard for any central team to support everything. So you have to have those teams supporting the decisions that they’ve made, paying the price. If you choose a flaky queue, you’re the one that’s going to have to operate it.
You can mitigate this a bit by making things someone else’s problem. So you shouldn’t spend time installing and operating Kafka if you could get away with using the queue that your cloud provider offers, similarly with databases. Why install and run a database if you can just get someone else to do that for you? And ideally, you choose something where backups and everything else is done for you by someone else. So lots of the FT runs on Oracle because that makes things very easy. Where we run on AWS, we want to move away from installing our own software onto, you see two instances. We want to use the things that we’re offered from AWS. So we’re going to use Kinesis, we’re going to use Aurora, all the things that just make it someone else’s problem.
Simon Woodley is talking later in this conference. I really recommend seeing him. He’s an IT strategist. One of the things he talks about is how successful technologies go through this cycle. It starts off when it’s something for experts, and then after a while everyone is doing it, but they have to build their own solutions. Finally someone who will convert it into a product and eventually it becomes ubiquitous and it’s made into a commodity. And an example of this is electricity. Nowadays you wouldn’t build your own power station. Another example is compute. You should just be using AWS or equivalents rather than installing your own data center. So the next step from that is to think, “Well, actually buy rather than build.” If commodity is available, use it, unless it’s critical to your business. The only time where you want to be doing stuff yourself is where it is the differentiator for you and the customization that you can do is critical for your business.
The Level of Risk
Another thing about operating microservices, and moving fast generally, is you need to work out what level of risk you’re comfortable with. And it’s going to be different for different organizations. The FT are not a hospital or a power station. We’ve had this conversation within the FT. No one dies if we make a mistake when we release something to our website. And this is not to say that we’re cavalier about it. Now, clearly, we really care about security, we care about personal data, all our business critical functionality, we think carefully before we do release, but we are not as worried about releasing something that maybe move things around on the website. As long as we can fix it quickly, identify and fix it quickly because we value releasing often so we can experiment. That’s the decision that we’re making.
Grey Failure
With microservices, distributed architectures generally, you have to accept the you’re generally be in a state of a “grey failure.” Something’s not working. The only thing that matters is, is it having an impact on the business functionality? So if you’ve got a VM that’s down and pods are being moved around but you’ve got multiple instances, that’s probably okay. Charity [Majors] is great. She works at Honeycomb, she’s got so much to say about observability. I really like that she says, “You have to embrace failure and hard lean into resiliency.” So things are going to fail, build resilience in, so that your system will recover without you having to do anything.
Retrial and failure is pretty essential for this because you might be calling an instance that’s being patched or is moving to another VM, but you need to be careful about it because if you just retry you can have a thundering herd problem where service is just getting back up to its feet and you send thousands of requests to it and you knock it over again. So back off and retry. An exponential backoff is quite good. You wait maybe half a second, then second, then two seconds. But this can quickly add up to quite a lot of time, so it’s quite a good idea to set some kind of time budget. Set ahead as saying, “If you use a service, get this request and it’s already two seconds since I sent it, just stop because there’s no point.” But you need everything to handle that. But it’s a good idea, the time budget.
This is something developers find quite difficult because I think we naturally want to fix things. We want to work out what went wrong and then fix it. Mitigation is normally quicker. So this is probably something that will be familiar to a lot of people. The discussions where you say, “Well, this thing is broken.” Well, there was a release that just went out. Yes, but the release can’t possibly have caused it. And after maybe 20 minutes, 30 minutes of debate, you roll back the releasing, it fixes the problem. So mostly roll it back. See if it fixes the problem. Work out why later. If you’ve got two regions, failover. That’s basic. And then work out, then indulge in your excitement in investigating the problem.
Monitoring
You need to make sure you know when something’s wrong. It is extremely easy with microservice architecture to get inundated with alerts because you just start monitoring for all your systems. But what you want to know is what’s actually broken? What’s the impact on your customers? So concentrate on the business capabilities. For us, that’s something like, are we able to publish content right now? We do something that we call synthetic monitoring. So it’s monitoring, it’s happening in production all the time and it’s synthetic because it’s not a real event. What we do is we want to publish an article every minute to check for that published queue is working. And actually, we take an old article that doesn’t normally change and we just publish it. So it looks a bit like this. We have a service, and it sends in a publish event using exactly the same mechanism as all our content management systems do. The box of the bottom is our system, it’s a bit simplified. And then we just read the same API’s that our website read and check that the update made it through. And we monitor it the way we monitor anything else. It’s got a health check endpoint, and basically it’s healthy as long as publishing is working.
The cool thing about this is actually doesn’t matter what changes in the box below because you’re only poking at one end and reading at the other end. It’s very resilient to changes in your architecture, and also there are no data fixtures required. We’re running this in production on real data, and because, for the content platform, we don’t have any personal data, we can just copy all of the data to staging and run it there as well. And this is also useful because it lets us know whether the publishing is working, even if no one is actually currently publishing real content. And news publishing can have peaks and troughs. Before we had something like this, if we had an alert in place to say, “Has anything not been published for a couple of hours?” The chances are that alert is going to fire on Christmas day because no one published anything on Christmas Day. You really don’t want alerts that are most likely to bother you on a bank holiday.
Synthetic monitoring is great but it’s not enough because you also need to make sure that you know whether real things are working in production. Our editorial team is very inventive. They’ve had to work around the limitations of systems for so long that they will try something out and see if it manages to get published successfully. So that means that we need to check what they’re doing when they publish, but it also means we need to decide, “What do we mean by publish being successful?” We have two regions. And when you publish an article, it goes into MongoDB, Neo4J, ElasticSearch, and S3. So actually, a successful publish has to get to eight different destinations. And that’s complicated to do with normal monitoring, so we wrote service to do that monitoring. It listens to notifications of publish events and it just checks everything where that event should be and it waits for two minutes. And if it doesn’t happen in that time, effectively it says, “I’m unhealthy. You need to republish this bit of content.” And because publishing an article is idempotent, we can just republish it. And then basically, we end up with eventual consistency, even if sometimes we have to publish it a few times.
Observability
You need to build observability into your system. And the reason you need to do this is because the way that you debug microservice is completely different from how you do in monolith. So I remember working on the monolith, something would go wrong, you’d work out how to replicate it, you’d attach a debugger in your step three, and your logs were probably pretty shocking because you never really had to rely on them. With microservices, you probably can’t run your entire stack locally. You need to be reliant on the stuff that you’ve got there in production to work out what was going on.
Observability is, can you infer what was going on in the system by looking at its external outputs? So generally, with our systems that’s logged metrics monitoring. And you want those to be good enough that you can basically work out what went wrong.
Log Aggregation
Log aggregation is important because the events that you’ve got into microservices architecture are all over the place. They’re in different services, they’re on different VMs. You need to aggregate them all together somehow. You might need to do sampling, you might need to get rid of some of them. You can do things like keep all the error logs, but sample the successful ones. What we do is we remove all the logs that are just from our health checks from the monitoring. But you still need the ability to find the logs for a particular event because there’ll be lots of logs, whatever you’re doing. And we do that using a transactional IDE. And we wrote this ourselves because the service meshes and tracing services weren’t around when we were doing it. So we expect that to be a header on a request that has a unique identifier. And every service has to output that in logs and pass it on to any other services. And if it doesn’t get a transactional IDE, it will generate one. And we have a library for doing this. So it’s pretty easy to add it to any new service, and it’s essential. When you’re trying to debug something, you find the transactional IDE, you can find all the logs.
Metrics
Metrics in measuring something over a period of time. It’s really easy when you start with microservices to measure a lot of metrics and then get completely overwhelmed by how much you’ve got. I would say that you need to look at the metrics for services closest to your user because any problem that’s happening on a read between the user and the database is going to be shown in that service that’s closest to them. And keep it simple. You want to know how many requests you’re getting, how long it’s taking for those requests to respond and what the error rate is.
With any system, you’re always doing migrations and upgrades. So it might be that, as we did build your own cluster orchestration, and now Kubernetes is ready and you want to move to it. It might be that you need to just upgrade a database version. It could be that you actually made a decision and you’ve realized it wasn’t the right decision. So you’re always doing these changes. But we have 150 microservices in the content platform. You don’t want to have to release 150 services to do an upgrade. You want to try and make it so that you can have some centralized way of doing it. So for example, with deployment pipelines, we have templates. So we can easily create new deployment pipelines, but also we can easily update them. So if our security team says, “Oh, we want to add some security scanning into all your deployment pipelines,” we add it in one place and all of the pipelines get updated.
Service Mesh
We don’t use the service mesh because they just didn’t exist when we started with this. I would totally use that if I was building microservices now, because the service mesh can take on lots of things like back off and retry, rooting, load balancing, log aggregation, all the things that we’ve built into our systems with individual libraries. The problem for us is if we have to update a library, we have to release a lot of services. Service mesh can do that for you. And it means that your microservices focus on your business functionality, not all these other things that need to be there just to have a network of systems.
Any code base has bits that don’t change that much. The difference between a monolith and microservices is that can mean that there’s a service that you haven’t actually released for years. We’ve got some microservices that we probably haven’t released in two years. And what’s interesting with that is, if you haven’t done it, are you sure you could when you needed to do it? You don’t want to find that out at the point where there’s a security vulnerability that you need to patch urgently. And we’ve had a couple recently. We had to upgrade node for all our node services, we had to upgrade Kubernetes. You really don’t want to be working out when nothing is working at that point. And we have one team at the FT that builds all of their services overnight. They don’t deploy them, they just build them. So at least they know that the build is not working and they can do small fixes along the way.
What Happens When People Move On?
The final thing I want to talk about is what happens when people move on, when the team gets smaller, when people move on to new challenges and the people you’ve got maybe weren’t involved in a lot of the decisions. I think it’s critical to make sure that every system is owned. And I think the system needs to be owned by a team. It’s not enough to say, “Oh, yes, Luke knows about this system,” because what happens if Luke leaves the FT or he’s busy working on something else where he can’t make the time to fix it? You need to know that if there is a security vulnerability, this team is on the hook to fix it. This is a difficult discussion that we struggle with our product people, which is, if you don’t invest enough to keep the system running, you should shut it down. Some of the people at the FT in product would like to believe that systems just run with no effort for years, but it isn’t true. Particularly with microservices, you need to maintain a level of knowledge of the system, the ability to fix it.
Operational documentation is important, but when you’ve got thousands of systems, it’s really hard to keep it up to date. We started with a search for a runbook library. So literally just template, fill out a runbook. And it was interesting. As we moved to microservices we started to struggle with it a bit. And Liz [Fong-Jones] is talking in a couple days’ time, I’m really looking forward to that talk. She basically says, “Don’t over-invest in runbooks.” I’m going to slightly disagree and say, “Work out what’s important in your runbook.” I agree that the troubleshooting steps are probably a record of past failures and they’re not going to help you this time because everything that you do is probably different. Every failure is probably different. But what you do want to know is, who owns this system? Where is the code? How do I look at the logs? How do I find the metrics? All the things that are going to help you. How do I do a restore? That stuff is going to be useful. It’s going to useful for me if I look at it six months after I last worked on it.
One thing we did get right at this point was system codes. Everything has a unique system code and we use it in our logs, we use it in alerts, we tag our AWS resources with it. But we needed to represent all this information as graph with microservices in particular. When I moved from the content platform team, we had to do 150 updates of individual runbooks to stop me being the tech lead. You don’t want to do that. It’s a graph. It’s like there was a relationship with a team with a tech lead. So we have a graph, we have people, teams, systems – and this is the start. We want to represent all kinds of system information into the single store, and then something like a runbook view is just one view of our systems. And then if I move team, all you have to do is say the tech lead is basically someone else and that’s one update. It’s still a challenge because there’s a lot of information here and no one likes updating documentation, so it helps if you can give people something in return.
And one thing we’re working on the moment is a new monitoring dashboard system in the FT that we’re building and we’re calling it Heimdall, because Heimdall is the God that can see everything everywhere. Apparently He is hearing it so good that He can hear wool growing on sheep. What we’ve done with this is we look at that graph of system data, and provided you’ve created everything correctly, you just get a dashboard for free. This is a new thing at the FT. You used to have to maintain your own dashboards before. And we found that as we started putting information on to this, so for example, we started showing whether you said that this system was decommissioned, we found people went, “Oh, actually, it’s not decommissioned,” and they’d fix up the data. So this is about basically giving something to people that will encourage them to make sure the data is correct.
Use practice stuff. You do not want to be trying something at 2:00 in the morning when you just been woken up and discover that the documentation is wrong or you don’t have access rights to do this thing. So practice is important.
It’s back to that Continuous Delivery thing. Continuous Delivery means that releasing code is not scary, you do it all the time. You want all your operational stuff to be really similar, something that is totally not scary and you just know how to do it.
Failovers, database restores. These are the basics, they’re the starters. Basically, can Dino have to fail over to another region? Do you know how to restore the database and have you practiced it? We practice failing over ft.com weekly and different people do it every time. So we know that we’re testing those steps, we know that the documentation is correct.
Chaos engineering is, obviously, cool. The engineers love the sound of it. The business are absolutely terrified of the thought. And I know some people are changing the wording because of that, but it’s not about unleashing chaos. And there’s a whole load of talks about this that I know are coming up and they will be really interesting. It’s not about unleashing chaos. You need to, first of all, understand what your steady state is. What does your system actually look like when it’s working successfully? What kind of noise do we expect? Is it alert-free? And then you look at what you can change. So what can I do? And you want to minimize your blast radius. You do not want to be breaking things in production deliberately. It does not make you popular.
And then you basically think, what are you expecting to see happen? Are you expecting alerts to fire? Do you think that latency will go up? Will there be an increased rate of errors? And then you run the experiment, and you see if you were right. And what we found is that often we were wrong. In particular, what we normally find is no alert is fired even though we took down one region and we would have expected an alert to fire. And this is useful.
Conclusion
Wrapping up – building an operating microservice is hard work. It’s much harder than the monolith, but I think it is worth it. You have to prepare for legacy by maintaining knowledge of the services that are live. You have to invest in it. It’s basically that you have to garden, you have to get rid of the weeds and keep things clear. And you need to plan now. If you’re building microservices, think about the case in three or four years’ time where you’ve got a skeleton team trying to maintain 150 microservices. That could be extremely difficult. Basically, plan for that build things in. And remember that it’s about the business value, so keep an eye on whether you’re still able to move fast. If you’re stopping moving fast, you’re losing the benefits, but you’re still paying the cost.
See more presentations with transcripts
MMS • RSS
Article originally posted on Data Science Central. Visit Data Science Central
Here is our selection of featured articles, news, and resources posted since Monday:
Resources:
- Choosing from Popular Python Web Frameworks
- How do I learn AI using Python?
- Ensemble Methods in One Picture
- Advanced cross-validation tips for time series
- SVMs in One Picture
- News: Data Science Competition with $1 Million in Prizes
- All About Using Jupyter Notebooks and Google Colab
Articles:
- News: Microsoft Joins $250 Million Funding in DataBricks
- Now that We’ve Got AI What do We do with It?
- The importance of Alternative Data in Credit Risk Management
- Best Practices for Implementing ML in an Organization
- IoT – Transforms the world to Smart Planet with Smart Machines
- Data Science: What to Expect in 2019
- How TensorFlow is helping in maintaining Road Safety
Enjoy the reading!
MMS • RSS
Article originally posted on Data Science Central. Visit Data Science Central
This article was written by Datapred.
In a previous post, we explained the concept of cross-validation for time series, aka backtesting, and why proper backtests matter for time series modeling.
The goal here is to dig deeper and discuss a few coding tips that will help you cross-validate your predictive models correctly.

Introduction – The problem of future leakage
The key to efficient time series modeling is not model sophistication, but avoiding “future leakage”: information that should be on the right side of the (moving) train/test partition, but that is leaking to the left side – thus corrupting model performance.
The problem is that future leakage, while easy to understand, is often hard to detect.
First life saver – Training window management
The first priority to avoid future leakage is to make sure your model stops training as soon as it catches up with the prediction target.
That is quite simple in principle, but remembering and coding it every time you build a machine learning solution for time series is cumbersome and risky. It is much better to automate it, if you can.
Second life saver – Feature shifting
Managing the prediction target correctly is not enough – you also need to handle your features correctly. With time series, this often involves lots of data shifting along the time axis.
The reason is that some features, while technically in the past, may include information about the future. For example a marketing plan disclosed last month may specify the company’s marketing spend for the next 12 months. In that case:
- The feature “marketing plan”, while time-stamped at t – 30, actually informs us today about the next 12 months.
- So you want to shift that feature to today, and use it to predict the next few months.
Such shifts complexify training window management considerably, thus increasing the danger of future leakage.
Coding them from scratch with Python or R is challenging, especially with multiple project contributors and/or for solutions that require hyper-parameter optimization. Ideally, you want to automate and recycle the shifts as much as possible.
If you can’t do that, the next section may save your life.
Third life saver – The zero test
Knowing how to avoid future leakage is great, but how can you quickly check that your code is safe?
For that, we use a simple and effective technique that we call the “zero test”. It consists in running your model twice: once with the regular target, and once where target values following a certain date are set to zero:
- artificial_target = real_target.copy()
- artificial_target[zero_date:] *= 0
The predictions of the resulting machine learning pipelines should be identical up to zero_date + [prediction horizon], and differ after that. If they start differing before that date, congratulations – you have detected future leakage.
To read the whole article, with examples and illustrations, click here.
DSC Resources
- Free Book and Resources for DSC Members
- New Perspectives on Statistical Distributions and Deep Learning
- Deep Analytical Thinking and Data Science Wizardry
- Statistical Concepts Explained in Simple English
- Machine Learning Concepts Explained in One Picture
- Comprehensive Repository of Data Science and ML Resources
- Advanced Machine Learning with Basic Excel
- Difference between ML, Data Science, AI, Deep Learning, and Statistics
- Selected Business Analytics, Data Science and ML articles
- Hire a Data Scientist | Search DSC | Find a Job
- Post a Blog | Forum Questions
MMS • RSS
Article originally posted on InfoQ. Visit InfoQ
After having seen and evidenced the tangible benefit of lean at Mashreq Bank, agile was seen as a natural progression, an evolutionary step. Agile and lean are well-linked; you still need to identify waste, and remove non-value add activities so you can spend more time doing what the customer needs, argued Steve Snowdon, head of lean at Mashreq bank. Together with Ed Capaldi, a strategic advisor and agile business coach, he spoke about Mashreq Bank’s Lean Agile Journey at the Lean and Agile ME Summit 2019.
Snowdon stated that the goal of agile was to work in a more collaborative way, to get decisions closer to the customer, and to provide a better structure so that they could more quickly respond to the customer-driven demand, rather than push products/services at them.
Capaldi stated, “I believe in kaizen and kaikaku as central concepts all companies must value; I will therefore only get involved in a transformation if I see these. In this case I was pleasantly surprised by the passion Steve and his team had in wanting to fully understand agile and these concepts were clearly there, and the fact they also come from a lean background just like me helped.”
“The head of the division was also massively behind the transformation and we very quickly agreed the metrics that would track progress,” Capaldi mentioned. He said that agile is a journey; he prefers to challenge his clients in that they aren’t really trying to be agile, and that it’s ok to start with “fake agile”. Fake it till you make it!, he said
Leadership must be from the very top, said Snowdon. He mentioned that Mashreq’s CEO is passionate about customer centricity. At the EXCO level, each business head needs to see how lean agile helps him in both achieving his strategic goals, but also believe in the improved collaborative way of working with the key enablers needed to run his business area, argued Snowdon.
He further stated that leadership is needed every day, every week. “Going to Gemba” (the shop floor) is a must for senior management to help drive the importance via daily Scrums, and challenging blockages; it shows everyone how important this is and that it’s not the next “fad”.
Capaldi explained that leadership is built through building trust, and through open transparent tracking of progress and kindling many fires from smoldering coals. He suggested to use “war rooms”, OKRs and the agile rituals to create the right habits in leadership.
InfoQ spoke with Steve Snowdon and Ed Capaldi after their talk about Mashreq Bank’s lean agile Journey.
InfoQ: What made you decide to merge Agile and Lean practices?
Steve Snowdon: If you are structured in a way that you can also increase the speed of making customer driven change …remove silos through an Agile structure and way of working…then you will truly be differentiating in the market.
Ed Capaldi: I left university having studied Toyota Quality Management, then joined the leader in deploying cloud solutions back in 1998, where we were playing with certain approaches such as XP. In other words, as an agnostic I have always merged the two; my work is with the C level and turning annual budget and strategic cycles into 90 day sprints. I’ll use Agile as a mindset, OKRs and Scrum as accelerators as long as we are laser focused on removing all waste in the system in order to achieve maximum value and achieve class leading profitability, without which it’s impossible not to have awesome employee engagement.
InfoQ: What have you learned during the transformation?
Snowdon: It’s not easy….
- You have to ensure you engage the Business in the design of Tribes, Squads, and also in the setting of the Objectives Key Results. (OKRs). You can’t do it to them, they have to be involved from the start.
- Having a set rules of design principles made it easier to put people’s mind at rest re “losing control”, as we are actually strengthening controls (making more data available, more frequently, and closer to where the decisions are made).
- Ensure that the Agile Manifesto reflects our Organization’s vision and values is key…as people can relate to it better, and understand why we need to focus on one thing over another.
- You will not get your theoretical design perfect in reality from day one…people take time to change…so look for marginal improvements at the beginning…ie a 15 min daily scrum is difficult to grasp when you’ve only had monthly meetings that last two hours…transition your way to the desired behavior, don’t demand to see it overnight…but put a “realistic” timeline in place to see it happen.
Capaldi: I have done many, and every one is different. The biggest learning came from my partner in crime, Arie van Bennekum: agile is a journey, we all know that, but just because it may work in one country does not mean you can cookie cut the transformation when you transform another country. You MUST start from scratch, but with a lot more understanding under your belt. Never assume that what worked in Dubai will work in Egypt or India or Germany. I will not assume anything; each transformation, even in a global business, will be treated differently. On a lighter note, I love guiding my clients in understanding the original Agile Manifesto and rewriting it to suit their culture, and their vision.
InfoQ: If you had a second chance to do it, what would you keep and what would you do differently?
Capaldi: These days, budget permitting, I would always start with three months of rolling out The Five Dysfunctions of a team, and having war rooms from the outset.
Snowdon: Definitely keep the Mashreq’s version of the Agile Manifesto…make it your own… I’d refer to it more however, especially in the first 12 months….i.e reminding people what’s important and why we are doing this. It helps when people get a bit blinkered into their OKR delivery.
Maintain structure of monthly Agile Committee meetings to discuss blockages and progress at Exco and Snr Mgt level.
Setting better timelines for evidence of behavioural changes…ie if a Tribe or Squad is still having 10 OKRs to try and deliver in a Sprint…force better prioritzation.
Be harsher in the “definition of done”. Traditionally, we’ve used a RAG status on many projects (Red, Amber, Green) to break away from that, and state Red or Green (done or not done) is a mindset change as it removes the “comfort zone” of “not quite finished”.
Quicker inclusion of Tech within actual Tribes…and not just Post Box individuals.
Ensure all Squad members have enough empowerment…and use it.
MMS • RSS
Article originally posted on Data Science Central. Visit Data Science Central
Businesses need to effectively manage and plan their day-to-day activities, business strategies and future planning. To efficiently collect and manage all such information, Enterprise Resource Planning (ERP) has become crucial to all kinds of businesses.
ERP slowly became a part of businesses from the 1990s and now it has expanded to every small business and major corporation in the world. ERP is indispensable to manage thousands and thousands of data regarding accounting, customers, procurement, etc. ERP is a central system that holds the major details of the business operations together. It can help in automating transactions, avoid duplicate records and maintain proper flow of movement over the business.
Cloud ERP – The Present and Future of Efficient Business Operations
Nowadays, having only the transactions of the business operations on a single database isn’t sufficient enough. Businesses need to bring every single action of the company from a single point of access like Customer Relationship Management (CRM), Supply Chain Management (SCM), Enterprise Performance Management (EPM) and Human Capital Management (HCM). To bring all these different databases together, a cloud platform is necessary.
Imagine having a Microsoft dynamics 365 on-premise ERP system. Any new systems that the company may need will be provided by individually run software that doesn’t have any connection with each other. Soon enough, the company will have a lot of different databases and software running on its own disjointedly that results in complete lack of collaboration between the departments.
A lot of businesses are still relying on the on-premise ERP system battling with business flow issues every single day. According to research, around 60% of business with one ERP system in place still use on the on-premise version. How efficient would it be if these businesses can save themselves the trouble of using individual systems for different applications and instead let the ERP sync with other systems?
Cloud ERP eliminates all complex coordination problems in a company all bring all the business activities under single access. The data entered through the ERP will be synced across the other platforms avoiding data duplication or loss.
The High Time When You Need Cloud ERP
Cloud ERP helps in maintaining the flow properly across all systems helping the employees from any headaches regarding the coordinated activities.
Still wondering the need to update to cloud ERP? Here are a few reasons why you need to make the shift now.
Your Business is Anything but Agile
Agility has become the mantra for any business operation but if your company lacks agility, then it probably is losing all of the productive hours in doing mundane tasks. Cloud ERP helps a business become agile eliminating all the clutter of confusions and help the employees focus on the real task at hand. The information added in the cloud ERP is available on the server which can be accessed from any device, any time one wants with just a good internet connection.
Microsoft Dynamics 365 is one such service which brings together ERP, CRM and other business operations in a single cloud platform helping the employees to work from a single place.
Your Clients Are Complaining
You may miss to send out the products to the clients in the time promised. You may have skipped making payments to the vendor before the deadline. You may have run out of stock at the exact same time you had to deliver.
All of these problems are due to the lack of coordination between the departments which is exactly due to the absence of integration between systems. When the business operations and the customer management along with the supply chain and procurement are accessed under the same roof, it can bring all these issues to a stop and help the employees focus on more things important. Dynamics 365 offers integrated cross-platform functions which help in providing better customer experience.
You struggle to Make Informed Decisions
Well, you have got the data you want in the ERP but ERP isn’t just about collecting data and maintaining records. Instead of letting the collected data go futile, businesses can actually use it for analysis and improvements.
The business intelligence of a company depends majorly on how efficiently they make use of the resources at hand. An integrated cloud ERP system can bring together data from multiple platforms and analyse, helping to identify the competent areas and improve business performance.
The ERP dashboard in Microsoft dynamics cloud services can seamlessly integrate and bring all the required data together to make important business decisions. It facilitates this analysis, creates graphs and builds up reports reducing the time spent on business planning and help in reaching data-supported decisions.
You Worry A Lot About Data Security
When you have your own on-premise ERP, it involves a lot of security measures enabled by the IT persons. The security of the ERP is as good as the IT department you hired.
In cloud ERP, all the security measures are monitored by the providers who have stronger security encryptions and effective authentication in place. Cybersecurity is centralized and doesn’t leave any space for security vulnerabilities.
Microsoft has pulled at all stops to make Dynamics 365 the safest platform to store and work with data. The work of the IT department will also be cut down as Microsoft will become responsible for your data security.
MMS • RSS
Article originally posted on InfoQ. Visit InfoQ
Swift 5 has recently moved out of beta with the release of Xcode 10.2, including new language and standard library features, stricter memory exclusivity access guarantees, ABI stability, and more.
Most new syntax features added to Swift 5 do not break old source code. This has an exception for features that were removed because they were not intended in the first place and only worked due to some compiler glitches. An example of this is the removal of enumerations taking a variadic argument list, which will now trigger a compiler error:
// this will trigger an error in Swift 5:
enum X {
    case foo(bar: Int...)
}

// replace with this:
enum X {
    case foo(bar: [Int])
}
Swift 5 also introduces raw strings, which bring a new syntax to unclutter string literals containing double-quotes or backslashes by removing the need to escape them. For example, instead of writing:
let quote = "String may contain "quotes"."
let regex = "([^)]+)"
You can write:
let quote = #String may contain "quotes".#
let regex = #([^]+)#
The only exception to the no-escape rule is string interpolation. In raw strings, you need to use the syntax #(...), instead of (...), because simple backslashes are interpreted literally and would not produce any interpolation.
At the standard library level, one of the most significant new features are SIMD types, which provide support for accelerated computation on small vectors and matrices. Standard library in SIMD types are an evolution of SIMD support provided by the simd framework. Old types, such as float2, float3, etc. are now aliases of the new standard library types so old code can compile without problems. The advantage brought by the new SIMD types is they are first-class citizens in Swift Standard Library, meaning they conform to a number of general protocols such as Hashable, Equatable, and Codable, so you can easily integrate with other Standard Library types. Additionally, they provide a larger set of operators for vector-scalar arithmetic. All of this might require some changes in existing code to remove extensions that are not needed anymore, in case their functionality is already packaged within the Standard Library.
A number of other changes in Swift 5 may require fixes for existing code bases. In particular, you cannot override the hashValue property for NSObject and you should override the hash property; the Sequence protocol does not define a SubSequence subtype anymore and uses Array for the same purpose.
InfoQ already covered several new Swift 5 features, including ABI stability, dynamically callable types, improved keypaths and try? operator, and extended string interpolation, when Swift 5 first become available in Xcode 10.2 beta. Additionally, the new Result type and memory exclusivity access were covered in two distinct articles.
MMS • RSS
Article originally posted on Data Science Central. Visit Data Science Central
With increased digitization comes the need for infrastructural stability and safety. That’s where TensorFlow can provide maximum returns, especially in the road safety domain. On-road traffic accidents can be minimized with greater efficiencies in overall traffic management. There is also greater control and oversight when dealing with multiple vehicles across various roads.

Introduction: What is TensorFlow?
TensorFlow is a Python-friendly open source library that can be used for complex computation, making Machine Learning more efficient. With a convenient front-end API, it allows developers to execute complex tasks using existing libraries in neural mapping, deep learning, etc. The technology can be used to train and run complex neural networks for a variety of tasks.
Since it is an AI library, it can be used to design robust models involving complex dataflow graphs. Each node within the dataflow graph shows a mathematical operation, with each connection being a multidimensional array (tensor).
Development teams can create neural networks of large scales, that have multiple layers interacting with one another. It can then help in managing complex structures, like road safety management, through data provided from smart cameras, sensors and radar detectors.
The challenges of road safety management
Road safety is a critical area that every economy is tackling head-on. According to estimates by WHO, close to 1.25 million people enter into a fatal accident each year, with an additional 20-50 million injured globally. Accidents also cost countries upwards of $518 Billion each year, reflecting around 1-2% of their individual annual GDPs.
Road safety has become one of the most pressing matters in today’s day and age. With the rise of driverless vehicles and on-road traffic mapping, countries are facing even more layers of complexities. They are using modern solutions to understand the challenge from a technological level, by employing AI and Deep Learning.
How TensorFlow is enhancing road safety
TensorFlow is allowing increased visibility and clarity in the flow of traffic, among other areas. This is giving local and state departments increased information about how traffic is being managed from end to end. They can then visualize the data better and come up with better conclusions that can work at scale. Other areas like congestion analysis, critical junctions and peak-hours analysis are also being extracted from the core framework.
1. Analyzing rush-hour (peak) traffic
Using information derived from sensors, radars, and cameras, TensorFlow can analyze data holistically. It can provide key time-slots, areas, roads, and traffic stops, where the likelihood of congestion is higher. Drivers may become anxious and enter into an accident more frequently, which is what the framework can capture mathematically.
It can take into account the speed limits, road surface and weather conditions to measure the flow of traffic over time. This can give significant insight to road-safety departments that are looking for ways to ease congestion during these hours.
2. Predicting car accident risk
The risk of a car accident involves multiple factors. These factors may also be localized to certain neighborhoods or even times of the day. That’s why a platform such as TensorFlow is so successful. It can take in massive amounts of real-time information to give you a more dynamic prediction model for better on-road safety.
A marquee example of this was in the state of Iowa, USA. The TensorFlow framework was used to provide insights into traffic behavior. Officials at the Iowa Department of Transportation were able to predict the risk of a car crash, especially during extreme weather conditions. This helped mobilize rescue teams and auto-repair solutions to come to the scene of a crash quicker.
3. Greater knowledge of on-road conditions
TensorFlow provides greater insights into on-road conditions at any time. In places where the weather changes significantly, within the hour, it’s important to have the right data at your fingertips. TensorFlow can create a real-time map of on-road conditions, giving greater control to departments within the public sector.
The technology is also allowing greater integration of on-road data with other public systems. This can aid ambulances to arrive on time, and public transport systems to run seamlessly. Everything from a pot-hole to a crash site can be captured by a robust TensorFlow application.
4. Driving behavior over specific roads
Driving behavior can be mapped over specific roads and avenues, to understand the best ways to prevent accidents. TensorFlow can use Flow/Density models to calculate relative speeds. These relative speeds can help in judging driver performance and susceptible hot-spots within the geography.
Cameras can also analyze driver behavior over time by using time series neural networks to create detailed models. Predictive speeds can be calculated over certain roads, giving more authority to traffic departments to take preventive action.
5. The effectiveness of safety measures
When traffic departments install safety compliance measures like signs, billboards, key messaging and patrol vehicles, the effectiveness can be tested using TensorFlow. Using historical datasets and predictive mapping, the framework can set goals for the measures over time. The results of the safety measures and campaigns can then be tested and enhanced upon at scale.
Teams can also set out to create hypotheses based on the data presented. Areas such as road expansion, highway development, and increased stop signs can be tested using the model developed. This makes the utility of technology more robust and comprehensive.
The potential of TensorFlow for better Road Safety
In the near future, TensorFlow development can be used to predict accidents in real-time. With greater access to real-time information, it can analyze car speeds, dimensions, and road-conditions to give you a standardized dashboard of critical results. Officials can take quicker action based on the insights provided and predict accidents before they even occur.
As the training data becomes more sophisticated, the deep learning model will become expansive. Through this, state departments can run simulations over the network to estimate the impact of critical changes. Stoplight speeds, traffic diversion, and parking zones can be tested from a single screen to give more control over road-safety. The future of road safety management is in good hands, with TensorFlow playing a critical role.
MMS • RSS
Article originally posted on InfoQ. Visit InfoQ
The recently released Babel 7.3 can now parse and compile private instance accessors and the ‘smart’ pipeline operator. Babel 7.3 additionally supports named capturing groups in regular expressions, and much more.
Developers can now use the syntax defined for getters and setters of private instance fields (private instance accessors) by adding @babel/plugin-proposal-private-methods to their babel config. The proposal gives the following example of a custom element’s implementation:
class Counter extends HTMLElement {
  #xValue = 0;

  get #x() { return #xValue; }
  set #x(value) {
    this.#xValue = value;
    window.requestAnimationFrame(this.#render.bind(this));
  }

  #clicked() {
    this.#x++;
  }

  constructor() {
    super();
    this.onclick = this.#clicked.bind(this);
  }

  connectedCallback() { this.#render(); }

  #render() {
    this.textContent = this.#x.toString();
  }
}
window.customElements.define('num-counter', Counter);
get #x and set #x are respectively private getter and setter functions which will respectively retrieve and update the private field xValue. #render is a private method for the class Counter.
Previous Babel releases already implemented private fields and methods for class instances. Static private fields was also already implemented in Babel 7.1, while static public fields and static private methods will be addressed in future Babel releases. Private fields, methods and accessors, whether static or for class instances, are ECMAScript stage 3 proposals. As such they are not considered yet as part of the JavaScript language.
Babel 7.3 also implements the Smart Pipeline Operator proposal’s main proposal. The additional features of the mentioned proposal are not supported in this release. Developers can enable the new syntax with adding the @babel/plugin-proposal-pipeline-operator plugin in their .babelrc config:
{
  "plugins": [
    ["@babel/plugin-proposal-pipeline-operator", { "proposal": "smart" }]
  ]
}
The pipeline operator offers a syntax for computations which can be defined as a flow of data through a pipeline of functions. The details of the pipeline syntax are currently unsettled. There are three proposals for the pipeline operator. The Minimal Pipeline Proposal allows to express function composition such as in:
let newScore = boundScore( 0, 100, add(7, double(person.score)) )
more concisely as follows:
let person = { score: 25 };

let newScore = person.score
  |> double
  |> (_ => add(7, _))
  |> (_ => boundScore(0, 100, _));

newScore
The Minimal Pipeline Proposal does not support await syntaxes in the pipeline. |> await f will result in an early error.
The F# Pipelines Proposal supports await use cases. The proposal illustrates how the following code:
console.log(
  await stream.write(
    new User.Message(
      capitalize(
        doubledSay(
          await promise,
          ', '
        )
      ) + '!'
    )
  )
);
can be flattened with the proposed syntax:
promise
  |> await
  |> (x => doubleSay(x, ', '))
  |> capitalize
  |> (x => x + '!')
  |> (x => new User.Message(x))
  |> (x => stream.write(x))
  |> await
  |> console.log;
The proposal illustrates typical use cases which would benefit from the proposed syntax.
The Smart Pipelines Proposal is a ECMAScript stage-0 proposal. As such, its syntax may see considerable changes in the future. An important alleged advantage of the ‘smart’ proposal is to offer unambiguous semantics. The following code:
input |> await object.method(x, y);
could reasonably mean any of these lines:
await object.method(input, x, y);
await object.method(x, y, input);
await object.method(x, y)(input);
(await object.method(x, y))(input);
In those situations, the ‘smart’ proposal would force an explicit syntax, using # as a placeholder for the piped-in argument:
input |> await object.method(#, x, y);
input |> await object.method(x, y, #);
input |> await object.method(x, y)(#);
input |> (await object.method(x, y))(#);
The Minimal Pipeline Proposal is already supported by in the previous Babel minor release. The F# Pipeline Proposal is not supported yet.
Babel 7.3 implements the RegExp Named Capture Groups proposal, which has been approved as a part of ES2018. The new syntax can be enabled with adding the corresponding plugin @babel/plugin-transform-named-capturing-groups-regex to the Babel config. Alternatively, it is by default included as part of a Babel config including @babel/preset-env.
RegExp named capture groups allow to refer to certain portions of a string that a regular expression matches by name. For instance:
let re = /(?<year>d{4})-(?<month>d{2})-(?<day>d{2})/u;
let result = re.exec('2015-01-02');
The Babel 7.3 release also comes with a host of bug fixes and other improvements, including better TypeScript parsing.
Babel is available under the MIT open source license. Contributions are welcome via the Babel GitHub organization and should follow Babel’s contribution guidelines and code of conduct. Donations to support the project may also be made via Open Collective.