Month: November 2020

MMS • Sergio De Simone

Deno 1.5 Sees 3x Bundling Performance Improvement Due to Rust-Based JavaScript Compiler
MMS • Bruno Couriol
Article originally posted on InfoQ. Visit InfoQ

The team behind the Deno runtime for the JavaScript and TypeScript recently released Deno 1.5. Deno 1.5 improved bundling time by using Rust-based JavaScript/TypeScript compiler swc. Deno further reduces bundle size with tree-shaking and implements the alert, confirm, and prompt web platform APIs. The latter may allow developers to write simple interactive applications in the terminal.
By Bruno Couriol
MMS • Anthony Alford
Article originally posted on InfoQ. Visit InfoQ

As part of the recent macOS Big Sur release, Apple has included the ML Compute framework. ML Compute provides optimized mathematical libraries to improve training on CPU and GPU on both Intel and M1-based Macs, with up to a 7x improvement in training times using the TensorFlow deep-learning library.
By Anthony Alford
MMS • Connor Hicks Bruno Couriol
Article originally posted on InfoQ. Visit InfoQ

Connor Hicks presented at QCon this year the opportunities linked to using Web Assembly outside of the browser. Hicks addressed current and future server-side use cases for WebAssembly. Hicks explains how Wasm and its ecosystem allow developers to craft serverless applications by declaratively composing serverless functions written in different languages.
By Connor Hicks, Bruno Couriol
MMS • RSS
Article originally posted on Data Science Central. Visit Data Science Central
Across industries and enterprises, AI has been the key growth driver, and this is mainly due to the services offered under this technology umbrella. Every industry is now witnessing enhancements in business processes, costs, and efficiency due to AI’s introduction in their field. Depending on the industry, AI offers something unique and has helped the key decision-makers to make fast and accurate decisions based on various implementation solutions.
Talking particularly about the financial sector, the insurance industry has already deployed AI in their domain. An online report states that 54% of insurance firms have started adopting AI technology in their key business processes; however, about 34% of banking & financial enterprises have started adopting the technology. By adopting AI to the fullest, enterprises must understand where and how AI can be implemented to gain maximum benefits.
The financial services sector offers a huge potential for AI as there is a huge volume of data generated by the BFSI Industry. With such huge data, there are numerous opportunities to gain insights and carry out the required data analysis. AI can be used to examine the data fetched to it and come up with results that can be used to create new opportunities and understand the modern-day scenario.
With the growing adoption of digital technologies, the banking sector is now offering services through digital means. The digitalized services have resulted in an increased number of online transactions and growth in customer numbers that are gaining benefits from the digital initiatives. CX or customer experience is one such area that can be improved using AI for quick support and can be easily provided to the customer. Customer experience with AI can be used for offering customized banking solutions as per his requirements.
How AI Benefits the Banking Sector
The following are some common ways in which the banking sector is going to transform itself post the introduction of AI-
- Fraud Detection in Real-Time
The financial and banking sector has been on the receiving end of various frauds. According to McAfee’s online report, scams taking place in the financial sector globally have caused substantial economic losses. However, with the changing landscape of technology, banks have started rapidly transforming themselves by adopting newer mechanisms to combat various threats and frauds. Big Data technology has an important role to play as it provides the banks with in-depth insights regarding customer data and behaviour patterns. Talking about the financial risk mitigation enabled by AI and new financial models will help bank identity fund flow analytics in real-time. Lastly, AI-enabled financial models can be of great help for discovering fraudulent transactions that can be stopped as soon as they are discovered.
- Chatbots for Improving Customer Services
Like other business verticals, it is becoming necessary for the banks to acquire new customers and offer them the services needed for improved customer support. People no longer tend to wait for long hours by visiting the bank branches to gain minor information on interest rates, loans, or services. All of these services are now made available on the bank’s website, and customers can search for the relevant information in a minimum time. Chatbots have proved to be quite handy for various banks as these chatbots have resulted in increased customer satisfaction. People find it tedious to make a call/email the bank for any query in today’s fast-paced life. Instead, they find it easy & convenient to make a converse with a chatbot on the bank’s website. An efficient, systematic as well as accurate conversion results in enhanced customer service levels.
- Better Banking Products
AI can be used to analyze various data and use this data; it can be used to obtain great insights on customer behaviour and preferences. Understanding customer requirements, AI can also serve customers better with the best banking products and solutions. Here, historical data has an integral role in revealing customers’ buying patterns and providing them with the expected products.
- Enhanced Security
With the adoption of new technology, there are always specific challenges that one faces. Talking particularly about the banking sector, it becomes essential for banks to be compliant with industry regulations and protect customers’ private data. The AI technology can be clubbed with various technology algorithms for offering multiple layers of modern, robust security that can minimize any risk of tampering or damaging transactions.
Wrapping Up:
With banks gearing up for AI, they wish to overcome the traditional methods that are being followed. AI can be of great help for the banking sector as it can contribute to modern-day transformation resulting in enhanced overall financial industry growth.
MMS • RSS
Article originally posted on Data Science Central. Visit Data Science Central
Consistent asset health across many levels from cell sites to regions is critical to ensure uninterrupted operations for telecom operators. However, proactively identifying anomalous patterns like equipment malfunction remains a major challenge. Drawing on Subex’s deep implementation experience, this paper describes the chief steps necessary to deploy successful pattern detection solutions. It also examines some high impact use cases for pattern detection that have systematically delivered value for telecom carriers.
Introduction
High operational efficiency is an important differentiator for telecom operators establishing their brand reputation on consistency and service availability. Aberrant usage patterns in voice, data, and SMS services can indicate underlying issues that may escalate into larger problems. Consider how variations due to power outages, technical failures, or competitor expansion can lead to unfulfilled SLAs and revenue loss. Thus, area managers must consistently monitor key performance indicators (KPIs) across various cell sites, clusters, and regions to stay ahead of business disruption at an operational level.
Most CSPs use mostly manual and reactive processes to identify anomalies. Any attempt to deep dive into the root cause and take corrective action means using traditional dashboards or combing through lengthy performance analytics reports. These approaches are largely error-prone and often fail to account for changing trends, seasonality, and inconsistencies within the data.
Automating pattern detection
Automated machine learning solutions can help telcos address the above challenges. Data-centric frameworks are used to capture and cleanse historical data, which is automatically fed into machine learning models that learn from these large datasets. This uncovers patterns and, in turn, predicts daily usage levels across each geographical area.
Being an automated solution, consistent tracking is a key feature. All deviations of the actual KPIs from preset values within particular geography are calculated. Large deviations or significant anomalies are instantly highlighted in a dashboard for immediate remediation by the appropriate area manager.
Implementation Approach
Apache Hadoop has industry-leading distributed processing capabilities for big data. As such, Hadoop is a useful tool to process XDRs into trainable datasets that can be fed into advanced machine learning algorithms to detect anomalies. In the context of telecom, these anomalies refer to spikes and drops in daily usage. The key steps in a machine learning-driven pattern detection solution are:
Step 1: Ingest the data – An automated process is set up to push data from various sources to Apache Hive (data warehouse) using real-time streaming platforms that capture information like session duration, charges received, location, etc. This granular data must be processed, wrangled, and structured to form analytical datasets.
Step 2: Choose the algorithm – When building the framework, it is crucial to choose the right algorithm, one that scales easily and addresses data complexity. Some important parameters to consider when evaluating multiple forecasting techniques are:
- Ability to identify outliers and missing data
- Ability to learn at speed and scale when needed
- Handling dramatic changes in the time series
- Integration and automation capabilities
- Customizability and interpretability
- Scope for including domain-specific effects
After a thorough evaluation of regression models like autoregressive integrated moving average (ARIMA), Holts-Winters, and others, it is observed that Facebook’s Prophet algorithm satisfies the above parameters and can be implemented quickly. It allows users to easily customize forecasts. The model can also be fed domain knowledge through human-interpretable parameters, further improving forecast accuracy. Having worked with a tremendous amount of real-world telecom data, Subex has extensively evaluated the performance of Prophet and finds it to be 8-10% more accurate than traditional techniques.
Step 3: Deploy the model – Once the Prophet algorithm is implemented using R, the input data feeds to it must be established using connectors from Hadoop to R. The model should be updated on a daily basis with usage data, data from each cell site, etc., to stay abreast of latest changes and trends.
To set the hyperparameters, the cell sites can be grouped by clusters or regions and analyzed accordingly. Alternatively, hyperparameters can be set for groups based on the cell site category (2G, 3G or 4G), K-means clustering, or other classification techniques. Data is further split into training sets and test sets in the ratio of 4:1. For example, the first 80 days are dedicated to training sets and the next 20 days are for testing. Once the hyperparameters are set for each group based on the group’s trend analysis, the Prophet model can be looped for each cell site using training data. Any threshold breach – either a spike or a dip – can be flagged as an anomaly. The anomalous cell site will be tagged and the details pushed back into the Hive to be viewed on the dashboard.
Step 4: Visualize the output – The Apache Hive table (written by the machine learning module in R) contains information of all cell sites that experience spikes or dips in a single day.
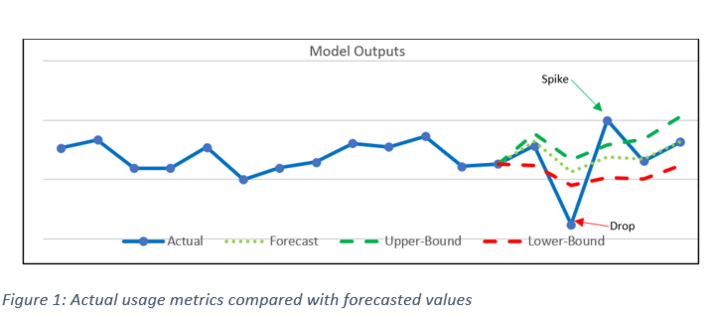
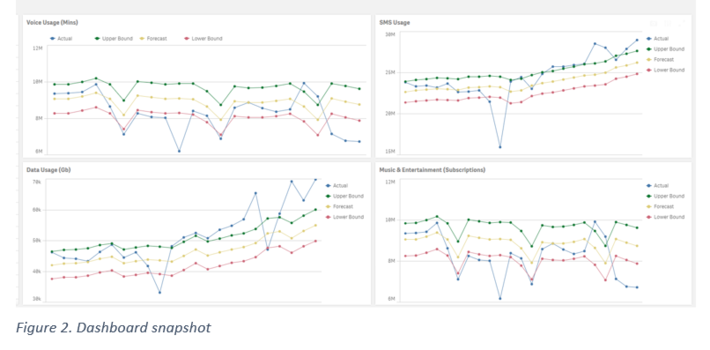
This information includes the preset thresholds and forecasted values and the actual usage metrics, and the magnitude of deviation between forecasted and actual metrics. Associated geographical hierarchies for the anomalous sites are also highlighted. The Hive tables are integrated with a dashboard platform such as Qlik Sense to enable faster decision-making, making visualization easier.
Benefits of pattern detection
Machine learning-based pattern detection helps telecom operators transform tedious, manual, and reactive monitoring of multi-level operational assets into an end-to-end, touchless, and highly efficient process.
An example here is how Subex helped a leading African communication service provider implement pattern detection to improve on-site asset and usage monitoring. Some of the key benefits achieved were:
- Effort savings – 20-30 man-hours are saved every month through effective anomaly detection that considers seasonality, trend, holidays, and change points.
- Higher productivity – Area managers can pinpoint the root causes of anomalies across cell sites by simply observing information on the dashboard.
- Site improvements – With the multi-country rollout, the telco was able to log anomalies as they occur. They identified nearly 30 cases of anomalous incidents across 1600 sites, over 100 clusters, and 8 regions.
- Relevant insights – They could accurately label the reasons for usage decline as power outages, airtime recharge problems, customer relocation, competitor influx, drastic tariff hikes, etc.
- Faster decision-making – The telco can perform timely corrective site-specific actions such as refuel schedule modifications, targeted marketing campaigns, and site upgrades.
Subex case studies: Telecom-specific applications of pattern detection
Declining usage data spurs swift action, boosting customer retention by 90%
Using Subex’s Analytics Center of Trust, a telecom operator noticed several anomalies being reported on its international voice usage across major cell sites. A closer look revealed that many of its dual sim subscribers had shifted to a lucrative international plan launched by a competitor. In response, the telco swiftly rolled out an attractive counter bundle, enabling it to retain 90% of at-risk customers. This helped the telco save USD 250,000 in monthly losses.
Anomaly detection helps telco arrest revenue leak and underlying fraud
An important 4G cell site of a telco major was flagged for unusually high usage of the airtime credit service (ACS). Root cause analytics indicated that 5 users were misusing one of the ACS channels, making multiple borrowings of USD 10,000 in credit. The Subex solution identified the fraud within 24 hours, triggering immediate action by barring the fraudsters’ accounts. Subsequently, the ACS channel’s security flaws were rectified, averting losses to the tune of USD 120,000.
Exploiting market forces to improve customer stickiness
Faced with a sudden spike in data service usage in a specific area, a telecom operator began to analyze regional anomalies. Reports indicated that many new customers had joined in due to service disruption in a competitor’s network. Customer tendency to hold multiple SIM cards led to nearly 10,000 new subscribers. The operator rapidly rolled out a campaign to increase customer stickiness for its data services, achieving significant incremental data revenue.
Remedying minor anomalies in network availability yields major cost savings
Network cell site availability is a primary metric for network health. However, many telcos do not have visibility into how poor network availability impacts the business. For a telecom operator struggling with network availability issues, Subex implemented a pattern detection solution that set KPI thresholds and established automated monitoring processes. Daily anomaly detection of even minor network issues equipped the operator with the right information to take speedy action, helping them save USD 1 million per month.
Enhancing customer experience with pattern detection
Faced with multiple customer complaints regarding poor network experience during evening hours, a CSP decided to implement pattern detection to understand the root cause. Insights from the model revealed that customer complaints were 2.3 times higher compared to other areas. However, they could also rule out network congestion as a likely cause since usage patterns showed only a few subscribers residing in the cell site.
Conclusion
Maintaining asset health through continuous monitoring is an important capability for telcos looking to sustain their business edge through strong service delivery. Automated and machine learning-based pattern detection solutions are emerging as a useful way to keep track of usage trends while applying advanced analytics and sensible visualization. To ensure high returns on investment, CSPs should develop the right business cases and plan solution rollout. Subex possesses deep implementation experience and industry-leading solutions to guide operators on automating pattern detection for revenue and productivity gains.
Pattern detection helps mitigate risk, make decisions faster and identify fraud. Get in touch with us at info@subex.com to know more.
MMS • RSS
Article originally posted on Data Science Central. Visit Data Science Central
 |
|||||||
| Data Science Central Weekly Digest, 23 Nov 2020 | |||||||
|


MMS • RSS
Article originally posted on Data Science Central. Visit Data Science Central
The model-free, data-driven technique discussed here is so basic that it can easily be implemented in Excel, and we actually provide an Excel implementation. It is surprising that this technique does not pre-date standard linear regression, and is rarely if ever used by statisticians. It is related to kriging and nearest neighbor interpolation, and apparently first mentioned in 1965 by Harvard scientists working on GIS (geographic information systems). It was referred back then as Shepard’s method or inverse distance weighting, and used for multivariate interpolation on non-regular grids (see here and here). We call this technique simple regression.
In this article, we show how simple regression can be generalized and used in regression problems especially when standard regression fails due to multi-collinearity or other issues. It can safely be used by non-experts without risking misinterpretation of the results or over-fitting. We also show how to build confidence intervals for predicted values, compare it to linear regression on test data sets, and apply it to a non-linear context (regression on a circle) where standard regression fails. Not only it works for prediction inside the domain (equivalent to interpolation) but also, to a lesser extent and with extra care, outside the domain (equivalent to extrapolation). No matrix inversion or gradient descend is needed in the computations, making it a faster alternative to linear or logistic regression.
1. Simple regression explained
For ease of presentation, we only discuss the two-dimensional case. Generalization to any dimension is straightforward. Let us assume that the data set (also called training set) consists of n points or locations (X1, Y1), …, (Xn, Yn) together with the response (also called independent values) Z1, …, Zn attached to each observation. Then the predicted value Z at an arbitrary location (X, Y) is computed as follows:
Throughout this article, we used
with β = 5. The parameter β controls the smoothness and is actually an hyper-parameter. It should be set to at least twice the dimension of the problem. A large value of β decreases the influence of far-away points in the predictions. In a Bayesian framework, a prior could be attached to β. Also note that if (X, Y) is one of the n training set points, say (X, Y) = (Xj, Yj) for some j, then Z must be set to Zj. In short, the predicted value is exact for points belonging to the training set. If (X, Y) is very close to say (Xj, Yj) and further away from other training set points, then the computed Z is very close to Zj. It is assumed here that there is no duplicate locations in the training set otherwise, the formula needs adjustments.
2. Case studies and Excel spreadsheet with computations
We did some simulations to compare the performance of simple regression versus linear regression. In the first example, the training set consists of n = 100 data points generated as follows. The locations are random points (Xk, Yk) in the two-dimensional unit square [0, 1] x [0, 1]. The response was set to Zk = SQRT[(Xk)^2 + (Yk)^2]. The control set consists of another n = 100 points, also randomly distributed on the same unit square. The predicted values were computed on the control set, and the goal is to check how well they approximate the theoretical (true) value SQRT(X^2 + Y^2). Both the simple and linear regression perform well, though the R-squared is a little better for the simple regression, for most training and control sets of this type. The picture below shows the quality of the fit. A perfect fit would correspond to a perfect diagonal line rather than a cloud, with 0.9886 and 0.0089 (the slope and intercept of the red line) replaced respectively by 1 and 0. Note that the R-squared 0.9897 is very close to 1.
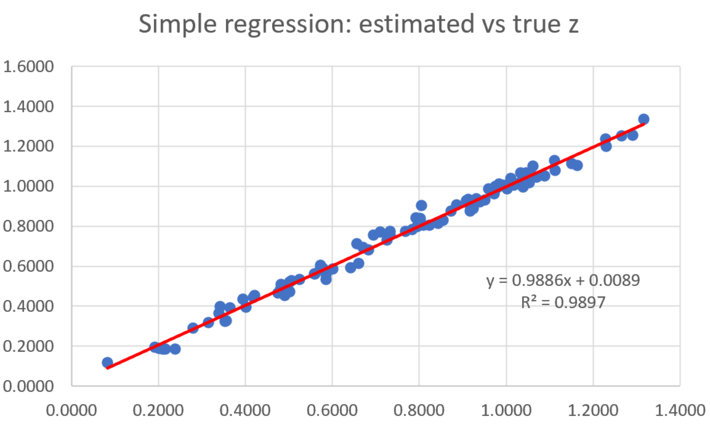
Figure 1: data set doing well with both simple and linear regression
2.1. Regression on the circle
In this second example, both the training set and control points are located on the unit circle (on the border of the circle, not inside or outside, so technically this a one-dimensional case). As expected the R-squared for the linear regression is terrible, and close to zero, while it is close to one for the simple regression. Note the weird distribution for the linear regression: this is not a glitch, it is expected to be that way.
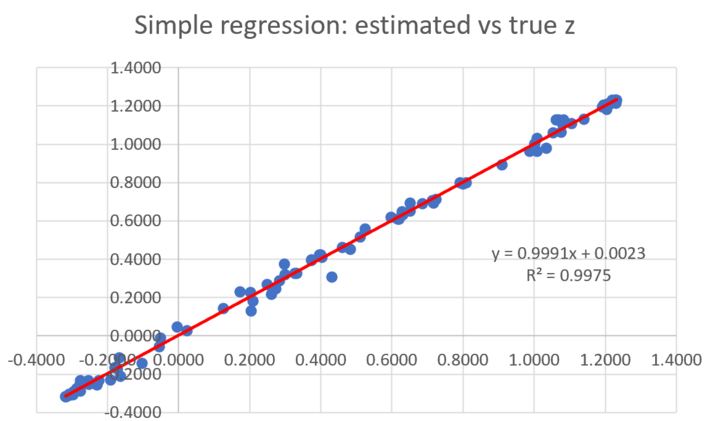
Figure 2: Good fit with simple regression (points distributed on a circle)
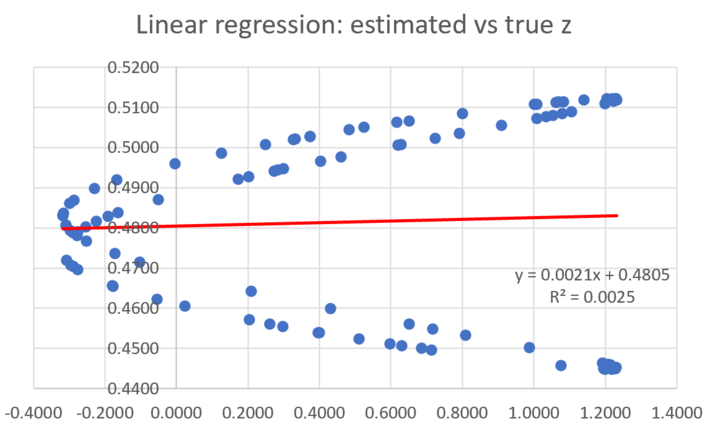
Figure 3: Bad fit with linear regression (points distributed on the same circle)
2.2. Extrapolation
In the third example, we used the same training set with random locations on the unit circle. The control set consists this time of n = 100 points located in a square away from the circle, with no intersection with the circle. This corresponds to extrapolation. Both the linear and simple regression perform badly this time. The R-squared associated with the linear regression is close to zero, so no amount of re-scaling can fix it. The predicted values appear random.
However, even though the simple regression results are almost as much off as those coming from the linear regression with respect to bias, they can be substantially improved, very easily. The picture below illustrates this fact.
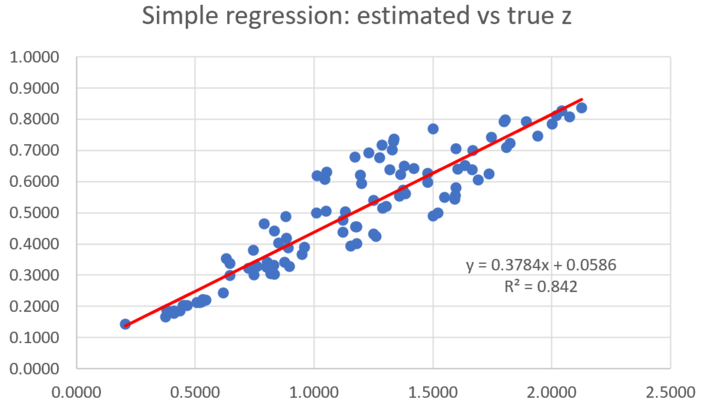
Figure 4: Testing predictions outside the domain (extrapolation)
The slope in figure 4 is 0.3784. For a perfect fit, it should be equal to one. However the R-squared for the simple regression is pretty good: 0.842. So if we multiply the predicted values by a constant so that the average predicted value, in the square outside the circle, if not heavily biased anymore, we would have a good fit with the same R-squared. Of course, this assumes that the true average value on the unit square domain is known, at least approximately. It is significantly different from the average value computed on the training set (the circle), thus the bias. This fix won’t work for the linear regression, with the R-squared staying close to zero after rescaling, even if we remove the bias.
2.3. Confidence intervals for predicted values
Here, we are back to using the first data set that worked well both for linear and simple regression, doing interpolation rather than extrapolation, as at the beginning of section 2. The control set is fixed, but we split the training set (consisting this time of 500 points) into 5 subsets. This approach is similar to cross-validation or bootstrapping, and allows us to compute confidence intervals for the predicted values. It works as follows:
- Repeat the whole procedure 5 times, using each time a different subset of the training set
- Estimate Z based on the location (X, Y) for each point in the control set, using the formula in section 1: we will have 5 different estimates for each point, one for each subset of the training set
- For each point in the control set, compute the minimum and maximum estimated value, out of the 5 predictions
- The confidence interval for each point has the minimum predicted value as lower bound, and the maximum as upper bound.
Of course the technique can be further refined, using percentiles rather than minimum and maximum for the bounds of the confidence intervals. The most modern way to do it is described in my book Statistics: New Foundations, Toolkit and Machine Learning Recipes, available here to DSC members. See chapters 15-16, pages 107-132.
The striking conclusions based on this test are as follows:
- The CI (confidence interval) based on simple regression is about 50% larger on average than the one based on linear regression
- The CI based on simple regression contains the true value 92% of the time, versus 24% of the time for the linear regression.
That 24% is not bad given the fact that only 5 predictions per location are used. Indeed a 20% would be expected. What is striking is the 92% achieved by the simple regression. Part of it is because the simple regression CI’s are larger, but there is more to it.
2.4. Excel spreadsheet
All the data and tests discussed, including the computations, are available in my spreadsheet, allowing you to replicate the results or use it on your own data. You can download it here (krigi2.xlsx). The main tabs in the spreadsheet are
- Square
- Circle-Interpolation
- Circle-Extrapolation
- Square-CI-Summary
The remaining tabs are used for auxiliary computations and can be ignored.
4. Generalization
If you look at the main formula in section 1, the predicted Z is the quotient of two arithmetic means. The one at the numerator is a weighted mean, and the one at the denominator is a standard mean. But the formula will also work with other types of means, for example with the exponential mean discussed in one of my previous articles, here. The advantage of using such means, over the arithmetic mean, is that there are hyperparameters attached to them, thus allowing for more granular fine-tuning.
For example, the exponential mean of n numbers A1, …, An is defined as
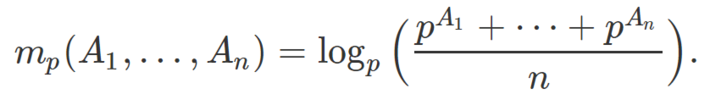
When the hyperparameter p tends to 1, it corresponds to the arithmetic mean. Here, use the exponential mean with
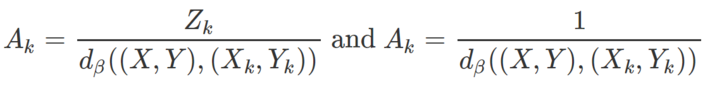
respectively for the numerator and denominator in the first formula in section 1. You can even use a different p for the numerator and denominator.
Other original exact interpolation techniques based on Fourier methods, in one dimension and for points equally spaced, are described in this article. Indeed, it was this type of interpolation that led me to investigate the material presented here. Robust, simple linear regression techniques are also described in chapter 1 in my book Statistics: New Foundations, Toolkit and Machine Learning Recipes, available here to DSC members.
About the author: Vincent Granville is a data science pioneer, mathematician, book author (Wiley), patent owner, former post-doc at Cambridge University, former VC-funded executive, with 20+ years of corporate experience including CNET, NBC, Visa, Wells Fargo, Microsoft, eBay. Vincent also founded and co-founded a few start-ups, including one with a successful exit (Data Science Central acquired by Tech Target). You can access Vincent’s articles and books, here.
MMS • Eran Stiller
Article originally posted on InfoQ. Visit InfoQ

Engineers at Dropbox designed a distributed async task framework (ATF) that can handle tens of thousands of async tasks scheduled per second. ATF’s main feature is its ability to enable developers to define callbacks and schedule tasks that execute against these pre-defined callbacks.
By Eran Stiller
Next.JS 10 Brings Automatic Image Optimization, Internationalized Routing, and Web Vitals Analytics
